Homeolog expression quantification methods for allopolyploids
Tony Kuo
1,2, Masaomi Hatakeyama
3,4,5, Toshiaki Tameshige
6,
Kentaro K. Shimizu
3,6, Jun Sese
1,2,∗1Artificial Intelligence Research Center, AIST, 2-3-26 Aomi, Koto-ku, 135-0064, Tokyo, Japan 2
AIST-Tokyo Tech RWBC-OIL, 2-12-1 Okayama, Meguro-ku, 152-8550, Tokyo, Japan
3
Department of Evolutionary Biology and Environmental Studies, University of Zurich, Winterthurerstrasse 190, CH-8057, Zurich, Switzerland
4
Functional Genomics Center Zurich, Winterthurerstrasse 190, CH-8057, Zurich, Switzerland
5
Swiss Institute of Bioinformatics, Quartier Sorge - Batiment Genopode, 1015 Lausanne, Switzerland
6Kihara Institute for Biological Research, Yokohama City University, 641-12, Maioka, Totsuka-ku, 244-0813,
Yokohama, Japan
*authors for correspondence
Abstract
Genome duplication with hybridization, or allopolyploidization, occurs in animals, fungi, and plants, and is especially common in crop plants. There is increasing interest in the study of allopolyploids due to advances in polyploid genome assembly, however the high level of sequence similarity in duplicated gene copies (homeologs) pose many challenges. Here we compared standard RNA-seq expression quantification approaches used currently for diploid species against subgenome-classification approaches which maps reads to each subgenome separately. We examined mapping error using our previous and new RNA-seq data in which a subgenome is experimentally added (synthetic allotetraploid Arabidopsis kamchatica) or reduced (allohexaploid wheat Triticum aestivum versus extracted allotetraploid) as ground truth. The error rates in the two species were very similar. The standard approaches showed higher error rates (> 10% using pseudo-alignment with Kallisto) while subgenome-classification approaches showed much lower error rates (< 1% using EAGLE-RC, < 2% using HomeoRoq). Although downstream analysis may partly mitigate mapping errors, the difference in methods was substantial in hexaploid wheat, where Kallisto appeared to have systematic differences relative to other methods. Only approximately half of the differentially expressed homeologs detected using Kallisto overlapped with those by any other method. In general, disagreement in low expression genes was responsible for most of the discordance between methods, which is consistent with known biases in Kallisto. We also observed that there exist uncertainties in genome sequences and annotation which can affect each method differently. Overall, subgenome-classification approaches tend to perform better than standard approaches with EAGLE-RC having the highest precision.
1
Introduction
Genome duplication, termed polyploidization, is widespread in plants with up to 35% of land plants being recent polyploids [1]. Many crop species in particular are allopolyploids [2], which involves the hybridization of two different species with genome duplication. Thus, there is much interest in the study of genome duplication and the advantages or disadvantages this phenomenon may convey. In order to explore the underlying mechanisms that may provide adaptation, many gene expression studies have been conducted on both natural and synthetic allopolyploid species [3, 4, 5, 6, 7, 8]. Allopolyploid species have traditionally been difficult to analyze at the whole genome scale due to the large size of their genomes and the high levels of sequence similarity between duplicated chromosomes. These duplicated gene copies, called homeologs, are in general highly similar and pose challenges to gene expression analyses. However, these homeologs and bias in their expression are of great interest because they potentially contribute to adaptation in polyploid species [9, 10, 11].
Recent improvements in long sequencing read technologies and linkage strategies [12, 13, 14] have allowed for breakthroughs in polyploid genome assembly. In plant biology especially, recent allopolyploid species such as bread wheat [15] as well as many other agriculturally important plant species have benefited [16, 17]. Now that de novo genome assembly for allopolyploids is no longer as formidable as it once was, a large number of polyploid reference genomes are expected to become available in the near future to facilitate genome wide studies. Accordingly, there is a need to evaluate expression quantification methods given the presence of homeologs in allopolyploids. It is possible that the high level of sequence similarity between homeologs may pose challenges to read mapping and consequently, expression quantification as well as other types of sequence analysis. Currently, it is unclear whether the expression quantification methods in use currently for diploids are suitable for allopolyploids due to the lack of studies examining this issue.
In this study we pose the question “can diploid RNA-seq methods be directly applied to allopolyploids?” and evaluate different approaches and methods for homeolog expression quantification in allopolyploids. To evaluate methods in polyploids, analysis on genetic materials with and without subgenomes is highly valuable as a form of ground truth. Here we used synthetic allotetraploid Arabidopsis kamchatica (Fisch ex DC.) K. Shimizu & Kudoh and performed tests with its two direct parental accessions ofArabidopsis halleri and
Arabidopsis lyrata. For hexaploid wheatTriticum aestivum Chinese Spring [18] withABDsubgenomes, we performed tests with tetra-Chinese Spring (AB subgenomes) where the D subgenome was experimentally removed [19] as well asAegilops tauschii the diploid progenitor of the wheatDsubgenome.
We test, to the best of our knowledge, all known approaches to quantify expression in polyploids with four approaches:
1. A standard genome alignment based RNA-seq analysis on the full allopolyploid reference genome with two different alignment tools STAR [20] and LAST [21, 22].
2. A pseudo-alignment based method with Kallisto [23] on the full allopolyploid transcriptome.
3. A subgenome-classification approach with HomeoRoq [7], which maps read sequences to each subgenome separately.
4. A subgenome-classification approach with EAGLE-RC [24], which maps read sequences to each subgenome separately and also explicitly uses genotype variations that discriminate between homeologs as con-straints in analysis.
Our results show that EAGLE-RC had the lowest error rate (A. kamchatica: 0.40%, hexaploid wheat: 0.49%) for alignments to the correct subgenome, while Kallisto had the highest error rate (A. kamchatica: 12.43%, hexaploid wheat: 13.44%). LAST and STAR had similar error rates in A. kamchatica but LAST was more precise in hexaploid wheat. In general, performance between methods were comparable for A. kamchatica but not for hexaploid wheat. We also observed systematic differences in low expression genes that impacted the homeolog expression bias results. Other concerns include uncertainty in the completeness and accuracy of the genome sequence and annotation, which affected each method differently due to differ-ences in constraints. This may be especially relevant as polyploid species have only begun to be sequenced and assembled in large numbers and the gene annotations are in their first iterations. In the face of this uncertainty, EAGLE-RC is the most precise in our evaluations.
2
Methods
2.1
RNA sequence data and reference genomes
We evaluated methods on two allopolyploid species, tetraploid A. kamchatica and hexaploid wheatT. aes-tivum.
The natural speciesA. kamchatica [25, 26] was derived from two diploid speciesA. halleri andA. lyrata
recently [27, 8]. It is a model polyploid with a broad distribution range, self-compatibility and transformation technique [27, 28]. To construct synthetic polyploids, we used two highly homozygous parental accessions used for genome assembly: A. halleri Tada mine W302 (ver 2.2, scaffolds N50 712 kb) [29] and A. lyrata
lyrpet4 (ver 2.2, scaffolds N50 1.2 Mb) [8]. The two genotypes were crossed then the genome doubling was induced by colchicine treatment. Although synthetic polyploidization may occasionally activate transposable elements or induce chromosomal rearrangements, the subgenomes of the synthetic polyploid were derived from the merging of the two parental genomes and are highly or completely identical, providing a unique opportunity to evaluate RNA-seq methods in allopolyploids.
In order to assess classification accuracy in synthetic A. kamchatica, we used data from the parental species so that the ground truth of a read’s subgenome origin is known. A. halleri subsp. gemmifera and
A. lyrata subsp. patraea RNA-seq data [30] was obtained under DDBJ accession DRP003263 submission DRA004364. Briefly, this dataset consists of four samples each for A. halleri and A. lyrata with 2×100 bp paired-end reads for a total of approximately 20 Gb and 21 Gb respectively. For differential homeolog expression analysis, synthetic allotetraploid A. kamchatica RNA-seq data [7] was obtained under DDBJ accession DRP01140. Briefly, this dataset consists of three biological replicates ofA. kamchaticabefore and after cold stress with 2×100 bp paired-end reads for a total of approximately 12 Gb and 10 Gb respectively. The whole genome assembly and annotation for hexaploid wheat T. aestivum with ABD subgenomes was obtained from the International Wheat Genome Sequencing Consortium [18] (assembly ver 1.0 and annotation ver 1.0, N50 22.8 Mb). The assembly quality is at the chromosome level and the reference genome was split intoA,BandDsubgenomes allowing for separate read mapping in subgenome-classification methods.
In order to assess classification accuracy in wheat, we utilized tetra-Chinese Spring in which the AB
subgenomes were extracted by removing theDsubgenome by repeated backcrossing [19]. Thus, the genome sequence of tetra-Chinese Spring must be very close to the AB subgenomes of hexaploid Chinese Spring.
Because there is no genetic material of extractedDgenomes from hexaploid wheat, we usedA. tauschii KU-2076 (resource in Kyoto University, collected in Iran). TheD subgenome of hexaploid wheat is known to be derived from this species, thus it should be highly similar though there is divergence due to within-species variations [31]. We obtained RNA-seq data of tetra-Chinese Spring and A. tauschii in triplicate for a total of 2.1 Gb and 2.8 Gb respectively [data submission in progress]. For differential homeolog expression anal-ysis,T. aestivum RNA-seq data was obtained from NCBI (BioProject PRJEB12358) with SRA accessions ERR120175[2-4] and ERR120177[0-2] describing samples, in triplicate, 24 hours after inoculation of fungal pathogenFusarium graminearum and mock inoculation for a total of 17.3 Gb and 16.1 GB, respectively.
2.2
Plant growth, RNA isolation, and sequencing
The plants were grown at 16◦C in 8h light / 16h dark cycle with 60% relative humidity for two weeks and leaf tissues were harvested. RNA was extracted from each tissue using RNeasy Plant Mini Kits (QIAGEN, Hilden, Germany) in combination with DNase I treatment (QIAGEN). Illumina sequencing libraries were made by TruSeq Stranded mRNA Library Prep Kit. RNA-seq was conducted using Illumina HiSeq 4000 at the Functional Genomics Centre, Zurich.
2.3
Homeolog identification
To annotate homeologs inA. kamchatica, we constructed RNA transcripts from the gene models in theA. halleri andA. lyrata gene annotations. Homeologs were then identified based on reciprocal best hit for each subgenome’s transcripts. We required hits to have E-value less than 10−10 with at least 200 aligned bases in both transcripts, resulting in 24,329 homeolog pairs identified.
To annotate homeologs in T. aestivum, we constructed RNA transcripts from high confidence gene models belonging to theA,B, andD subgenomes, including the UTR regions. We then identified pair-wise homeologs through reciprocal best hit for combinations AB, AD, BD and then triple copy homeologs by checking for genes in AB that share the same hit for D in their respective AD and BD hits, resulting in 21,196 triple copy homeologs identified.
2.4
Standard RNA-seq analysis
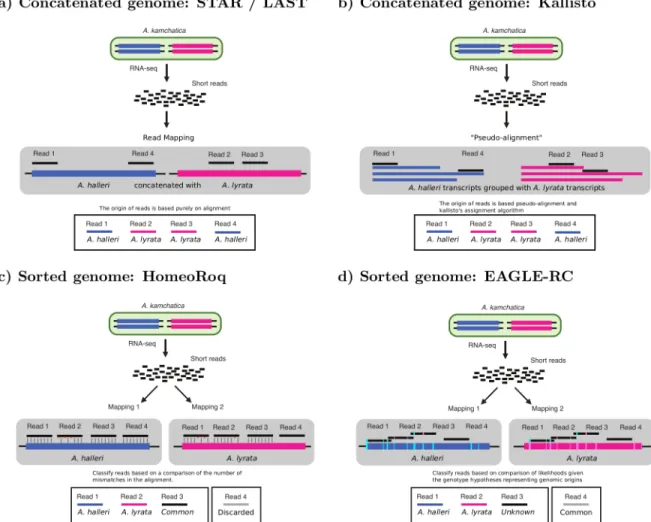
We tested a standard genome alignment based RNA-seq expression quantification approach (Figure 1a) aimed at differential expression analysis [32] that is often used for diploids:
1. Map reads to the allopolyploid reference genome (STAR (ver 2.5.2b) [20], LAST (ver 809) [21, 22]).
2. Count reads using featureCounts [33] at the transcript level.
3. Extract homeolog specific read counts.
To construct the reference genome of A. kamchatica, we concatenated the reference genomes of its two parental species,A. halleri and A. lyrata, to obtain an allopolyploid reference. For LAST, we also filtered out read alignments with MAPQ scores less than 20, while STAR MAPQ scores are not as useful for thresholding. InT. aestivum, we excluded all reads that mapped to chrUn.
We tested a pseudo-alignment RNA expression quantification workflow (Figure 1b) using Kallisto [23], which is also often used for diploids. The built-in expression quantification in Kallisto was used to count
Figure 1: We compare different four approaches for quantifying homeolog expression: a)a standard genome alignment based RNA-seq analysis on an allopolyploid (concatenated) reference genome using alignment tools STAR and LAST.b) a pseudo-alignment workflow using Kallisto that is performed on the (concatenated) transcripts of the allopolyploid. c) a subgenome-classification analysis that performs alignment on each subgenome’s reference separately, then performs read classification based on number of mismatches using HomeoRoq. d) a subgenome-classification analysis that performs read alignment on each subgenome’s reference separately, then performs read classification based on the likelihood of the read to the genotype using EAGLE-RC, discarding common reads.
reads (est counts) at the transcript level. When evaluating classification accuracy, we used the pseudobam option in Kallisto to output read assignments and evaluate the proportion which were misassigned.
2.5
Subgenome-classification analysis
We tested a subgenome-classification approach where, in contrast to the standard approach, the sequencing reads are mapped separately to each subgenome of an allopolyploid’s reference genome (Figures 1c, 1d) using STAR. Then we utilized a read classifier (HomeoRoq, EAGLE-RC) to assign reads to their subgenome origin, if possible.
HomeoRoq [7] (Figure 1c) classifies reads based on the number of mismatches, up to a maximum of 10, between the read and the genome sequence of each subgenome, where reads must be mappable to both subgenomes in order to be considered. In contrast with EAGLE-RC, which requires computing the subgenome-discriminating variants, HomeoRoq does not require comparative analysis between different subgenomes in advance of classification.
The basic EAGLE model [24] is a generative model for read sequences used to calculate the likelihood of a read given a reference genotype hypothesis and an alternative genotype hypothesis. In EAGLE-RC (Figure 1d), the basic model was extended to perform read classification using the variants that discriminate between homeologs. During homeolog identification, subgenome specific genotype differences (i.e. variants) that discriminate between homeologs are determined. ForA. kamchatica, reads are mapped to the reference genomes of A. halleri, H, and A. lyrata, L, separately. EAGLE-RC then calculates the probability given each subgenome as the reference hypothesisGrefand the other subgenome as the alternative hypothesisGalt:
P[r∈Gref] =
P[r|Gref]
P[r|Gref] +P[r|Galt]
,
where the classification is determined by the reference with the highest probability, requiring the winning hypothesis to be at least probability 0.95 with marginal probability at least 0.51, otherwise it is “unknown”, where the marginal probability is the proportion of the winning hypothesis over the sum of all subgenome as the reference hypotheses.
For hexaploidT. aestivum subgenome-classification, we performed a bottom-up workflow using a series of pair-wise classifications (Figure 2). For HomeoRoq, we determined, if possible, the consensus classification from pair-wise classifications. For example, a read is classified asAif there is a consensusAclassification in bothAB andADpair-wise classifications comparisons.
Figure 2: We perform read classification on hexaploidT. aestivum using a bottom-up approach from a series of pair-wise classifications with theA, B, andD subgenomes. A final classification from pair-wise analysis is obtained via consensus for HomeoRoq and via highest probability for EAGLE-RC.
For hexaploid subgenome-classification with EAGLE-RC, the pair-wise likelihoods per read were calcu-lated, where for each reference hypothesisGref, there are two alternative genome hypothesesGalt1andGalt2.
The probability of a read belonging to a given reference is then:
P[r∈Gref] =
P[r|Gref]
P[r|Gref] +P[r|Galt1] +P[r|Galt2]
,
where the classification is determined by the reference with the highest probability, requiring the winning hypothesis to be at least probability 0.95 with marginal probability at least 0.51, otherwise it is “unknown”.
2.6
Differentially expressed homeologs
To identify differentially expressed homeologs (DEH) in A. kamchatica, we used DESeq2 [34] on the read count data for theA. halleri-derived subgenome andA. lyrata-derived subgenome separately. We required a homeolog to be differentially expressed with 0.05 or better False Discovery Rate (FDR) in at least one of the subgenomes. We then performed Fisher’s exact test on the combined read counts to determine significant differential homeolog expression ratio (p-value < 0.05 and fold change ≥2). This definition of differential expression requires significant change in gene expression in at least one subgenome along with the homeolog expression ratio under different conditions.
To find DEH in hexaploid T. aestivum, we used DESeq2 on the read count data for each A, B, andD
subgenomes separately, requiring a gene to be differentially expressed with 0.05 or better FDR in at least one of the subgenomes. We then performed a series of Fisher’s exact test on the combined read counts (A
vsBD,B vsAD,D vsAB) to test for differential homeolog expression ratio. A homeolog is differentially expressed if at least one test has p-value< 0.05/3 and fold change≥2.
3
Results
3.1
A. kamchatica
read classification
Generally, sequence analysis is based on how accurately read sequences can be mapped to the reference. In the case of allopolyploids, read alignment must deal with a higher degree of repetitiveness than in diploids due to homeologs.
We tested the standard genome alignment approach using the widely used RNA-seq read mapping tool, STAR. Though this tool is often used in diploid read mapping, it is unclear whether it will be suitable for allopolyploids. Unfortunately, the mapping quality score from STAR is not suitable for thresholding “uniqueness” due to how it assigns scores in an almost binary manner. Thus we also tested LAST, a general sequence alignment tool that can estimate the probability that an alignment represents the genomic source of the read. For example, a given read aligns to a single location with no mismatches, but aligns to five other locations with one mismatch each. This read may be deemed a unique best hit, but there may be a reasonable probability, depending on read length, that it came from any of the other alignments with a single base-calling error. LAST allows us to set a degree of uniqueness (i.e. 0.05 mismap probability) as a cut-off threshold that is convenient for handling this type of uncertainty.
We examined tetraploid A. kamchatica first because it may be less complicated than hexaploid wheat, which we describe later in this study. Here, we evaluated the accuracy of each tool and each approach by how well they assigned reads to the correct subgenome. ForA. kamchatica, the ground truth is known by testing with pureA. halleri and A. lyrata RNA-seq data. Table 1 shows the classification performance of
each approach forA. kamchatica. One point to note is that the mapping rate is affected by alignments to non-homeologs, thus we also showed the number of homeologs with detected expression in our evaluations.
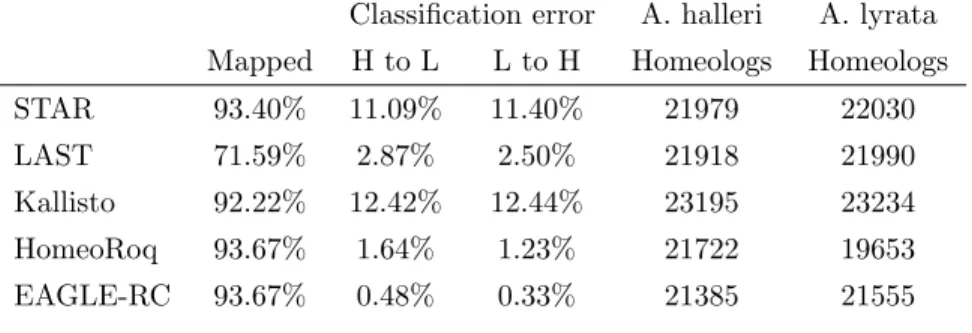
Table 1: Classification performance forA. kamchatica. Results are averaged across 8 samples, 4 each forA. halleri andA. lyrata. The percent mapped refers to the number of reads that were mappable and in the case of subgenome-classification, the number of reads mappable to any subgenome. The classification error refers to the proportion of mapped reads which were assigned to the wrong subgenome. The number of expressed homeologs with>1 read in any sample are also shown for each subgenome.
Classification error A. halleri A. lyrata Mapped H to L L to H Homeologs Homeologs STAR 93.40% 11.09% 11.40% 21979 22030 LAST 71.59% 2.87% 2.50% 21918 21990 Kallisto 92.22% 12.42% 12.44% 23195 23234 HomeoRoq 93.67% 1.64% 1.23% 21722 19653 EAGLE-RC 93.67% 0.48% 0.33% 21385 21555
We calculated the precision by using classification error rate as the criteria. It is clear that subgenome-classification approaches (HomeoRoq and EAGLE-RC) performed better than the standard alignment based approaches (STAR, LAST, Kallisto) using a concatenated genome. In the standard alignment based approach using a concatenated reference genome, LAST’s mismap probability model was seen to be beneficial to read classification showing a much lower classification error rate than STAR.
Kallisto showed the lowest precision among all methods, though it showed the highest number of expressed homeologs detected. That Kallisto’s performance was the most affected by the presence of homeologs is perhaps due to a reduction in the number of unique kmers, relative to diploid analysis, which is essential for the method to find unique read to gene associations. To quantify the reduction in the number of unique kmers in a tetraploid reference relative to diploid reference, we performed a simulation with 1000 trials of 100 randomly selectedA. halleri genes with randomly assigned SNPs at varying degrees of sequence divergence (Table S1). This analysis shows that there is a large reduction in the number of unique kmers given one extra gene copy depending on the pair-wise sequence divergence. For a point of reference,A. kamchatica is estimated to have approximately 2-3% divergence between homeologs [7].
EAGLE-RC showed the highest precision in read classification though it had a lower number of ex-pressed homeologs detected. HomeoRoq was less precise than EAGLE-RC while having a similar number of expressed homeologs detected. The main difference in methodology between EAGLE-RC and HomeoRoq is that EAGLE-RC utilizes genotype information explicitly while HomeoRoq relies on comparing the number of mismatches, implicitly comparing genotype differences. However, simply comparing the number of mis-matches is susceptible to spurious mappings, because a read alignment with 9 versus 10 mismis-matches favors the one with 9 mismatches to the same degree as it would favor an alignment with 0 versus 1 mismatch.
Another point to consider is that the quality of the reference may differ between subgenomes and there may be uncertainty from missing regions or erroneous annotations. HomeoRoq requires reads to be mappable to both references, which constrains read counting to genome regions that exist in both subgenomes. However, this comes with the disadvantage that more divergent regions may be excluded due to reads being mappable to only one homeolog. EAGLE-RC require reads to be mapped to regions that are different between homeologs
and thus can be classified based on those differences, which is constrained to regions in the homeologs’ gene models that can be pair-wise aligned in order to compute the genotype differences between homeologs. We performed a simulation analysis where reads were simulated using ART [35] from annotated gene models with no divergence from the reference and calculated the classification performance (Table S2). The results show that even in this ideal scenario, there were reads which could not be classified with certainty by LAST, HomeoRoq, and EAGLE-RC due to reads mapping equivalently to both subgenomes. It also shows that in ideal conditions, STAR and Kallisto, despite higher error rates, were excellent in their true positive rates. However, the ideal condition of data with no divergence from reference, no sequences outside of annotated genes, and perfectly reflect gene models is not realistic in practice.
3.2
A. kamchatica
homeolog expression quantification
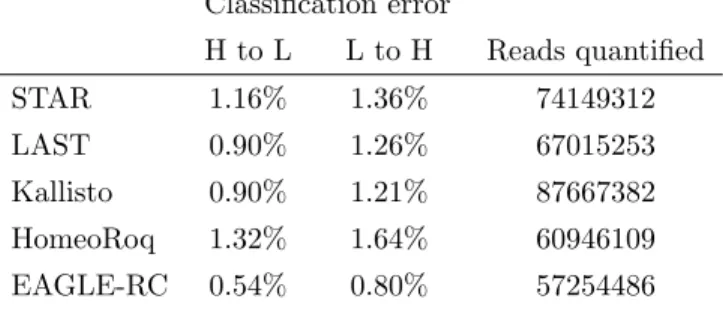
Though read mapping is the foundation, downstream read counting methods and differential expression analysis may potentially be able to correct for artifacts or ambiguity in read alignments. We revisited classification error using the quantified read counts for homeologs in A. kamchatica (Table 2), although we suggest some caution in the interpretation of the number of reads quantified and thus the classification error rate in this result as HomeoRoq and EAGLE-RC have additional expression quantification processes to count subgenome-common reads. For Kallisto, we used the estimated read count from its output while for all other methods, we obtained read counts using featureCounts.
Table 2: Error rate forA. kamchatica using quantified read counts, averaged across 3 samples each forA. halleri (H) andA. lyrata (L).
Classification error H to L L to H Reads quantified STAR 1.16% 1.36% 74149312 LAST 0.90% 1.26% 67015253 Kallisto 0.90% 1.21% 87667382 HomeoRoq 1.32% 1.64% 60946109 EAGLE-RC 0.54% 0.80% 57254486
Here, error is represented as a proportion of quantified reads rather than the proportion of mappable reads in the earlier analysis. Our results show that error decreased in STAR, LAST, and Kallisto as the quantification process accounted for ambiguously mapped reads in some fashion (dropped by featureCounts and distributed by Kallisto). HomeoRoq and EAGLE-RC error rate increased slightly due to these meth-ods discarding reads that are deemed unclassifiable. However, a large number of unclassifiable reads are due to equivalent alignments to both subgenomes, deemed subgenome-common, which can be used to es-timate expression levels such as RPKM by distributing proportionally to each subgenome. This has been demonstrated previously for HomeoRoq [30] and is also applicable to EAGLE-RC. Thus the number of reads quantified for subgenome-classification approaches in Table 2 may not be directly comparable to standard genome alignment approaches. It turns out that for tetraploidA. kamchatica, all methods had comparable error rates, where EAGLE-RC was the most precise.
homeologs across conditions, so we analyzed RNA-seq data fromA. kamchatica and quantified theA. halleri
read count proportion ˆpas follows: ˆ
p= A. halleri reads
A. halleri reads + A. lyrata reads
While we do not know the ground truth expression levels, we can evaluate the concordance between the different methods to describe how results might differ depending on which approach was used. To compare the results between different methods, we calculated the pairwise root mean squared distance (RMSD) and coefficient of determination (r2) between the results for all methods. The RMSD is a measure of the average
distance between two setsX andY:
RMSD =
r Pn
i=1(xi−yi)2
n
The r2 describes how well one variable X can be used to predict another variable Y by calculating the
proportion of variability that can be explained:
r2= ( Pn i=1(xi−x¯)(yi−y¯)) 2 Pn i=1(xi−¯x)2P n i=1(yi−y¯)2
Though both measures describe the similarity between the results of different methods, the RMSD quantifies the magnitude of difference with units while ther2 quantifies the proportion of similar elements.
We examined the ratio of homeologous pairs using RNA-seq data from A. kamchatica samples before and after cold stress. The r2 (Table 3) and RMSD (Table S3) for ˆpshow that in general, the results from
the standard genome alignment based approach were concordant (average r2 = 0.9505, RMSD of 6.96%).
HomeoRoq was also concordant (average r2 = 0.9084) with STAR and LAST. This is consistent with the error rates in the classification results.
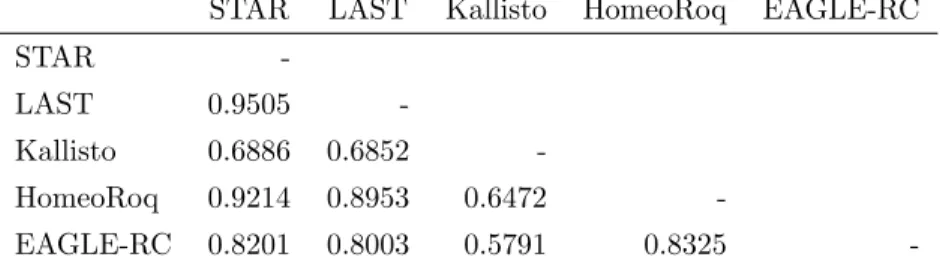
Table 3: r2of the proportion of reads derived from theA. hallerisubgenome between different quantification
approaches for homeologs inA. kamchatica.
STAR LAST Kallisto HomeoRoq EAGLE-RC
STAR
-LAST 0.9505
-Kallisto 0.6886 0.6852
-HomeoRoq 0.9214 0.8953 0.6472
-EAGLE-RC 0.8201 0.8003 0.5791 0.8325
-The generally high r2 between methods showed that though read mapping precision can vary greatly,
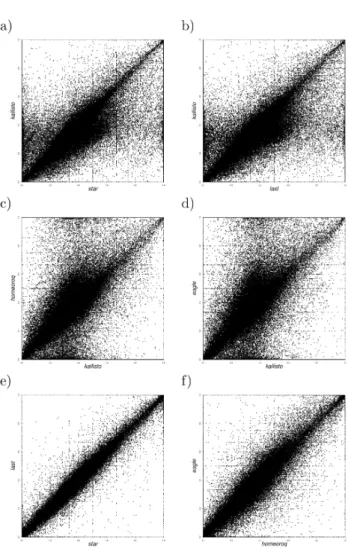
downstream read counting methods were somewhat able to correct for artifacts or ambiguity in read align-ment to arrive at a similar quantified expression. Kallisto was discordant from all other methods with an average RMSD of 18.88%. This may be due to its built-in read counting method using Expectation Maxi-mization (EM) whereas all other methods used featureCounts, which does not consider multi-mapped reads. There were also issues with low expression genes where 420 and 447 A. halleri and A. lyrata homeologs respectively, were reported to have near zero expression (< 10 reads) by all other methods in all samples but Kallisto reported >100 reads. The homeolog expression ratio scatter plots reflect this potential arti-fact (Figure S1). Though the cause is unclear, Kallisto tends to over-estimate some low expression genes compared to other methods.
EAGLE-RC also showed less concordance in r2 and RMSD than HomeoRoq to standard genome align-ment approaches, where it reported some high expression genes as low expression compared to other methods. More detailed examination revealed that because EAGLE-RC required reads to cross genotype differences between homeologs, it excluded reads in exons which were not able to be pair-wise aligned. There may exist uncertainty in the annotation, as there are 552 homeologs that had at least a 40% difference in the proportion of the gene model aligned between A. halleri andA. lyrata. The majority of these cases were
A. halleri homeologs having a smaller proportion thanA. lyrata homeologs due to being much longer. The exclusion of regions which were not aligned between homeologs accounted for a large portion of the difference in EAGLE-RC. For example, the homeolog annotated as AT4G25110 inA. kamchatica with 12 exons inA. halleri and 5 exons in A. lyrata and an aligned region between homeologs of 46% and 61% inA. halleri
and A. lyrata respectively, had almost all (99.89%) of the reads assigned to A. halleri mapped to regions that were not aligned between homeologs (Figure S2), leading to a large difference between EAGLE-RC and other methods (Table S4).
The subgenome-classification approach with HomeoRoq or EAGLE-RC tries to account for potentially missing reference genome regions in one subgenome, through consideration of read mappability and explicitly utilizing genotype variation respectively. For example, the homeolog annotated as AT5G45850 inA. kam-chatica had reads that mapped to theA. lyrata reference that did not map at all to theA. halleri reference and was thus discarded by HomeoRoq. Similarly, missing reference genome regions in homeologs cannot be pair-wise aligned, thus EAGLE-RC discarded reads that map to these regions. In other methods, a naive counting of reads could be reference biased (Table S5). In this case, the average ˆp for a sample with the subgenome-classification approach was 0.90 compared to 0.44 with STAR, LAST, and Kallisto.
Next, we examined differentially expressed homeologs (DEH) using RNA-seq data from A. kamchatica
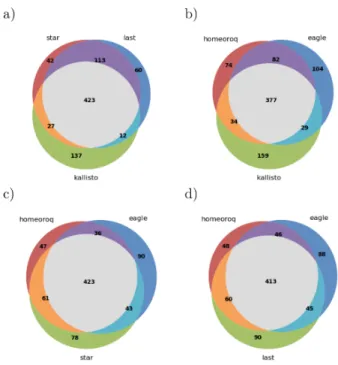
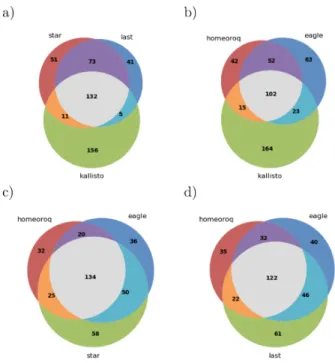
samples before and after cold stress. The results of different methods (Figure 3) showed that in general, there was high overlap between the different methods tested where Kallisto was the least concordant among the methods tested. This is consistent with the results when we examined the ratio of homeologous pairs .
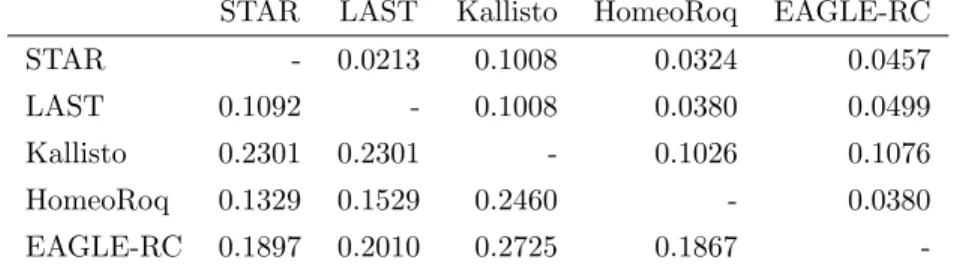
Intuitively, genes with lower expression are expected to be more affected by uncertainties due to read count differences having more of an effect on the proportion (Table 4). Indeed, our results show that the concordance between methods was lower for genes with lower expression with a significant increase (paired t-test p-value 6.767×10−06) in RMSD. This may be due to a higher proportion of reads being ambiguous and
each method’s difference in handling these ambiguously mapped reads. This may have large implications if the goal is to determine homeolog expression bias.
Table 4: RMSD of the proportion of reads derived from theA. halleri subgenome for homeologs with read counts≤100 (lower triangular matrix) versus>200 (upper triangular matrix) inA. kamchatica.
STAR LAST Kallisto HomeoRoq EAGLE-RC
STAR - 0.0213 0.1008 0.0324 0.0457
LAST 0.1092 - 0.1008 0.0380 0.0499
Kallisto 0.2301 0.2301 - 0.1026 0.1076 HomeoRoq 0.1329 0.1529 0.2460 - 0.0380 EAGLE-RC 0.1897 0.2010 0.2725 0.1867
-Figure 3: Overlap of differentially expressed homeologs from different methods inA. kamchatica.
3.3
Hexaploid wheat read classification
For hexaploid wheat T. aestivum, the three homeolog copies compared to two in tetraploids further com-plicates read mapping and also requires a more complex workflow for subgenome-classification. To test classification performance, we used RNA-seq data of a tetraploid wheat line (tetra-Chinese Spring) withA
and B subgenomes, and a diploid A. tauschii line (accession KU-2076) withD subgenome as the ground truth. Table 5 shows the classification performance of each approach.
Table 5: Classification performance for T. aestivum. Results are averaged across 3 samples for each of diploidA. tauschii (D) and tetraploid Chinese Spring (AB). The percent mapped refers to the number of reads that were mappable and in the case of subgenome-classification, the number of reads mappable to any subgenome. The classification error refers to the proportion of classified reads which were assigned to the wrong subgenome. The number of expressed homeologs with>1 read in any sample are also shown for each subgenome.
Classification error chrA chrB chrD Mapped AB to D D to AB Homeologs Homeologs Homeologs STAR 75.83% 9.12% 14.85% 11366 11333 12530
LAST 77.21% 1.62% 2.78% 11505 11437 12847
Kallisto 78.17% 10.17% 16.71% 14794 14847 16032 HomeoRoq 79.73% 0.97% 1.54% 10224 10217 11539 EAGLE-RC 79.73% 0.33% 0.66% 10350 10285 11766
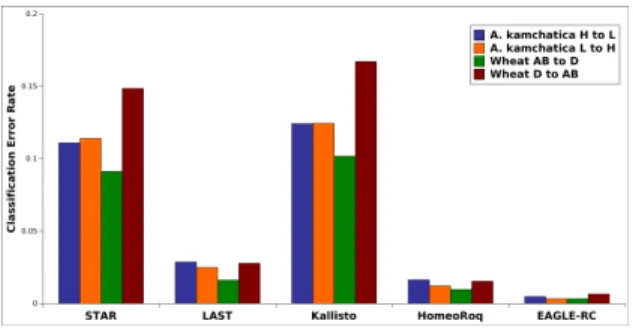
Our results show that the misclassification rate of all methods were strikingly similar for allotetraploid
meth-ods rather than taxon-specific features that affected the error rate where subgenome-classification methmeth-ods showed a higher precision than standard methods using the concatenated genome. Higher precision was obtained in the order of EAGLE-RC, HomeoRoq, LAST, STAR, and Kallisto. For the number of expressed homeologs detected by these methods, Kallisto showed higher counts, which may be spurious because Kallisto tended to overestimate low expression genes relative to other methods as discussed above. Among the other four methods, the subgenome-classification methods showed a slightly lower number of expressed homeologs detected than the standard genome alignment approach, though we do not know which one is closer to the ground truth. EAGLE-RC still maintained a sub 1% error rate, the best among all methods, though it deemed an average of ∼20% of mapped reads as unable to be classified with confidence due to ambiguity between homeolog pairs. There was also a higher cost in computation time for the higher precision (Table S6).
Figure 4: Overall classification error rate in tetraploid A. kamchatica and hexaploid wheatT. aestivum for all methods.
Another point of interest is that the more divergent D diploid line had much higher error rates than theAB line directly extracted from Chinese Spring, which is the reference genome line (Table 5). In this case, STAR and Kallisto performed quite poorly compared to other methods. Divergence from the reference genome appears to be a multiplier for error rate, thus less precise methods will be more affected.
3.4
Hexaploid wheat homeolog expression quantification
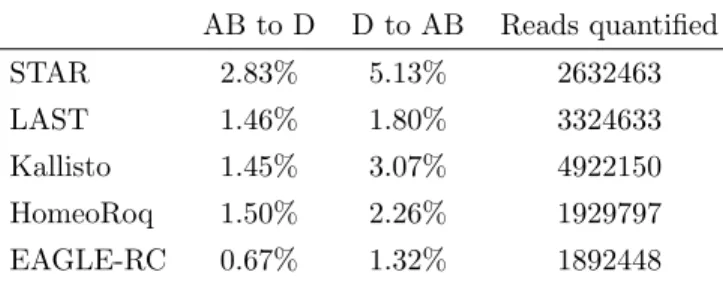
We evaluated the classification error using the quantified read counts for homeologs inT. aestivum(Table 6). As described in the previous section, note that the number of reads quantified are not directly comparable among different methods. Again, for Kallisto we used the estimated read count from its output while for all other methods we obtained read counts using featureCounts.
As expected, the error rate was higher in hexaploid wheat than in A. kamchatica though with similar trends. InABclassification error, STAR had over∼200% higher rate of error, LAST and Kallisto had∼60% higher error, and HomeoRoq and EAGLE-RC were the most robust with∼20% higher error. Similar to the alignment error analysis, the more distant A. tauschii (D) reads had much higher error rates, propagated from errors in the alignment. Again, STAR and Kallisto were the most affected by the increased distance in these samples.
Next we examined homeolog expression shifts across conditions and quantified the homeolog expression ratio inT. aestivum by calculating the proportion of subgenomeAreads ˆpas follows:
ˆ
p= chrA reads
Table 6: Classification performance forT. aestivumusing quantified read counts. Results are averaged across 3 samples for each of diploidA. tauschii (D) and tetraploid Chinese Spring (AB).
Classification error AB to D D to AB Reads quantified STAR 2.83% 5.13% 2632463 LAST 1.46% 1.80% 3324633 Kallisto 1.45% 3.07% 4922150 HomeoRoq 1.50% 2.26% 1929797 EAGLE-RC 0.67% 1.32% 1892448
We examined the homeolog expression ratio using RNA-seq data from T. aestivum samples 24h after fungal inoculation and after mock inoculation. Ther2(Table 7) and RMSD (Table S7) show that relative to
other methods, Kallisto exhibited a large drop in concordance in hexaploid wheat compared toA. kamchatica. The homeolog expression ratios (Figure 5) show that the discordance was largely due to systematic differences in low expression homeologs, which was also a trend for other methods (Figure S3-S5) though not to the degree of Kallisto. Also similar to A. kamchatica, there was some discordance between EAGLE-RC and other methods. In hexaploid wheat, there are 1689 AB, 1549 BD, and 1661ADpair-wise homeologs that have at least a 40% difference in the proportion of the gene model aligned, which may account for much of the discordance between EAGLE-RC and other methods.
Table 7: r2of the proportion of reads derived from subgenomeAbetween different quantification approaches
for homeologs inT. aestivum.
STAR LAST Kallisto HomeoRoq EAGLE-RC
STAR
-LAST 0.9174
-Kallisto 0.3257 0.3342
-HomeoRoq 0.8612 0.8107 0.2787
-EAGLE-RC 0.8310 0.7931 0.2814 0.7958
-Next, we examined differentially expressed homeologs using RNA-seq data from T. aestivum samples 24h after fungal inoculation and after mock inoculation. The DEH results for hexaploid wheat between different methods (Figure 6) show that there was less concordance between methods compared to tetraploid
A. kamchatica. Notably, only 51% of 304 DEH detected by Kallisto were supported by any of the other four methods (47% by STAR, 45% by LAST, 38% by HomeoRoq, 41% by EAGLE-RC). The results here reiterate that discordance was systematic, where Kallisto’s tendency to overestimate low expression reads led to significant differences in the homeolog expression ratio.
4
Discussion
Recent improvements in sequencing technology has reduced the difficulty in constructing allopolyploid refer-ence genomes [12, 13, 14] and there should be a corresponding increase in genome wide studies for
allopoly-Figure 5: Homeolog expression scatter plots for Kallisto versus other methods in hexaploid wheat, quantified as the expression proportion of subgenome A over the total (A+B+D) per homeolog.
Figure 6: Overlap of differentially expressed homeologs from different methods in T. aestivum.
ploids [3, 4, 5, 6, 7, 8]. As such, there is a need to evaluate expression quantification methods given the presence of homeologs in allopolyploids. Unlike expression quantification in diploids, homeolog expression quantification evaluates multiple highly similar gene copies concurrently and it would be ideal if all copies are at a similar level of completeness. This includes the genome annotation, which may be a non-trivial source of uncertainty [36, 37].
It is well known that the presence of repetitive sequences in diploids (paralogs) present technical challenges for read alignment [38, 39] and can bias RNA-seq expression quantification [40]. For polyploids, with the presence of homeologs, there are even more repetitive sequences due to an increase in the number of gene copies. In this study, we saw that applying a standard diploid RNA-seq workflow to allopolyploids may have issues in terms of assigning reads to the wrong subgenome, particularly in hexaploid wheat. In general, low expression genes accounted for most of the discordance between methods. Kallisto especially, often overestimated the number of reads in low expression genes which has been observed in previous studies [41]. If the goal is to determine homeolog expression bias, then accurate quantification of low expression genes is important because small errors can result in large shifts in the expression ratio between homeologs. In addition, the accuracy of expression levels in such genes is especially important if we wish to identify ON and OFF states of gene expression in response to stimuli in time course analyses.
There has long been a discussion and dispute about the bias of expression between homeologs and subgenomes because different species show different patterns [42]. In this study we found that different methods showed different biases, depending on the types of uncertainty they consider. In particular, gene annotation can affect the detection of homeolog expression bias because the exon regions of homeologs are typically annotated using RNA-seq reads on each copy separately and thus may be annotated differently, especially when the expression level of one of the copies is low. To obtain general conclusions on the biased expression in polyploids, we would suggest that analysis be performed with comparable and accurate methods
in corresponding exonic regions. EAGLE-RC attempts to do this by considering only corresponding exonic regions between homeologs.
In our evaluations, we presented results both at the read mapping stage and after expression quantifica-tion. It is difficult to be completely fair when evaluating the accuracy of read mapping due to differences in each of the four approaches. Kallisto does not attempt to identify primary versus secondary alignments, thus a primary alignment only evaluation is not suitable. The standard genome alignment approach may have secondary alignments due to the presence of homeologs, which can be indistinguishable from the pri-mary alignment in terms of alignment score, in which case a pripri-mary alignment is picked randomly. The subgenome-classification approach of mapping reads to each subgenome separately inherently has less sec-ondary alignments, which is an advantage of this approach. Thus we evaluated the classification accuracy with all alignments, as secondary alignment errors are a factor in all approaches though to different degrees. The results after read counting then presents the performance of each approach after potentially accounting for ambiguous alignments. In this way we show the performance at both major steps in the RNA-seq ex-pression quantification process, though there are many other read counting methods that we were not able test. Read counting methods may also benefit from the higher precision of the subgenome-classification ap-proach by utilizing classified reads in lieu of unique mapped reads and distributing ambiguous reads through Expectation Maximization.
5
Conclusion
In this study, we evaluated methods for homeolog expression quantification in tetraploid A. kamchatica
and hexaploid wheat T. aestivum using RNA-seq. We examined the standard genome alignment based approach with STAR and LAST, the subgenome-classification approach with HomeoRoq and EAGLE-RC, and a pseudo-alignment approach with Kallisto.
The presence of homeologs had the largest affect on STAR and Kallisto, resulting in higher read classifi-cation error. We observed that discordance occurred mostly in low expression genes in a systematic manner and can result in large shifts in the homeolog expression ratio. The explicit use of genotype differences between homeologs in EAGLE-RC seems to be a factor in reducing uncertainties in the reference genome and annotation and our results show that EAGLE-RC was the most precise method in both tetraploidA. kamchatica and hexaploid wheat.
Competing interests
The authors declare that they have no competing interests.
Author Contributions
T.K. executed the study and drafted the manuscript. M.H. contributed to data analysis and simulation studies. T.T. contributed to genetic material and data collection. K.K.S and J.S. initated the study, the analysis framework, and contributed to drafting the manuscript.
Acknowledgments
The Aegilops tauschii seeds were kindly supplied by the National BioResource Project-Wheat (Japan, http://www.nbrp.jp). The tetra-Chinese Spring seeds were kindly supplied by Professor Hisashi Tsuji-moto (Tottori Univ.). Dr. Yoshihiro Matsuoka (Fukui Prefectural Univ., Japan), Dr. Hiroyuki Tsuji (Yokohama City Univ.) and Ms. Akina Mitsuhashi (Yokohama City Univ.) provided generous support for Aegilops tauschii cultivation and propagation. We thank Rie Shimizu-Inatsugi for plant experiments, Catharine Aquino and the Functional Genomics Center Zurich for sequencing, Thomas Wicker, Beat Keller, and Cristobal Uauy for valuable discussions.
Funding
JST CREST Grant Number JPMJCR16O3, and a KAKENHI Grant nos. 16H06469, 16H06464, 16K21727, Japan, Human Frontier Science Program, Indo-Swiss Collaboration in Biotechnology, and Swiss National Science Foundation.
References
[1] Wood TE, Takebayashi N, Barker MS, Mayrose I, Greenspoon PB, Rieseberg LH. The frequency of polyploid speciation in vascular plants. Proceedings of the National Academy of Sciences of the United States of America. 2009;106(33):13875–13879.
[2] Renny-Byfield S, Wendel JF. Doubling down on genomes: polyploidy and crop plants. American Journal of Botany. 2014;101(10):1711–1725.
[3] Comai L, Tyagi AP, Winter K, Holmes-Davis R, Reynolds SH, Stevens Y, et al. Phenotypic instability and rapid gene silencing in newly formed Arabidopsis allotetraploids. Plant Cell. 2000;12(9):1551–1568.
[4] Grover CE, Gallagher JP, Szadkowski EP, Yoo MJ, Flagel LE, Wendel JF. Homoeolog expression bias and expression level dominance in allopolyploids. New Phytologist. 2012;196(4):966–971.
[5] Buggs RJA. Unravelling gene expression of complex crop genomes. Heredity. 2013;110:97–98.
[6] Yoo MJ, Szadkowski E, Wendel JF. Homoeolog expression bias and expression level dominance in allopolyploid cotton. Heredity. 2013;110(2):171–180.
[7] Akama S, Shimizu-Inatsugi R, Shimizu KK, Sese J. Genome-wide quantification of homeolog expres-sion ratio revealed nonstochastic gene regulation in synthetic allopolyploid Arabidopsis. Nucleic Acids Research. 2014;42(6):e46.
[8] Paape T, Briskine R, Lischer H, Halstead-Nussloch G, Shimizu-Inatsugi R, Hatekayama M, et al. Pat-terns of polymorphism, selection and linkage disequilibrium in the subgenomes of the allopolyploid Arabidopsis kamchatica. Nature Communications. 2018;provisionally accepted:bioRxiv 248195.
[9] Comai L. The advantages and disadvantages of being polyploid. Nature Reviews Genetics. 2005;6(11):836–846.
[10] Wang J, Tian L, Lee HS, Wei NE, Jiang H, Watson B, et al. Genomewide nonadditive gene regulation in Arabidopsis allotetraploids. Genetics. 2006;172(1):507–517.
[11] Chang PL, Dilkes BP, McMahon M, Comai L, Nuzhdin SV. Homoeolog-specific retention and use in allotetraploid Arabidopsis suecica depends on parent of origin and network partners. Genome Biology. 2010;11(12):R125.
[12] Lu F, Romay MC, Glaubitz JC, Bradbury PJ, Elshire RJ, Wang T, et al. High-resolution genetic map-ping of maize pan-genome sequence anchors. Nature Communications. 2015;6:doi:10.1038/ncomms7914.
[13] Ming R, Wai CM. Assembling allopolyploid genomes: no longer formidable. Genome Biology. 2015;16:27.
[14] Jiao WB, Schneeberger K. The impact of third generation genomic technologies on plant genome assembly. Current Opinion in Plant Biology. 2017;36:64–70.
[15] Krasileva KV, Vasquez-Gross HA, Howell T, Bailey P, Paraiso F, Clissold L, et al. Uncovering hidden variation in polyploid wheat. Proceedings of the National Academy of Sciences of the United States of America. 2017;114(6):E913–E921.
[16] Yuan Y, Bayer PE, Batley J, Edwards D. Improvements in Genomic Technologies: Application to Crop Genomics. Trends in Biotechnology. 2017;in press:doi:10.1016/j.tibtech.2017.02.009.
[17] Hatakeyama M, Aluri S, Balachadran MT, Sivarajan SR, Patrignani A, Gr¨uter S, et al. Multiple hybrid de novo genome assembly of finger millet, an orphan allotetraploid crop. DNA Research. 2018;25(1):39– 47.
[18] (IWGSC) TIWGSC. Shifting the limits in wheat research and breeding using a fully annotated reference genome. Science. 2018;361:doi:10.1126/science.aar7191.
[19] Yang YF, Furuta Y, ichi Nagata S, Watanabe N. Tetra Chinese Spring with AABB genomes extracted from the hexaploid common wheat, Chinese Spring. Genes & Genetic Systems. 1999;74:67–70.
[20] Dobin A, Davis CA, Schlesinger F, Drenkow J, Zaleski C, Jha S, et al. STAR: ultrafast universal RNA-seq aligner. Bioinformatics. 2013;29(1):15–21.
[21] Shrestha AM, Frith MC. An approximate Bayesian approach for mapping paired-end DNA reads to a reference genome. Bioinformatics. 2013;29(8):965–972.
[22] Frith MC, Kawaguchi R. Split-alignment of genomes finds orthologies more accurately. Genome Biology. 2015;16:106.
[23] Bray NL, Pimentel H, Melsted P, Pachter L. Near-optimal probabilistic RNA-seq quantification. Nature Biotechnology. 2016;34:525–527.
[24] Kuo T, Frith MC, Sese J, Horton P. EAGLE: Explicit Alternative Genome Likelihood Evaluator. BMC Medical Genomics. 2018;11(Suppl 2):28.
[25] Shimizu KK, Fujii S, Marhold K, Watanabe K, Kudoh H. Arabidopsis kamchatica (Fisch. ex DC.) K. Shimizu & Kudoh and A. kamchatica subsp. kawasakiana (Makino) K. Shimizu & Kudoh, New Combinations. Acta Phytotaxonomica et Geobotanica. 2005;56(2):163–172.
[26] Shimizu-Inatsugi R, Lihov´a J, Iwanaga H, Kudoh H, Marhold K, Savolainen O, et al. The allopolyploid Arabidopsis kamchatica originated from multiple individuals of Arabidopsis lyrata and Arabidopsis halleri. Molecular Ecology. 2009;18(19):4024–4048.
[27] Tsuchimatsu T, Kaiser P, Yew CL, Bachelier JB, Shimizu KK. Recent loss of self-incompatibility by degradation of the male component in allotetraploid Arabidopsis kamchatica. PLoS Genetics. 2012;8(7):e1002838.
[28] Yew CL, Kakui H, Shimizu KK. Agrobacterium-mediated floral dip transformation of the model poly-ploid species Arabidopsis kamchatica. Journal of Plant Research. 2018;131(2):doi:10.1007/s10265–017– 0982–9.
[29] Briskine RV, Paape T, Shimizu-Inatsugi R, Nishiyama T, Akama S, Sese J, et al. Genome assembly and annotation of Arabidopsis halleri, a model for heavy metal hyperaccumulation and evolutionary ecology. Molecular Ecology Resources. 2017;17(5):1025–1036.
[30] Paape T, Hatakeyama M, Rie-Shimizu-Inatsugi, Cereghetti T, Onda Y, Kenta T, et al. Conserved but Attenuated Parental Gene Expression in Allopolyploids: Constitutive Zinc Hyperaccumulation in the Allotetraploid Arabidopsis kamchatica. Molecular Biology and Evolution. 2016;33(11):2781–2800.
[31] Mizuno N, Yamasaki M, Matsuoka Y, Kawahara T, Takumi S. Population structure of wild wheat D-genome progenitor Aegilops tauschii Coss.: implications for intraspecific lineage diversification and evolution of common wheat. Molecular Ecology. 2010;19(5):999–1013.
[32] Conesa A, Madrigal P, Tarazona S, Gomez-Cabrero D, Cervera A, McPherson A, et al. A survey of best practices for RNA-seq data analysis. Genome Biology. 2016;17:13.
[33] Liao Y, Smyth GK, Shi W. featureCounts: an efficient general purpose program for assigning sequence reads to genomic features. Bioinformatics. 2014;30(7):923–930.
[34] Love MI, Huber W, Anders S. Moderated estimation of fold change and dispersion for RNA-seq data with DESeq2. Genome Biology. 2014;15(12):550.
[35] Huang W, Li L, Myers JR, , Marth GT. ART: a next-generation sequencing read simulator. Bioinfor-matics. 2012;28(4):593–594.
[36] Triant DA, Pearson WR. Most partial domains in proteins are alignment and annotation artifacts. Genome Biology. 2015;16(99):doi:10.1186/s13059–015–0656–7.
[37] Promponas VJ, Iliopoulos I, Ouzounis CA. Annotation inconsistencies beyond sequence similarity-based function prediction - phylogeny and genome structure. Standards in Genomic Sciences. 2015;10(108):doi:10.1186/s40793–015–0101–2.
[38] Treangen TJ, Salzberg SL. Repetitive DNA and next-generation sequencing: computational challenges and solutions. Nature Reviews Genetics. 2011;13(1):36–46.
[39] Finotello F, Lavezzo E, Fontana P, Peruzzo D, Albiero A, Barzon L, et al. Comparative analysis of algo-rithms for whole-genome assembly of pyrosequencing data. Briefings in Bioinformatics. 2012;13(3):269– 280.
[40] Finotello F, Camillo BD. Measuring differential gene expression with RNA-seq: challenges and strategies for data analysis. Briefings in Functional Genomics. 2015;14(2):130–142.
[41] Everaert C, Luypaert M, Maag J, Cheng Q, Dinger M, Hellemans J, et al. Benchmarking of RNA-sequencing analysis workflows using whole-transcriptome RT-qPCR expression data. Scientific Reports. 2017;7(1):1559.
[42] Yoo MJ, Liu X, Pires JC, Soltis PS, Soltis DE. Nonadditive Gene Expression in Polyploids. Annual Reveiw of Genetics. 2014;48:485–517.