Immersive Visualization for Abnormal Detection in Heterogeneous Data for
On-site Decision Making
Elias Mahfoud University of North Carolina, Charlotte [email protected] Kodzo Wegba University of North Carolina, Charlotte [email protected] Yuemeng Li University of North Carolina, Charlotte [email protected] Honglei Han Communication Univ, China
UNC Charlotte∗ [email protected] Aidong Lu University of North Carolina, Charlotte [email protected]
Abstract
The latest advances in mixed reality promote new capabilities that allow head-mounted displays, such as Microsoft HoloLens, to visualize various data and information in a real physical environment. While such new features have great potential for new generations of visualization systems, they require fundamentally different visualization and interaction techniques that have not been well explored. This paper presents an immersive visualization approach for investigating abnormal events in heterogeneous, multi-source, and time-series sensor data collections in real-time on the site of the event. Our approach explores the essential components for an analyst to visualize complex data and explore hidden connections in mixed reality; it also combines automatic event detection algorithms to identify suspicious activities. We demonstrate our prototype system by using the developer version of Microsoft HoloLens and presenting case studies that require an analyst to investigate related data on site. We also discuss the limitations of the current infrastructure and potential applications for security visualization.
1.
Introduction
The recent advances on head-mounted displays (HMDs) for mixed reality (MR), such as Microsoft HoloLens and Meta 2, provide commercialized devices for data visualization and visual analytics applications. Different from virtual reality (VR), MR produces the hologram effects to mix physical and virtual objects, which allows users to visualize and interact with data and corresponding physical objects in the real environment. Also different from the traditional augmented reality (AR), the latest MR technologies are equipped with significantly more powerful computing and storage units for complex data visualization and analysis tasks.
∗This work was done during the visit at UNC Charlotte.
Figure 1. Microsoft HoloLens and an example demonstrating immersive visualization and analysis using a large physical environment without the needs
of a desktop computer.
For security visualization, MR creates several desirable features that are not available from desktop visualization systems. The key difference is that MR provides a computing infrastructure that allows analysts to perform both data analysis and physical operations without any context switch at the same physical location. This feature is useful for many security applications, ranging from visualization of critical infrastructures and emergency responses to monitoring routine operations for suspicious activities. As various virtual objects can be mixed in the same environment, MR can also be used for collaborative analysis that allows analysts at different locations to work in the same environment simultaneously. For example, a user at the site of a natural disaster can receive information from the headquarters and visualize them right on the corresponding physical locations.
However, there are still many open questions for MR visualization systems involving challenges related to multi-sensory interfaces, human perception and cognition, storage, and computation capabilities [1]. Especially at this early stage of MR visualization, we need to study how to visualize abstract information effectively in a real physical environment. We also need to explore multi-sensory input approaches, which includes using voices and gestures for interacting with the data. These challenges should be carefully studied to explore the new dimensions that are brought in by MR infrastructure to human analysts.
This paper presents our study for a security Proceedings of the 51st Hawaii International Conference on System Sciences|2018
application with heterogeneous datasets that involve multi-attributes and time-series data collected by various sensors. Our immersive visualization approach provides visual correlations between spatially organized 3D floor plans and line charts of temporal features. Specifically, we allow analysts to visualize both 2D information and 3D patterns by placing them on a table or walking around the floor plans as if they were at the site. We also combine event detection algorithms for exploring abnormal events from multiple attributes in the operational data.
Our prototype system is equipped with the key components involved in creating an immersive visualization system for complex data, including building 2D and 3D visualizations with Unity and developing voice, gaze, and gesture-based user interaction functions. The results and discussions demonstrate the immersive visualization for heterogeneous data analysis tasks in MR. We also summarize our findings throughout the project as the limitations of the current infrastructure and potential security applications for further research.
2.
Related Work
We summarize the related work from the two aspects of immersive analytics and event detection approaches, as they are the two important components of this work.
2.1.
Immersive Visualization and Analytics
While the latest technology significantly advances the performances and features of HMDs, the concepts of augmented and virtual realities have been existed for decades; among which a number of work is devoted for security applications. Generally, VR is used for training purposes and it allows users to experiment in real time under various situations such as evacuation scenarios [2] while MR and AR are more suitable for real action with the integration of virtual information in real physical environments. For example, AR technology was used as a tool to support the collaboration between rescue services for the police and military personnel in a crisis management scenario [3]. For operational units in the security domain that work together in teams, AR techniques were used to support quick context-related information exchange [4]. AR-based mobile assistance systems in context-based provision of facility-related information [5] were shown to minimize the intensive recall required in this domain.Specifically related to immersive analytics, a number of recent studies have been performed and they provide favorable results for stereoscopic techniques. Ware and Mitchell [6] studied the perception of variations
of 3D node-link diagrams and showed that stereoscopy reduces errors and response time in a very high resolution stereoscopic display for both skilled and unskilled observers. Studies of performances on collaborative immersive visualization using the recent HMDs, such as Oculus Rift and HTC Vive, have shown no difference with expensive equipment such as cave-style environments [7]. Kwon et al. [8] investigated the effectiveness of graph visualization and the impact of different layout techniques on readability in an HMD, and they concluded that the 3D stereoscopic graph visualization with an Oculus Rift out-performed traditional 2D graph visualizations.
This approach facilitated the effectiveness of alerts in complex systems - a key feature in security monitoring systems. We expect that this will become an important application of immersive visualization systems in the near future [9, 10].
2.2.
Events Detection in Time Series Data
There has been a significant amount of prior works in data mining, statistics, information theoretic and machine learning on finding abnormal patterns or anomalies. Anomalies are patterns in data that do not conform to a well defined notion of normal behavior and can be point anomalies, contextual anomalies or collective anomalies [11]. Generally, anomaly detection techniques are domain specific. In the security context, these abnormal patterns can be related to intruders, malicious attacks, or compromised security rules. The output of the anomaly detection is usually in form of suspicious levels or scores [11]. For example, Papadopoulos et al. [12] used the data features to quantifying the anomaly level of each path change event in their border gateway protocol anomalies detection and visualization prototype.
One important trend in anomaly detection is for periodic time series data. For example, statistical approaches have been used to search periodic patterns and compute the deviation [13]. Some researchers used visual analytic approach to visually identity such deviation by comparing visual correlation and similarity between the time series data [14, 15, 16]. Other researchers used collaborative and user defined events approach to highlight suspicious events from the experts instead of automatic detection algorithms [17]. Also, feature vector technique has been used in behavioral observation to detect cyber-threat in critical infrastructure [18]. It has also been used to detect large scale unusual behavior in time series data [19].
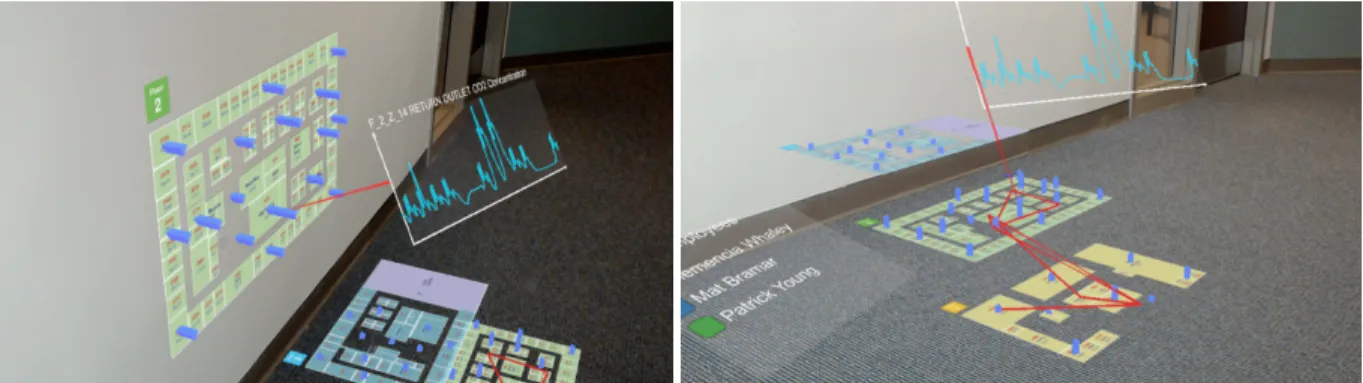
Figure 2. Examples of immersive visualization using HoloLens for studying heterogeneous information collected from various sensors. The prototype system demonstrates features of combined voice, gaze, and gesture interaction for on-site investigation, which are especially useful for security applications such as emergency
responses and situations that require overlaying information with the real environment.
Figure 3. Flexible organizations of 3D floor plans and movement patterns of employees. They can be flexible placed on available spaces on site, such as a table or on a wall, as stacked images or staircases (generally with
less occlusion) for studying various 3D visual correlations.
3.
On-Site Immersive Visualization
3.1.
Application Requirements
To justify our design of the MR visualization system, we first summarize the requirements of the application, which are provided by the VAST Challenge 2016. A company named GAStech has a state-of-the-art, three-story building which is fully instrumented with sensors that identify everything from building temperatures to concentration levels of various chemicals. The movements of staff members are also tracked by requiring them to wear proximity cards while in the building. The goal of this application is to help users understand the steady stream of operations data, including data from stationary and mobile sensors of multiple types.
Specifically, the dataset can be divided to three groups.
• Building attributes collected over two weeks • Floor plans for the three-story building
• Employees’ movement records during the two weeks
Our design of immersive visualization in this section and event detection algorithms in Section 4 are both based on the data features and application requirements.
3.2.
Design of Immersive Visualization
Our main design principle is to identify important data relationships in the application and organize visualization in MR accordingly. This design corresponds to a key difference of MR and desktop visualization system – spatial mapping that mixes virtual information with the physical environment. Based on the available data groups and application requirements, we separate the data features to two main types (3D/2D). To provide the experience of mixed reality, we visualize the building as a stack of floor plans. The stack can hover on top of a table or a flat surface like the floor, utilizing the large empty space in the physical environment. We provide a flexible organization of the spatial mapping – the three floors can be mapped to the same location as a stack or adjacent images for observing local details. The relative locations on the stack of floor plans can also be adjusted for a stairway effect without object overlapping, so users can easily observe all the 3D information. As shown
in Figure 3, users can interactively switch between these organizations to study the patterns of different employees or locations.
Centered by the 3D floor plans, we introduce additional information that can be connected to the floor plans.
• The floor plan also provides a 3D bar chart for visualizing location-related information, such as multiple chemical concentrations for different floor zones or the movement patterns from different employees. For example, Figure 2 demonstrates the bar charts on both 2D wall mapping and 3D floating setting.
• For each employee in the dataset, a path is drawn with a distinct color which shows their movements across the building. Figures 2 and 3 provide examples of the movement paths from different employees.
• The line charts can be mapped on any large surfaces such as a table or a wall. They can also float in the 3D space, as shown in Figure 2. We generally prefer to have the line chart located close to the corresponding floor zone, so that an analyst can visualize both temporal patterns and 3D locations simultaneously.
3.3.
User Interactions in MR
We have explored the following interactive functions for immersive analytics. As the examples demonstrated in Figures 2, 3, and 4, these interaction functions are different from mouse and keyboard and rely on natural user interactions.
3.3.1. Voice-based Interaction Voice is one of the key forms of input on HoloLens. We use voice commands to direct the immersive system to switch between different visualization functions. For example, voice command “select” is combined with gaze information for selecting zones. Voice command “line” brings the line chart of the selected building attribute on the selected zone.
3.3.2. Gaze-based Interaction The gaze-based interaction is the primary mechanism of user interaction in MR. The gaze locations for simple surfaces are automatically tracked in HoloLens. To make a selection, the user can look around and stare at the desired object, such as a zone on the floor plan. Depending on the
command mode of the system, different visualization modules are called correspondingly.
3.3.3. Gesture-based Interaction The current version of HoloLens supports two gestures, air tap and bloom. We use the air tap gesture to identify a location where the user wants to move a visualization component, such as the stack of floor plan or a line chart. It is also used to specify a location to copy the floor plan.
3.3.4. Menu It is still challenging to develop a practical menu for MR. As shown in Figure 2, we use a check list for the user to pick employees for visualizing his or her movement patterns.
3.3.5. Free movement MR provides an immersive experience which allows an analyst to walk around the rooms in a building to observe patterns from different locations and angles, as shown in Figure 4. This interaction is crucial for a user to match the floor plan with the real physical environment and reason the movement paths.
3.3.6. Combined User Interaction The user interaction in real action often combines more than one interaction method above. For example, the interaction practice of copying a floor plan from the 3D stack to the wall is achieved as so: the user first gazes at the floor plan, use the voice command “select” to confirm selection, moves his or her hand around to find a desired location, and then use the gesture “air tap” to make the copy. It takes time for a user to get used to such interactions, but voice, gaze, and gesture-based interactions are often quick to learn.
3.4.
The Prototype System
The system is built using the Unity 3D engine. Unity greatly simplifies the development of three-dimensional applications by offering a powerful API, smooth performance, and a solid integration with HoloLens. When the application starts, it asks the user to scan the surrounding area for about 10 seconds. This allows the system to process the environment and generate meaningful placement surfaces for widgets. Once scanning is complete, the stack of floor plans is placed on a horizontal surface, such as a table or the floor, in front of the user. The Unity Holotoolkit and HoloLens tutorials offer several ways to help aid the process: a
(a) (b) (c)
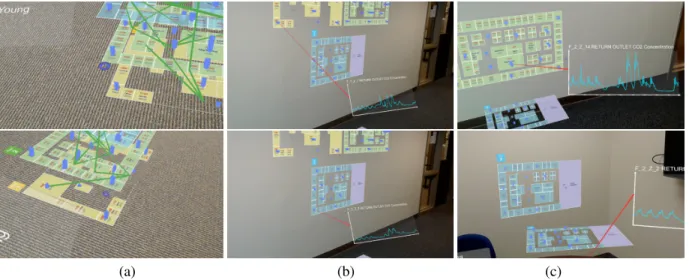
Figure 4. Examples of user interaction in mixed reality: (a) walk around for studying 3D relationships, (b) gaze-based selection, and (c) copying floor plans on the wall for detailed observation.
spatial mapping class to generate room geometry, a spatial processing class to detect surfaces, a placement script to interactively move objects, and a cursor to help the user know what their gaze direction is.
Our system is comprised of several Unity C# classes:
• CoordinateConverter gives widgets the ability to convert between arbitrary data and their local coordinate system. The CoordinateConverter is used to map floor plan locations to 3D points when drawing the bar chart and employee paths. It is also used for drawing line charts on two dimensional widgets.
• DataLoader loads and parses the data file, and exposes events to notify listeners when data processing is completed.
• BarChart and LineChart depend on CoordinateConverter and use converted data points to draw vertical bars or lines.
• EmployeeManager and EmployeePath: The manager creates a list of check boxes with different colors, and configures them to create EmployeePaths when checked. EmployeePath depends on CoordinateConverter and uses converted data locations to 3D line points drawn between floors
With our prototype system, we can explore the datasets and continue to discover interesting events in the operation data.
4.
Event Detection for Operating
Sequences
We have also designed two automatic detection algorithms to assist analysts with identifying abnormal patterns in the operational sequences. We target finding clues of suspicious patterns from the building data and abnormal behaviors of employees, so that analysts can proceed with interactive analysis for a prompt investigation.
4.1.
Building - Finding abnormal patterns
amongst the building attributes
As there are hundreds of building attributes, our first algorithm is designed to identify the attributes with abnormal patterns so that analysts can be aware of the whole building status. The building attributes are automatically collected with various sensors, such as room temperature, energy consumption, and a variety of chemical densities, in the constant sampling rate - one value per five minutes. The patterns often vary between day and night. Energy consumption, for example, is high during the day and low at night. The patterns are also different for weekdays and weekends; there is lower energy consumption during the weekends as most employees are not at work.
We design an algorithm to identify abnormal patterns through taking the two periodic features of building attributes into consideration. For each attribute, we separate weekdays and weekends into two groups and generate their signature daily patterns respectively. This is achieved through averaging the samples from the same time of a day. As shown in Figure 5,
dry-bulb temperature
total energy demand power
Figure 5. Signature daily patterns for detecting abnormal durations. The images on the left show the
time series of two attributes during a week, and the images on the right shows their signature daily patterns (red line for weekends and orange for
weekdays).
the signature daily patterns are very similar to the patterns of individual days when the attribute is normal throughout the time duration; while at least portions of the signature daily patterns are different from the patterns of individual days when there is an abnormal event.
To identify the abnormal duration, we compare the signature daily patterns with the samples from each day. The durations with large value differences are marked as “abnormal” with the absolute differences as the “abnormal degree”. We then summarize all the abnormal degrees for each day and each attribute. If an analyst checks other attributes with high abnormal degrees, he or she may find out the same abnormal duration quickly, and therefore start to dig into more information related to these energy zones.
4.2.
Employee - Finding suspicious movement
patterns amongst a group of employees
The challenges of finding suspicious movement patterns of employees mainly come from the following aspects: First, it is normal that different employees have different movement patterns, such as an how an administrator stays in offices and an engineer visits facility rooms. Second, the movement patterns of employees are consisted of many random factors, such as visiting restrooms at different times and locations. Therefore, it is not effective to generate a signature daily pattern in a similar approach as we did for the building attributes in our previous algorithm. Our solution is to treat different employee groups separately, assuming that employees from the same group follow similar movement patterns.To find suspicious behaviors amongst a group of employees, we use high-dimensional feature vectors to
quantify the movement patterns. The concept of feature vectors allows us to combine various factors in the same framework, compare different employees, and identify specific suspicious behaviors. Based on the example movement patterns, we have included factors of each work day’s start and end time, zones visited, time spent at each zone, the variance of time spent at each zone, and the number of visits to each zone. Figure 6 shows how all the factors are concatenated as a high-dimensional feature vector Vi for each employeei. Similar to the
building attributes, we also separate time to weekdays and weekends as majority movements appear during the weekdays.
We calculate a suspicious levelsifor each employee
iin the group. This is achieved by generating the feature vectorGfor the group by averaging the features vectors of employees.
Gj =
Pk
i=1Vij
k (1)
wherekis the number of employees in the group. Then, we compute the absolute value of the variation between an employee feature vector on one day and the group average feature vector.
si=
|Vi| X
l=1
|Vil−Gl| (2)
Note that if f is the number of features in employee feature vector andnis the number of different zones the group members visited, then all members feature vectors have the same size off xn.
Figure 6. Building features vectors of movement patterns.
Figures 7 demonstrates our approach on the group of employees from the executive department. All the employees have their offices on the third floor and therefore are using the same path to get to their office. They also have the same work schedule. The algorithm has detected that the employee with the sensor card “jsanjorge001”, Sten Sanjorge Jr, has the highest suspicious level from the group. His daily suspicious level shows the most suspicious behavior from the group appeared on June 2, as shown on top right image in
Figures 7. A further investigation reveals that he is usually detected by the fixed sensors around 7 AM every weekday. However, on June 2, he arrived at midnight and spent about fourteen hours on the first floor in zone 1, shown on the bottom image in Figures 7. This deviant behavior results in a very high suspicious level for that day and increases the total suspicious level for this employee.
suspicious degrees daily degrees of jsanjorge001
movement patterns of jsanjorge001
Figure 7. Finding suspicious activities from a group of executive employees. Employee with sensor card
jsanjorge001 has the highest suspicious degrees.
5.
Results and Case Studies
With our prototype system, we have explored causal relationships between building attributes and employee movement patterns. This section presents three case studies and quantitative results to provide an overview of our approach.
5.1.
Finding abnormal patterns of building
attributes
As the building attributes are collected by sensors automatically throughout the week, most patterns of building attributes demonstrate periodic patterns between day and night. We start with the abnormal detection algorithm for building attributes and visualize the abnormal values as bar charts on the floor plans. An analyst can use the visualization and interaction functions shown in Figures 3 and 4 to place the floor plans on a large empty space in the room and copy a level on the wall for observation. As shown in Figure 8, the analyst has selected to look at the attribute with the top abnormal degree - CO2 concentration, which was abnormally high between June 5th and June 9th in some proximity zones on the first floor. Meanwhile, the same event has been observed on the second and third floors from June 7th to June 9th. The immersive visualization system provides a strong visual correlation of the abnormal events to the 3D locations in the building, especially when enlarging the floor plans and walking around them.
Figure 8. Abnormal CO2 concentrations on different zones.
5.2.
Detecting suspicious behaviors of
employees
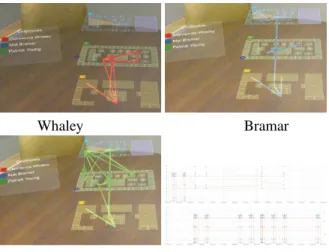
With the 3D movement patterns in MR, we can clearly differentiate the patterns from different employees. Figure 9 shows the movement patterns from three employees. Among which, Whaley mainly moves between the first and the second floors, Bramar and Young move among all the three floors, and Young focuses on the second and third floors. Whaley’s patterns are consistent over the two week duration while Bramar and Young have been identified with high suspicious levels.
Specifically, Bramar’s schedule was irregular as an administrator. On June 9th, he was only detected in the building from 7:15AM at the main entry and left at 8:02AM. He was then detected on Saturday June 11th from 8:30AM to 11:31AM although he never worked on Saturdays. Also, Bramar showed up at zone 5 on first floor and zones 1 and 7 on the second floor, while the majority of administrators work on the third floor.
Young’s behavior is flagged as he used two cards at the same time on different days. As shown in Figure 9, his visits were mainly located on the second and third floors. It is interesting to see that he visited the top row (39), which corresponds to the server room on the third floor, only with the first card. It is possible that he switched cards for different access permissions.
5.3.
Exploring event correlations
By searching for abnormal events amongst the building attributes, we can find that several attributes, such as HVAC electric demand power, supply inlet temperature, thermostat cooling/heating set points, and CO2 concentration, appeared abnormal during the same period of June 7th and 8th. As shown in Figure 10, different from CO2 concentration, the attributes of HVAC electric demand power and supply
Whaley Bramar
Young uses two proximity cards with overlapped activities
Figure 9. Example employees with suspicious movement patterns.
inlet temperature were dramatically increased, while thermostat cooling/heating set points showed a larger variance than usual. Related to the electrical zones on the floor plans, we can gaze over several zones and find that these changes were more obvious in zones of rooms than regions of corridors. We suspect that some changes to the heating/cooling system might have affected the building settings, including power demands, and continuously caused a series of abnormal events collected by the sensors.
In addition, we can correlate the movement patterns of employees with these events. Through searching for suspicious activities of employees among the same group during this abnormal duration, we identify several employees with different movement patterns. For example, clais001 in the administration department visited the server room on the third floor once on July 7th (right after the abnormal events started) and July 9th (after the events ended). lbennett001 from the facility department and csolos001 from the IT department visited the same server room around the same time as clais001. Therefore, the suspicious activities of these employees are likely the responses to the abnormal events.
5.4.
Quantitative Results
Our system has an interactive performance for all the major immersive visualizations, interactions, and event detection components. The size of all data files except the floor plans is around 18 MB, including hundreds of building attributes and employees. We specifically measured the response times for each of our application features. The table 1 shows the average response time
Figure 10. Interactive exploration of building attributes and movement patterns from employees for
investigating event correlations. The four examples demonstrate that a user can select and visualizes four
attributes respectively: F2 Z15 Supply Inlet Temperature, F2 Z14 Return Outlet CO2, F1 Z5 Supply Inlet Temperature, HVAC Electric Demand
Power.
Table 1. Performance of our MR visualization system.
Operations miliseconds
Data Processing 7202
Rearrange Floors 3
Draw Bars 391
Draw Employee Path 22
Update Line Chart 16
Copy Floor 7
for each action. As expected, the slowest methods to execute are the ones responsible for loading and processing data, as well as the ones responsible for generating new geometry (Draw Bars).
It is worth noting that the Unity platform uses Just-In-Time (JIT) compilation on platforms other than iOS. When a method is first called, it will first be dynamically compiled and then called. As a result, the measured time for methods called for the first time is significantly longer than subsequent calls. For example, when running the methods RearrangeFloors, DrawEmployeePath, UpdateLineChart, and CopyFloor for the first time, the response time is around 20 ms. Meanwhile, the time for subsequent calls drops to 0 or 1 millisecond for these methods.
6.
Discussions and Current Limitations
In this section, we summarize our experiences of exploring the immersive visualization from the aspects of potential security applications and current limitations.6.1.
Potential Applications of MR Security
Visualization
The differences between MR and desktop visualization systems are clear – desktop computers project visualization results on a 2D monitor or projection screen while MR allows users to utilize a 3D space to visualize data at any location. The differences between MR/AR and VR are also obvious – each with its own unique strength. VR, providing a complete immersive environment by separating users from the real physical environments, is very suitable for training tasks. MR and AR, providing an integrated environment by mixing virtual objects or information with a real and physical environment, is more suitable for actions on site.
From this project, we have experienced the effectiveness of spatial correlation in the mixed reality. Our impression is that MR can improve the spatial cognition of users for a more effective analysis and connection with data. We expect that 3D visualization will have more advantages in MR than with traditional desktop systems with the feature of strong spatial correlations.
Collaborative visualization and analysis can become a key function for security applications, which are often involved of joint work from multiple analysts. The immersive visualization will allow users from different locations to work in the same environment by mixing information from each analyst. The visualization systems will also have the options of improving the communication of collaborations and tuning the information for each analyst. We expect that collaborative visualization will be essential to applications of emergency responses and remote collaboration.
6.2.
Current Limitations
Although there are many promising features and potential applications, the current options for developing immersive visualizations are still limited. We describe four main limitations we have encountered during this project, which are expected to be gradually improved in the future.
First, the HoloLens is provided with the HoloLens Technical Preview which is a custom version of Unity for development. Our project uses the HoloLens Technical Preview which is based off the Unity 5.4 Beta version. The development of MR has to be restricted by the available functions provided in this version. For example, the Unity Standard Assets are not included, and until the latest version there is no reliable Hololens-compatible input module for the UI
event system.
Second, the data processing capabilities of HMDs are still limited. The performance of HoloLens is comparable to tablet devices, but far less than powerful desktop computers. Specifically, the configuration includes Intel Atom x5-Z8100 1.04 GHz for CPU, a custom-built Microsoft Holographic Processing Unit (HPU 1.0) for the CPU/HPU processor, 2GB RAM, and 64GB Flash storage. The design of immersive visualization needs to be tailored to a mobile platform in order to maintain interactive performance. Only simple geometries and a small amount of information can be simultaneously rendered, and only a limited amount of data can be loaded and processed without slowing down the system.
Third, the lack of interaction channels is also a main limitation of current HMDs. While voices and gestures are natural to a user, the voice and gesture-based interaction techniques are still ongoing research topics. As all our users have accustomed to the use of a mouse and keyboard, voice and gesture-based approaches need to be simple and intuitive for easy adoption. Also, the HMDs may need to be combined with additional devices that can acquire inputs, such as finger movements, in real-time. In this project, we are limited to voice, gaze, the two main gestures (air tap and bloom), and a clicker to design our interaction methods.
Fourth, the current display technology that the HoloLens uses cannot render black or very dark colors, as they appear transparent on HoloLens. This forces the user interface and various widgets to use bright colors. For example, we had to process the floor plan images to use white lines and text instead of black or else they would not have proper outlines when displayed with the HoloLens.
7.
Conclusion and Future Work
This paper presents an immersive visualization system using the Microsoft HoloLens for investigating heterogeneous operational data collected by multiple sensors. We have developed a flexible MR system to visualize both 2D information and 3D patterns in a physical environment and to interact with voice, gaze, and gesture-based techniques. We have also presented event detection algorithms and combined them with the immersive visualization system for efficiency. According to our knowledge, this work is the first to explore the potential of using the latest advanced technology of holographs for security visualization. Our prototype system demonstrates the immersive analytics features of mixed-reality, which frees analysts from traditional computing settings and
allow them to monitor and analyze time-series data anywhere on site.
As immersive visualization is still new for security applications, there are many open problems and exciting potentials to explore. We plan to explore the following directions in the future: First, we have tested Unity in this project, and we plan to continue with additional Unity development as well as explore other rendering platforms such as DirectX. Second, we are interested in extending the interaction functions in this work and designing suitable gesture-based interaction techniques that are intuitive for data visualization and visual analytics tasks. Third, collaborative analysis will become a powerful tool for two or more analysts to jointly study a dataset, regardless of whether they are at the same physical locations or not. We plan to extend our prototype system and allow multiple analysts to work simultaneously. At the end, fundamental problems that are related to visual perception and cognition are crucial to the success of mixed-reality systems and need to be carefully studied. We expect that mixed reality approaches will be widely used in security visualization applications.
8.
Acknowledgements
This material is based upon work supported by UNC Charlotte and the National Science Foundation under Grant No. 1629913.
References
[1] T. Chandler, M. Cordeil, T. Czauderna, T. Dwyer, J. Glowacki, C. Goncu, M. Klapperstueck, K. Klein, K. Marriott, F. Schreiber, and E. Wilson, “Immersive analytics,” inBig Data Visual Analytics (BDVA), 2015, pp. 1–8, 2015.
[2] D. Sims, “See how they run: modeling evacuations in vr,”IEEE Computer Graphics and Applications, vol. 15, pp. 11–13, Mar 1995.
[3] S. Nilsson, B. Johansson, and A. Jonsson, “Using ar to support cross-organisational collaboration in dynamic tasks,” inMixed and Augmented Reality, 2009. ISMAR 2009. 8th IEEE International Symposium on, pp. 3–12, Oct 2009.
[4] D. Datcu, M. Cidota, H. Lukosch, and S. Lukosch, “On the usability of augmented reality for information exchange in teams from the security domain,” in
Intelligence and Security Informatics Conference
(JISIC), 2014 IEEE Joint, pp. 160–167, Sept 2014. [5] S. Lukosch, H. Lukosch, D. Datcu, and M. Cidota, “On
the spot information in augmented reality for teams in the security domain,” inProceedings of the 33rd Annual ACM Conference Extended Abstracts on Human Factors in Computing Systems, pp. 983–988, ACM, 2015. [6] C. Ware and P. Mitchell, “Visualizing graphs in
three dimensions,” ACM Trans. Appl. Percept., vol. 5, pp. 2:1–2:15, Jan. 2008.
[7] M. Cordeil, T. Dwyer, K. Klein, B. Laha, K. Marriot, and B. H. Thomas, “Immersive collaborative analysis of network connectivity: Cave-style or head-mounted display?,” IEEE Transactions on Visualization and Computer Graphics, vol. PP, no. 99, pp. 1–1, 2016. [8] O. H. Kwon, C. Muelder, K. Lee, and K. L. Ma, “A
study of layout, rendering, and interaction methods for immersive graph visualization,” IEEE Transactions on Visualization and Computer Graphics, vol. 22, no. 7, pp. 1802–1815, 2016.
[9] M. Billinghurst, A. Clark, and G. Lee, “A survey of augmented reality,” Foundations and Trends
in Human-Computer Interaction, vol. 8, no. 2-3,
pp. 73–272, 2015.
[10] J. C. Roberts, P. D. Ritsos, S. K. Badam, D. Brodbeck, J. Kennedy, and N. Elmqvist, “Visualization beyond the desktop–the next big thing,”IEEE Computer Graphics and Applications, vol. 34, no. 6, pp. 26–34, 2014. [11] V. Chandola, A. Banerjee, and V. Kumar, “Anomaly
detection: A survey,”ACM computing surveys (CSUR), vol. 41, no. 3, p. 15, 2009.
[12] S. Papadopoulos, G. Theodoridis, and D. Tzovaras, “Bgpfuse: using visual feature fusion for the detection and attribution of bgp anomalies,” in Proceedings of the Tenth Workshop on Visualization for Cyber Security, pp. 57–64, ACM, 2013.
[13] F. Angiulli and F. Fassetti, “Toward generalizing the unification with statistical outliers: The gradient outlier factor measure,” ACM Transactions on Knowledge Discovery from Data (TKDD), vol. 10, no. 3, p. 27, 2016. [14] F. Fischer, J. Fuchs, P.-A. Vervier, F. Mansmann, and O. Thonnard, “Vistracer: a visual analytics tool to investigate routing anomalies in traceroutes,” in Proceedings of the ninth international symposium on visualization for cyber security, pp. 80–87, ACM, 2012. [15] F. Stoffel, F. Fischer, and D. A. Keim, “Finding
anomalies in time-series using visual correlation for interactive root cause analysis,” in Proceedings of the Tenth Workshop on Visualization for Cyber Security, pp. 65–72, ACM, 2013.
[16] E. Karapistoli, P. Sarigiannidis, and A. A. Economides, “Srnet: a real-time, cross-based anomaly detection and visualization system for wireless sensor networks,” in Proceedings of the Tenth Workshop on Visualization for Cyber Security, pp. 49–56, ACM, 2013.
[17] S. Chen, C. Guo, X. Yuan, F. Merkle, H. Schaefer, and T. Ertl, “Oceans: Online collaborative explorative analysis on network security,” in Proceedings of the Eleventh Workshop on Visualization for Cyber Security, pp. 1–8, ACM, 2014.
[18] W. Hurst, M. Merabti, and P. Fergus, “Big data analysis techniques for cyber-threat detection in critical infrastructures,” in Advanced Information Networking and Applications Workshops (WAINA), 2014 28th International Conference on, pp. 916–921, IEEE, 2014. [19] N. Laptev, R. Hyndman, and E. Wang, “Large-scale
unusual time series detection,” inProceedings of IEEE International Conference on Data Mining, 2015.