ISSN: 2278-8115 46
DEN: an R-Bioconductor based package to extract active
sub-networks from human interaction map by integrating
gene-expression data
Sanket Desai1
1 School of Biotechnology, IGNOU – International Institute of Information Technology, Center of Excellence for Advanced Research and Education, Pune, India
Article Info ABSTRACT
Article history:
Received May 6th, 2015 Revised May 26th, 2015 Accepted May 26th, 2015
Living cells are complex, dynamic, self-regulatory, interactive systems, showing differential states across time and space. Complexity of cellular systems is highlighted with the multi-layered regulatory mechanisms involving the interactions between bio-molecules (such as DNA, RNA, mi-RNA and proteins). These interactions are analyzed in the form of static networks. Likewise, number of experimental techniques like microarray, RNASeq allow quantification of cellular dynamics and aid in discerning differential gene expression across diverse conditions. Computational biology is in need of methods for integration of static networks and gene expression data, since it provides interesting insights into the dynamics of biological systems. DEN is an R/Bioconductor based package designed to assemble different types of human bio-molecular interactions as a complete interactome and contains functions to extract dynamic active networks by integration of gene expression data. Keyword: Active sub-network Gene expression Differential networks R/Bioconductor
Copyright © 2015 International Journal for Computational Biology,
http:// www.ijcb.in, All rights reserved.
Corresponding Author: Sanket Desai,
School of Biotechnology, IGNOU – International Institute of Information Technology, Center of Excellence for, Advanced Research and Education, P-14, Rajiv Gandhi Infotech Park, Phase-1, Hinjewadi, Pune, India
Email: [email protected]
How to Cite:
Sanket Desai. DEN: an R-Bioconductor based package to extract active sub-networks from human interaction map by integrating gene expression data. IJCB. 2015; Volume 4 (Issue 2): Page 46-52.
1.
INTRODUCTION
The main Biological systems are composed of multiple layers of self-regulatory, dynamic interaction networks. These networks can be decomposed into three major types of interactions; protein-protein interactions (PPI), transcription factor - target gene (TF-TG) interactions (also known as gene regulatory networks) and miRNA-gene (miRNA-mR) interactions [1,2]. PPIs account for the signaling and metabolic complexes formed between various proteins. The transcription factors regulate transcription rates of other proteins by binding to promoter sequences alone or in combination with other proteins [3]. Third kind of regulatory mechanism functioning in the cell is the interference of mi-RNAs in post-transcriptional gene-expression. miRNAs are
47 ISSN: 2278-8115
coordinated act between the three major biological interactors (DNA, RNA, Proteins) and the environment (non-biologicals).
Static binary interactions between bio-molecules have been broadly investigated using basic network analysis frameworks (since biological networks seem to behave in a similar manner to other scale free networks like social networks) [7]. Such studies focus on network topology, robustness, module/ motif identification and other graph properties (like shortest paths, hubs, betweenness centrality and so on) [8]. Although these examinations have revealed interesting facts, they have a major limitation with respect to living systems. As we know, biological systems are quite dynamic in nature (so much so that they are assumed to be random) and they differ in activity across various tissues/ cell-types and at different time points. These temporo-spatially changing impressions are out of scope for classical network biology. On the other hand high-throughput experimental techniques, including microarrays, RNA-Seq, reveal the system level alterations taking place in the cells at different time points. Analyzing data from these techniques results in identification of genes involved in distinct bio-processes (across diverse cells) [9]. List of differentially expressed genes (DEG) derived from these analyses can be further subject to gene annotation, pathway analysis, functional enrichment and so on.
Integration of gene expression data with networks makes identification of functional modules possible [10,11]. Several studies have employed such data integration to identify active networks specific to tissues, biological processes [12] and diseases [13,14], particularly cancer [15,16]. A range of computational methods have been developed to analyze the transcriptome/ metabolome network dynamics by integrating static interaction measurements with dynamic changes in gene expression or metabolic fluxes [16,17,18]. Drug target identification, gene prioritization in disease conditions are few of the prominent applications of these methods. Although these approaches are not intended to identify new interactions, complexes or pathways, they seek changes in network wiring that are active under specific experimental conditions or anomalies. Many R [19] / Bioconductor (BioC) [20] packages have also been developed which aid in differential gene expression [21,22] and sub-network analysis [23,24] independently. The available sub-network extraction packages use either co-regulated genes for network construction [25] or depend upon static PPI data [26,27].
Differential active sub-network (DEN) is an R/BioC based package designed to give access to the three major types of interaction networks (PPIs, TF-TG and mi-mR) in the form of static graph objects (representing human interactome) and functions to extract dynamic active networks by integrating either gene expression data or list of active genes. Finally, application of DEN package has been exemplified using a case study.
2.
RESEARCH METHOD
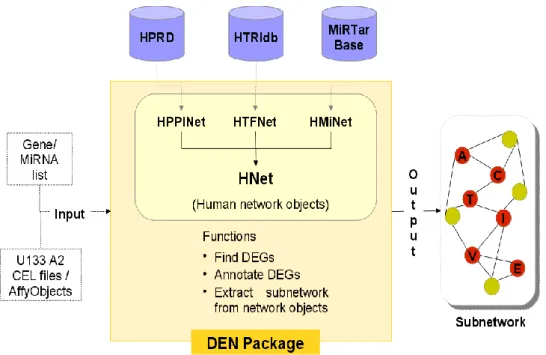
DEN package was implemented in R programming environment and released under Artistic License 2.0. The datasets to create human interaction map consisting of PPI, TF-TG and mi-mR were obtained from respective databases: HPRD – release 9 [28], HTRIdb [29] and miRTarBase – release 4.5 [30]. Data from these three sources were checked for inconsistencies and non-human/ redundant interaction entries were removed from the dataset to get unique set of interactions. The datasets were then converted to UCINET DL graph file format [31]. For basic graph manipulation and analysis R-igraph library [32] was used. The DL graph files for various network types were then imported into R to conceive igraph network objects (discussed in Results and Analysis section) which form the core of DEN. These objects are used for sub-network extraction using the package functions (refer Supplementary file; CoreFunctions). DEN package depends on affy [33] for processing Affymetrix Gene Chip data and limma [21] to find DEGs from given affyBatch object. The package also depends on Bioconductor annotation data hgu133a2.db [34] for probe annotation. The overview of DEN package is as shown in Figure 1.
Figure 1. Overview of DEN package
3.
RESULTS AND ANALYSIS
Integration of data from the three data sources (mentioned in 2) resulted in following igraph-objects; HPPINet, HTFNet and HMiNet, representing PPI, TF-TG interaction and mi-mR networks respectively. HPPINet is an undirected graph containing proteins as nodes and interactions as edges. HTFNet is a directed graph with edges having transcription factor node at one and target gene at other end. HMiNet is again a directed network with edges between miRNA influencing target mRNAs (genes). The mRNA/ protein/ transcription factor node names in all the above networks are official gene symbols. In the networks containing miRNAs, the node names are as per miRTarBase database [30] naming convention; for example database name of miRNA, hsa-miR-20a-5p has been assigned a node name miR-20a-5p in the graph. Since all the interactions under consideration are human, the prefix “hsa” has been removed from all the miRNA names. HNet is a complete human interaction map composed of all the three network objects (HPPINet, HTFNet, HMiNet). The three network objects can be separately loaded for analysis or as a combined network. HNet is an undirected igraph object.
3.1. Global topology of human interaction network
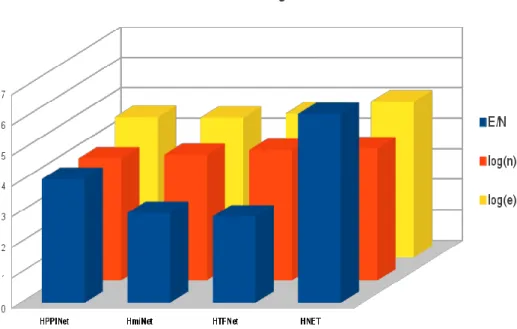
Global topology parameters of the assembled networks are as given in Table 1. The Node-Edge chart (Figure 2) gives a comparative account of the nodes (vertices) and edges in the respective networks. Among the three networks under DEN (HMiNet, HTFNet, HPPINet), HTFNet has the highest number of nodes, whereas HPPINet has the highest “edge per node” ratio (E/N). Hence HPPINet is relatively dense network as compared to other two networks. E/N is almost doubling in the HNet interactome, indicating a highly interconnected network. From the average clustering coefficient (except in case of HMiNet; since it is a sparse network) and mean degree it is evident that all the networks contain highly organized node clusters, which is a common observation in most of the biological systems. Among all HTFNet has the highest clustering, indicative of the extremely organized nature when compared to others. These values are also consistent with fact that biological systems are characterized as “small world” networks.
Table 1: Global topology parameters of the network objects in DEN
Network Type Nodes Edges Mean degree Average clustering coefficient
49 ISSN: 2278-8115
Figure 2: Node-Edge plot for basic network data objects in DEN. Number of nodes and edges in the networks are scaled by taking logarithm to the base 10 (for convenience in representation); labeled as log (n) and log (e) respectively. E/N is the ratio of number of edges by number of nodes in a given network; which represents the
density of associations in the network. 3.2. Case study: Endoderm differentiation from human stem cells
Application of DEN using real expression dataset has been demonstrated in this case study. The active network extracted from the human interactome is further analyzed using igraph library functions. The purpose of the original study by Loh KM et al. [35] is induction of endoderm differentiation from human induced pluripotent stem cells (hiPSC) and understanding the influence of signaling factors in lineage differentiation. In that study, HES3 hiPSC were subject to differentiation protocol to derive definitive endoderm (DE) cells and microarray analyses were conducted of six different populations including hiPSC (at day zero) and DE (at day three). This expression data series; GSE52158 (Affymetrix Human Genome U133 Plus 2.0 Array platform), is downloaded from NCBI-Gene Expression Omnibus [36] and reanalyzed using DEN. After performing quality control procedures (as described in [37]) following data replicates were selected for analysis; GSM1260408, GSM1260409, GSM1260410 (hiPSC) and GSM1260414, GSM1260415, GSM1260416 (DE).
A total 5308 transcripts were found to be significantly up-regulated and 6220 transcripts were down-regulated in DE as compared to hiPSC. These 11528 differential transcripts, after annotation were found to represent 7778 unique DEGs. A list of genes expressed in human endoderm tissue (required to maintain the endoderm function) was downloaded from GeneCards database [38]. List of genes from GeneCard and up regulated DEGs in DE (output from DEN) were compared and 331 genes were found to be common among both lists. These common genes were used to extract a sub-network using DEN. This network represents an active state of interactions in DE. The derived network consists of 468 nodes (225 miRNA’s, 243 genes) and 1210 edges (Figure 3). The network contains genes with associations to miRNAs as neighbors, which results in a list of probable miRNAs involved in development and maintenance of endoderm (Supplementary file; MiRNA_interactions_DE). From the top twenty nodes having highest degree (“hubs”, based on degree measure) in the network, following hub genes can be listed (with respective degrees); ACTB (20), HSP90AA1 (21), TUBA1B (21), EEF2 (22), GAPDH (25), RPS2 (25), ACTG1 (27), VEGFA (37), EEF1A1 (40). This study can be further extended to understand the shortest or alternative paths for induction of tissue differentiation, which is out of scope for the current article.
Figure 3: An active network involved in development of endoderm, derived using DEN. Cytoscape version 2.8 [39] is used for visualization.
4.
CONCLUSION
The basic aim of this work was to assemble and avail different types of human interaction networks in the form static graphs and to use this static data as a background network for various types of analysis. The current version of DEN package (Version 1.0. available at http://sourceforge.net/projects/desn/) acts a repository of human interactome network objects and provides functions to extract relevant interactions based on the active genes in the cells. The properties of local/ active sub-networks and global networks seem to vary, since functions (thus expression) and interactions between bio-molecules are quite context specific. By providing list of genes/ miRNAs involved in a particular biological process, pathway, disease/ disorder or molecular function to DEN, pertinent sub-networks can be extracted and further analyzed.
Development of DEN is an ongoing process and later versions will contain more biological knowledge incorporated in the form of Gene Ontology (functional assignments to nodes). DEN will support robust network motif identification procedures, based on the ontologies. These features are expected to improve the biological sensitivity of this method in context specific functional module identification.
ACKNOWLEDGEMENTS
I thank Dr. Prasad Burra VLS for his valuable guidance. I also wish to thank School of Biotechnology (SoBT), IGNOU- I2IT Centre of Excellence for Advanced Education and Research, Pune for their support.
51 ISSN: 2278-8115
REFERENCES
[1] Liang H, Li W. MicroRNA regulation of human protein protein interaction network. RNA. 2007;13(9):1402-1408. [2] Martinez N, Walhout A. The interplay between transcription factors and microRNAs in genome-scale regulatory networks. BioEssays. 2009;31(4):435-445.
[3] Mammoto A, Mammoto T, Ingber D. Mechanosensitive mechanisms in transcriptional regulation. Journal of Cell Science. 2012;125(13):3061-3073.
[4] DP B. MicroRNAs: genomics, biogenesis, mechanism, and function. - PubMed - NCBI [Internet]. Ncbi.nlm.nih.gov. 2015 [cited 2 May 2015]. Available from: http://www.ncbi.nlm.nih.gov/pubmed/14744438
[5] Hwang H, Mendell J. MicroRNAs in cell proliferation, cell death, and tumorigenesis. British Journal of Cancer [Internet]. 2006 [cited 2 May 2015];94(6):776. Available from: http://dx.doi.org/10.1038%2fsj.bjc.6603023
[6] Arora S, Rana R, Chhabra A, Jaiswal A, Rani V. miRNA–transcription factor interactions: a combinatorial regulation of gene expression. Mol Genet Genomics. 2013;288(3-4):77-87.
[7] Barabási A, Oltvai Z. Network biology: understanding the cell's functional organization. Nat Rev Genet. 2004;5(2):101-113.
[8] Chen C, Ho A, Huang H, Juan H, Huang H. Dissecting the Human Protein-Protein Interaction Network via Phylogenetic Decomposition. Scientific Reports. 2014;4:7153.
[9] Aijo T, Butty V, Chen Z, Salo V, Tripathi S, Burge C et al. Methods for time series analysis of RNA-seq data with application to human Th17 cell differentiation. Bioinformatics. 2014;30(12):i113-i120.
[10] Tornow S, Mewes H. Functional modules by relating protein interaction networks and gene expression. Nucleic Acids Research. 2003;31(21):6283-6289.
[11] Li M, Wu X, Wang J, Pan Y. Towards the identification of protein complexes and functional modules by integrating PPI network and gene expression data. BMC Bioinformatics. 2012;13(1):109.
[12] Lopes T, Schaefer M, Shoemaker J, Matsuoka Y, Fontaine J, Neumann G et al. Tissue-specific subnetworks and characteristics of publicly available human protein interaction databases. Bioinformatics. 2011;27(17):2414-2421.
[13] Kong W, Zhang J, Mou X, Yang Y. Integrating Gene Expression and Protein Interaction Data for Signaling Pathway Prediction of Alzheimer’s Disease. Computational and Mathematical Methods in Medicine. 2014;2014:1-7.
[14] Qiu Y, Zhang S, Zhang X, Chen L. Detecting disease associated modules and prioritizing active genes based on high throughput data. BMC Bioinformatics. 2010;11(1):26.
[15] Gaire R, Smith L, Humbert P, Bailey J, Stuckey P, Haviv I. Discovery and analysis of consistent active sub-networks in cancers. BMC Bioinformatics. 2013;14(Suppl 2):S7.
[16] Wu C, Zhu J, Zhang X. Integrating gene expression and protein-protein interaction network to prioritize cancer-associated genes. BMC Bioinformatics. 2012;13(1):182.
[17] Lee S, Chan C, Chen T, Yang C, Huang K, Tsai C et al. POINeT: protein interactome with sub-network analysis and hub prioritization. BMC Bioinformatics. 2009;10(1):114.
[18] Lemetre C, Zhang Q, Zhang Z. SubNet: a Java application for subnetwork extraction. Bioinformatics. 2013;29(22):2958-2958.
[19] R-project.org. R: The R Project for Statistical Computing [Internet]. 2015 [cited 2 May 2015]. Available from: http://www.r-project.org/
[20] Bioconductor.org. Bioconductor - Home [Internet]. 2015 [cited 2 May 2015]. Available from:
http://www.bioconductor.org/
[21] Ritchie M, Phipson B, Wu D, Hu Y, Law C, Shi W et al. limma powers differential expression analyses for RNA-sequencing and microarray studies. Nucleic Acids Research. 2015;43(7):e47-e47.
[22] Castro M, Wang X, Fletcher M, Meyer K, Markowetz F. RedeR: R/Bioconductor package for representing modular structures, nested networks and multiple levels of hierarchical associations. Genome Biol. 2012;13(4):R29.
[23] Beisser D, Klau G, Dandekar T, Muller T, Dittrich M. BioNet: an R-Package for the functional analysis of biological networks. Bioinformatics. 2010;26(8):1129-1130.
[24] Wang X, Terfve C, Rose J, Markowetz F. HTSanalyzeR: an R/Bioconductor package for integrated network analysis of high-throughput screens. Bioinformatics. 2011;27(6):879-880.
[25] Bar-Joseph Z, Gerber G, Lee T, Rinaldi N, Yoo J, Robert F et al. Computational discovery of gene modules and regulatory networks. Nat Biotechnol. 2003;21(11):1337-1342.
[26] Gao S, Wang X. Identification of highly synchronized subnetworks from gene expression data. BMC Bioinformatics. 2013;14(Suppl 9):S5.
[27] Berger S, Posner J, Ma'ayan A. Genes2Networks: connecting lists of gene symbols using mammalian protein interactions databases. BMC Bioinformatics. 2007;8(1):372.
[28] Keshava Prasad T, Goel R, Kandasamy K, Keerthikumar S, Kumar S, Mathivanan S et al. Human Protein Reference Database--2009 update. Nucleic Acids Research. 2009;37(Database):D767-D772.
[29] Bovolenta L, Acencio M, Lemke N. HTRIdb: an open-access database for experimentally verified human transcriptional regulation interactions. BMC Genomics. 2012;13(1):405.
[30] Hsu S, Tseng Y, Shrestha S, Lin Y, Khaleel A, Chou C et al. miRTarBase update 2014: an information resource for experimentally validated miRNA-target interactions. Nucleic Acids Research. 2013;42(D1):D78-D85.
[31] Gephi.github.io. UCINET DL Format [Internet]. 2015 [cited 2 May 2015]. Available from:
http://gephi.github.io/users/supported-graph-formats/ucinet-dl-format/
[32] Csardi G, Nepusz T. The igraph software package for complex network research. InterJournal, Complex Systems. 2006;1695(5):1-9.
[33] Gautier L, Cope L, Bolstad B, Irizarry R. affy--analysis of Affymetrix GeneChip data at the probe level. Bioinformatics. 2004;20(3):307-315.
[34] Carlson M. Bioconductor - hgu133a2.db [Internet]. Bioconductor.org. 2015 [cited 2 May 2015]. Available from: http://www.bioconductor.org/packages/release/data/annotation/html/hgu133a2.db.html
[35] Loh K, Ang L, Zhang J, Kumar V, Ang J, Auyeong J et al. Efficient Endoderm Induction from Human Pluripotent Stem Cells by Logically Directing Signals Controlling Lineage Bifurcations. Cell Stem Cell. 2014;14(2):237-252.
[36] Edgar R, Domrachev M, Lash A. Gene Expression Omnibus: NCBI gene expression and hybridization array data repository. Nucleic Acids Research. 2002;30(1):207-210.
[37] Gregory Alvord W, Roayaei J, Quinones O, Schneider K. A microarray analysis for differential gene expression in the soybean genome using Bioconductor and R. Briefings in Bioinformatics. 2007;8(6):415-431.
[38] Safran M, Dalah I, Alexander J, Rosen N, Iny Stein T, Shmoish M et al. GeneCards Version 3: the human gene integrator. Database. 2010;2010(0):baq020-baq020.
[39] Smoot M, Ono K, Ruscheinski J, Wang P, Ideker T. Cytoscape 2.8: new features for data integration and network visualization. Bioinformatics. 2010;27(3):431-432.
![Figure 3: An active network involved in development of endoderm, derived using DEN. Cytoscape version 2.8 [39] is used for visualization](https://thumb-us.123doks.com/thumbv2/123dok_us/11079766.2994337/5.892.178.731.114.603/figure-network-involved-development-endoderm-derived-cytoscape-visualization.webp)
