Contents lists available atScienceDirect
Case
Studies
in
Nondestructive
Testing
and
Evaluation
www.elsevier.com/locate/csndtCharacterization
of
medical
and
biological
samples
with
a
Talbot–Lau
grating
interferometer
μXCT
in
comparison
to
reference
methods
Christian Gusenbauer
a,
∗
,
Elisabeth Leiss-Holzinger
b,
Sascha Senck
a,
Katrin Mathmann
a,
Johann Kastner
a,
Stefan Hunger
c,
Wolfgang Birkfellner
daUniversityofAppliedSciencesUpperAustria,CampusWels,Stelzhamerstraße23,4600Wels,Austria bResearchCenterforNonDestructiveTestingGmbH,AltenbergerStraße69,4040Linz,Austria cJohannesKeplerUniversityLinz,FacultyofMedicine,Krankenhausstraße9,4021Linz,Austria
dMedicalUniversityVienna,PhysicsandBiomedicalEngineering,WaehringerGuertel18-20,1090Vienna,Austria
a
r
t
i
c
l
e
i
n
f
o
a
b
s
t
r
a
c
t
Articlehistory: Availableonlinexxxx
Talbot–Lau grating interferometry is a new innovative X-raytechnology in the field of radiographyandcomputedtomographythatextendstheimagingcapabilitiesofabsorption contrast (AC)inmedicine and materialscience bythe introductionofdifferential phase contrast (DPC) and dark-field contrast (DFC). This paper discusses the benefits of the additionalimaging modalityofDFCprovidedbyanewdesktopTalbot–LauμXCT system (SkyScan1294).Withthissystem,selectedmedicalandbiologicalsamplessuchasmedical foam, corticalbone, molar tooth, and barleycorn seed samples have been imagedand compared to reference methods such as high-resolution μXCT and optical coherence tomography(OCT)regardinginformationgainandcontrast.
©2016TheAuthors.PublishedbyElsevierLtd.ThisisanopenaccessarticleundertheCC BY-NC-NDlicense(http://creativecommons.org/licenses/by-nc-nd/4.0/).
1. Introduction
ImagingmethodssuchasX-raycomputedtomography(XCT)andradiographyareessentialtechniquesinordertoreveal internal structuresinvariousresearch fieldssuch asmedicineormaterialscience applications.Concerninglow absorbing structures ormaterials with similar attenuation coefficients, conventional absorption-based contrast (AC) methods reach their limits, sinceAConly providesinformationon theattenuationofthe X-raybeamintensitythroughthe specimen.In 2002, a newinnovative X-raytechnology based on the Talbot–Lau effect hasbeen first utilized forX-ray imaging using monochromaticsynchrotronradiation[1,2].Theadditionaluseofasourcegratingin2006hasenabledtheintroductionof thistechnique withthe subsequentextraction of differentialphase contrast (DPC) anddark-field contrast (DFC)to poly-chromatic laboratoryX-raysources[3].Sincethenthemethodevolvedconcerningimprovedhardware andgratingdesign
[4],reconstructiontechniquesandimage processing[5,6],while suitablefieldsofmaterial scienceapplicationshavebeen identified[7–10].Invivo dark-fieldandphase-contrastX-rayimagingofsmallanimals aswell asasetuptowards clinical
*
Correspondingauthor.E-mailaddresses:[email protected](C. Gusenbauer),[email protected](E. Leiss-Holzinger),[email protected]
(S. Senck),[email protected](K. Mathmann),[email protected](J. Kastner),[email protected](S. Hunger),
[email protected](W. Birkfellner).
http://dx.doi.org/10.1016/j.csndt.2016.02.001
2214-6571/©2016TheAuthors.PublishedbyElsevierLtd.ThisisanopenaccessarticleundertheCCBY-NC-NDlicense (http://creativecommons.org/licenses/by-nc-nd/4.0/).
JID:CSNDT AID:26 /FLA [m3G; v1.172; Prn:23/02/2016; 7:43] P.2 (1-9) 2 C. Gusenbauer et al. / Case Studies in Nondestructive Testing and Evaluation•••(••••)•••–•••
Table 1
ScanningparametersforμXCT(tubevoltage,pre-filtration,voxelsizeVS),correspondingexposuretimesasaproductofintegrationtime,averaging,number ofprojectionsandnumberofphasestepsaswellasaxialandlateralresolutionsforOCT.
Samples SkyScan1294(Talbot–Lau μXCT)
NanotomorRayScan250E (μXCT)
SpectraldomainOCT, systemresolution
Exposuretimes in (min) Medical foam Preset2,35kV,0.25mmAl,
(22.8 μm)3VS 45kV,nopre-filter, (7 μm)3VS(Nanotom) (x/y):15 μm(z): 7 μminair ∼5 μmintissue NanotomμXCT:75 Talbot–LauμXCT:780 Cortical bone Preset2,35kV,0.25 mmAl,
(5.7 μm)3VS 60(6 μm)kV,3noVSpre-filter,(Nanotom) – NanotomTalbot–LauμXCT:μXCT:62.5504
Molar tooth Preset2,35kV,0.25mmAl, (22.8 μm)3VS;Preset5,50kV, 0.045mm Cu,(22.8 μm)3VS 100kV,nopre-filter, (14 μm)3VS(RayScan) (x/y):15 μm(z): 7 μminair ∼5 μmintissue RayScanμXCT:48 Talbot–LauμXCT: 512(preset2) 616(preset5) Barley corns Preset2,35kV,0.25mmAl,
(22.8 μm)3VS 50kV,nopre-filter, (8.25 μm)3VS(Nanotom) (x/y):6 μm(z): 2.6 μminair ∼1.8 μmintissue NanotomμXCT:62.5 Talbot–LauμXCT:520
phase-contrast radiography ofsmalljoints andmammographyrecentlydemonstrated diagnostic benefitsfor(pre-)clinical routines [5,11–13].First clinical prototypes forradiographic purposesare expected to arrivein the nearfuture [13]. The drawbacksofexistinglaboratory-basedgratinginterferometersystemsarelimitedaccess,user-friendliness,andcomplexity of operations. With theintroduction of thefirst commercially available desktopTalbot–Lau μXCTsystem (SkyScan 1294) for material science applications in the beginning of 2015, this imagingmethod now becomes accessible for a broader community[14].
Inordertoevaluateourresultsinthelightofabroaderframeworkofadditionalimagingmethods,weadditionallyapply high-resolution μXCT and optical coherence tomography (OCT). Based on white light interferometry [15], OCT employs broadband lightinthenearinfraredrangetocapturesub-surface featuresinturbidmedia [16].OCTimagesareobtained in reflection geometry,i.e. theprobing light beam is focused into theobject and theback-scattered light from different sample structurescanbemeasured inacoherentway.OCT iscapableofdetectinginterfacesbetweenregionsofdifferent refractive indexandthereby delivering contour images,whereas μXCT worksin transmissionandimagesare encoded to grayscale intensities according to material density, thus providing complementary information. The penetration depth of OCT is typically1–3 mm, depending onthe centerwavelengthofthe light sourceandthe correspondingabsorption and light scatteringpropertiesofthe sample.The lateralanddepth(also called axial)resolutionsare decoupled andtypically lie intherangeofseveralmicrometers.Commerciallywellestablishedasmedicalimagingtoolforophthalmology,OCThas alsoshownitspotentialinbiomedicineandmaterialscience[17–19].
2. Materialandmethods
2.1. Samplesandscanningparameters
In thispaper, we studied foam, bone, tooth, and seed samples using μXCTand OCT. The foam sample is a medical appliance forstimulating wound healing induced by mechanical stimulations and increasing local blood flow. It is thus acting anti-septic,accelerating wound closure, and stimulatingtissue growing intothe foam structure. The bone sample hasbeentakenfromahealthy corticalbone(tabulaexternaexplant)forjawboneimplant construction.Thetooth sample is a molar tooth, whose root was treated with metallic and plastic dental fillings. The investigated cereal samples are represented by barley corns with differentinitial conditioning (untreated and maltedcorns) prior to the actual brewing process.TheparametersforTalbot–LauμXCT,high-resolutionμXCT,andOCTscansareshowninTable 1.
2.2. High-resolutionμXCT
High-resolution μXCTscans(absorptioncontrast) havebeenperformedwithlaboratoryμXCT devicesincluding(i) aGE Nanotom 180NF sub-μ-XCT device witha 180kVhigh nano-focus X-raytubeand a 2304
×
2304 pixel Hamamatsuflat paneldetectorallowingaminimalvoxelsizedownto500 nmand(ii)aRayScan250Esystemwitha225 kVμ-focusX-ray tubefromViscomanda2048×
2048 pixelPerkinElmerflatpaneldetector,withaminimalvoxelsizeofabout5 μm.2.3. Talbot–LaugratinginterferometerμXCT
The SkyScan 1294 Talbot–Lau grating interferometer μXCT setup is consisting of a PANalytical μ-focus X-ray source, a detectorfromPrincetonInstrumentswith4000
×
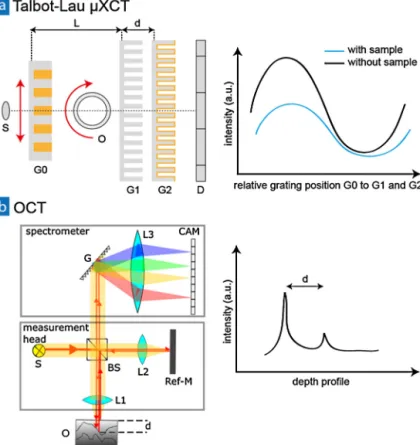
2672 pixels.AtypicalTalbot–LauμXCTsetupisshowninFig. 1a.A source grating (G0)actsasan array oflinesources,ensuring asufficienttransverse coherencelength, whileadiffractivegratingFig. 1.Sketchesofworkingprinciplesof(a)Talbot–LauμXCTsetupand(b)OCTsystem;(a)X-raysourceS,gratingsG0/G1/G2,objectO,detectorD,and gratingdistancesLandd;(b)lightsourceS,beamsplitterBS,lensesL1/L2/L3,objectO,referencemirrorRef-M,gratingG,linescancameraCAM,and distancebetweensamplesurfaceandfirstinterfaced.
(G1)causesphasemodulationoftheincomingX-raysresultinginaninterferencepattern.Since thefringepatterncannot be resolved directly withconventional X-ray detectors,an absorption grating (G2) isplaced in front of thedetector. G1 andG2 areestablishingtheinterferometer.ThesourcegratingG0 isusedtoscantransverselyacrosstherepeatedintensity pattern,calledphasestepping,resultinginasinusoidalintensitymodulation.Rotatingthesamplestepwiseinbetweenthe acquisitionofthephasesteppingcurvesallowsthetomographicoperation.
ACisformedduetotheabsorptionmechanismofphotonsinteractingwithmatterpredominantlyinformofphotoelectric effectandCompton scatteringinthelow keVrange.DPCisrelatedto theindexofrefraction andimage contrastis thus achievedthroughthelocaldeflectionoftheX-raybeam.DFCcontainsthetotalamountofradiationscatteredatsmallangles inforwarddirection,mainlycausedbysurfacesandinterfacesofinternalstructuressuchasporesorcracks.Theplacement ofasamplewithinopticalbeamaxiswillattenuate,refract,andscattertheincomingX-rayandthusperturbingtheperiodic intensity modulations. A Fourier analysis of the intensity modulations of each detector pixel is used to simultaneously extractco-registeredAC,DPC,andDFC.
Apreciseproductionofgratings withadequate gratingpropertiesandaperfectalignmentofallthreegratings in rota-tionandtiltare mandatoryforproperdataextraction.The preciserelativealignmentofgratings inrotationandtilting is realizedbyamulti-axispositioningsystembasedonminiaturesteppingmotorsandbacklash-freeactuators.Phasestepping isrealizedbypiezodriveswithaclose-looppositioningfeedback,whichprovidessufficientlyhighpositioningaccuracyand repeatability. Theabsorption grating G2 in front ofthe camera staysstatically. The phase grating G1 canbe adjusted by rotationandtilting foraligningwithrespectto G2.Thediffractivegrating G1 can bemoved indirectionalong thebeam formaximummodulationofphasecarpetpatternonthesurfaceofgratingG2.ThesourcegratingG0 canbealignedonits rotationalpositionincorrespondencetoG1 andG2.
2.4. Opticalcoherencetomography
Forthe measurements two differentOCT systems were applied.Both systems are so-calledspectral domain(SD) OCT systems,asshowninFig. 1b[20,21].Thelightemitted bythebroadbandlightsource S issplitintoreferenceandsample beamatthebeamsplitterBS.Thereferencebeamisthenreflected bythereferencemirrorRef-Mwhilethesample beam is focused into the object O andreflected atits surface andvarious interfacesinside. After recombinationat the beam splitterBS,theinterferenceofsampleandreferenceisspectrallydecomposedbyagrating Gandfocusedontoaline-array
JID:CSNDT AID:26 /FLA [m3G; v1.172; Prn:23/02/2016; 7:43] P.4 (1-9) 4 C. Gusenbauer et al. / Case Studies in Nondestructive Testing and Evaluation•••(••••)•••–•••
Fig. 2.μXCTsliceimagesofACandDFC(SkyScan1294),AC(Nanotom),imagesofOCTand3Drenderingsofmedicalfoamforwoundhealing.AC(Nanotom) andOCTareshowingdifferentsliceandrenderingpositions,butatacomparablescale.
detector D. The inverseFouriertransform convertsthe data fromthe spectral domain intothe spatial domain, resulting in an immediateA-Scanof thesample. Thisisexemplified inFig. 1b forthesurface anda single inner interface.For2D and3D data,thesample iseitherrasterscannedwithmirrorsand/or moved onastage. Thepenetration depthofOCT is limitedbytheabsorptionandlightscatteringpropertiesofthesampleattheusedcenterwavelength.Thelateralresolution is determinedbythefocusing optics.Theaxialresolutionislimitedbythe centerwavelengthandbandwidthofthelight source. Best depth resolution is achieved for high bandwidth sources centered at shorter wavelengths, whereas longer wavelengthsoftenprovideasignificantlyhigherpenetrationdepthforhighlyscatteringsamples[22].
Forthehigh-resolutionmeasurementsofthebarleycorns,alab-basedOCTsystemwasapplied,withacenterwavelength around850 nmandaspectralwidthof260 nmprovidinganaxialresolutionbetterthan2.6 μminairbutlessthan1mm penetration depth.Thelateralresolutionoftheappliedobjectiveisbetterthan2 μm.Toachieve ahighpenetrationdepth, a system with a center wavelength around 1300 nm and a spectral width of 150 nm, was applied, providing an axial resolution of lessthan 7 μm in air (Telesto,Thorlabs). The lateralresolution is less than 15 μm.In axial direction, OCT images the optical path, whichis stretched in comparison tothe geometric path, namely by the factorof the refractive indexn.Thus,theaxialresolutionisenhancedbythisfactor,andforn
=
1.
4 resultsinanaxialresolutionintissue(suchas polymersorteeth)of5 μmfortheTelestosystem.3. Resultsanddiscussion 3.1. Foamsample
Usingconventionalabsorption-basedμXCTitisveryhardtocharacterizepolymericfoamstructureslikethinstrutsand walls withlow densityatlow physicalresolutions. Fig. 2showsTalbot–Lau μXCT slicesofAC andDFCincomparison to Nanotom AC andOCT data. DFCresolves the individual wallsof the foamstructure with much better contrast,whereas AC is only capable of resolving thicker knots. Even though the thickness of the cell walls are overestimatedand image noise could bea problemforfurtherimage processing,DFC turnsout tobe thekey imagingmodality,allowing a proper segmentationandcharacterizationofcellwallsandcellularfoamstructuresbye.g.computingtheporesizedistribution.At higherresolutions,absorptionbasedμXCT(Nanotom)iscapableofresolvingindividualcellwalls.
OCT imagesinFig. 2were obtainedbytheTelesto system.Theyareshowingthepotentialofthismethodasatoolfor imaging andqualitativelycharacterizing shape,size, anddistributionsof theindividual cells inpolymeric foams ina fast and non-destructive way. The penetration level isconsidered to be in the range of4 layers ofvoids. A strong signal is justcreatedatthe interfacesbetweenairandpolymer andin combinationwiththehigh-resolution capabilities, thewall thicknessoftheindividualcellswallscanbedeterminedquiteaccurately.
Fig. 3.μXCT slice images concerning AC and DFC (SkyScan 1294), AC (Nanotom) and its 3D rendering of a cortical bone sample (tabula externa explant).
3.2. Bonesample
Thecorresponding NanotomAC,Talbot–Lau μXCTACandDFCsliceimagesofthecortical bonesample (tabulaexterna explant)are showninFig. 3.Inareasofcompact anddense bone,both image modalitiesdelivera moreorlessclearAC andDFCsignal. TheDFCisheavily pronetoimage noise,sincethesamplehasbeenscannedatnativedetectorresolution without binning. The Talbot–Lau μXCTsystem is capable of acquiring sharp ACimages, which is also confirmed by the high-resolutionNanotomscan.ACshowstheperforatingholesinthecorticalbone,whichcanbeseparatedwellfromthe bonematrix.
DFCshowsespeciallyforcracklikestructuresastrongdark-fieldsignal,whichcouldbeusedtoidentifysmallcracksin medicalquestionsandthussupportingclinicaldiagnosis.Inareaswithspongybone,onlyACisresolvingthetrabecularbone structure infulldetail,whereas DFCisshowinga diffusedark-fieldsignal causedby toomuchscatteringandabsorption. Thus, the dark-field signal is heavily distorted and only part of the signal is containing proper geometrical information intermsofindividual resolved trabecularstructures. Nevertheless,thesystemiscapable ofextractingaproper dark-field signal,eventhoughtheusedvoxelsizeof(5.7 μm)3 becomesalreadycomparabletotheperiodsofthegratings.
3.3. Toothsample
The molar tooth has been scanned with two different system presets. Preset 5 (50 kV, 0.045 mm Cu) leads to less pronouncedbeamhardeningartifacts inthecaseofAC,sinceadditionalpre-filteringcutsofflowenergyphotons,whereas preset2(35 kV,0.25 mmAl)yieldsaslightlystrongerdark-fieldsignalwithlessimagenoise,sincethispresetfitsbetterto thedesignenergyandgratingefficiencyoftheTalbot–LauμXCTsystem.Thedesignenergyisamongotherthingsdependent ontheeffectivewavelength,theperiodoftheG1 grating,andthedistancesdandL.Fig. 4showsaxialsliceimagesthrough thecusp tipsoftheocclusalsurface. Larger cracksare visiblebothinACandDFCwithsignificantcontrastadvantages in thecaseofDFC,sincesmallercrackscanonlyberesolvedintheDFCimages.Thestrongdark-fieldsignalisoverestimating theactualcrackwidth.
For image fusion, a combination of high-pass filtered AC and DFC images are added to the original AC image. The low-passfilteredimagesarecomputedbya2D convolutionwithaGaussianfunction.Toobtainthehighfrequenciesofan
JID:CSNDT AID:26 /FLA [m3G; v1.172; Prn:23/02/2016; 7:43] P.6 (1-9) 6 C. Gusenbauer et al. / Case Studies in Nondestructive Testing and Evaluation•••(••••)•••–•••
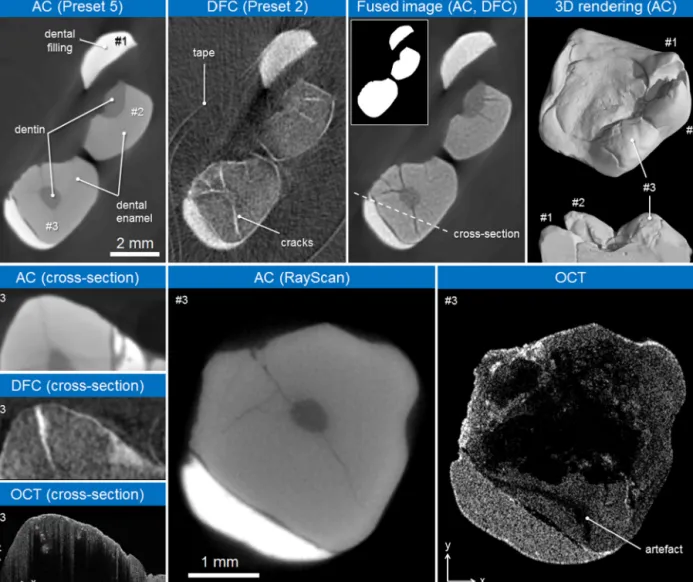
Fig. 4.μXCTsliceimagesconcerningAC(preset5),DFC(preset2),afusedimage,AC(RayScan)andits3DrenderingaswellasOCTresultsshowingalarge crackinthedentalenamelphaseoftheocclusalsurfaceofamolartooth(threelowerleftimages).
image, a low-pass filteredversion ofthisimage is subtracted.The convolution forthehigh-pass filtering was realizedas a multiplicationinfrequencydomain.Forthefusedimage, animage mask wasgeneratedfromACtomask allregions of theDFCimage thatareair(see Fig. 4,upperrow:insertinthefusedimage),hencedisplayingonlythedentalregions#1, #2and#3.SummingupallintensitiesoftheoriginalAC,high-pass filteredACandhigh-passfilteredDFCimagethatwas maskedandinverted,producesthefusionresultshowninFig. 4.Inthisfusionmethod,thephysicalrepresentationofdental filling,dentalenamel,anddentinphasesregardingtheirgray valuesispreservedandinternal structuressuchascracksor airgapsareemphasized.Duetotheuseofabinarymask,noimagenoiseisaddedtoareasofair.
The OCT C-scan
(
x/
y)
inFig. 4 (lowerright image),at1300 nm,at asimilar position showstheinterfaces ata finer scale. The darkregion, indicatedby the marker,is a shadowingartifact of thecrackat thesurface. While thehigh axial resolution ofthe OCT systemallows the detectionofcracks anddelamination parallel tothe surface thinner than7 μm, defects perpendicular tothesurface ofa highly scatteringmediumare lessapparent.The penetration withOCTis rather limited. Therefore it is not possible to track the crack until it reaches the dentin phase. The surface and interfaces are representedbyOCTinmuchmoredetailascomparedtotheresultsoftheTalbot–LauμXCTscan(lowerleftimage).3.4. Seedsamples
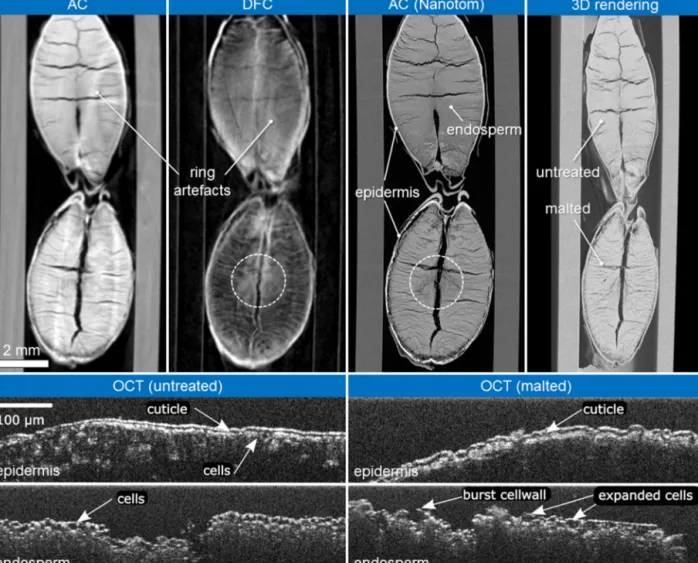
Fig. 5showsan untreated(top)andamaltedbarleycorn(bottom)that ispreparedoptimallybeforebrewing beer.The microstructurehasanimportantinfluenceonthebrewingprocess,sincetheinnerstructurefacilitatesthereactivationand the development ofenzymes requiredforconverting thegrain’s starches intosugars. The untreatedbarley cornshowsa compactregionofendospermwithfewercracksascomparedtothemaltedone.Thedifferencesoftheinnerstructuresof
Fig. 5.μXCTresultsofACandDFC(SkyScan1294),AC(Nanotom)andits3Drenderingaswellsashigh-resolutionOCTimagesshowingthecornshell (epidermis)andcross-sectionsinthecenterofthecuttingplane(endosperm)ofanuntreatedandmaltedbarleycorn.
thebarleycornscanbedistinguishedwithbothmodalitiesACandDFC,whereasDFCshowsamorepronounceddifference intermsofgray values,reflectingamajorchangeinthemicrostructureduetomaltingtreatment.Thehigh-resolution Nan-otomscaniscapableofresolving crackswithan openingof10 μm,confirmingthevisualimpressionfromDFC,especially intheareaofthedottedcircle.
ThebottomimagesofFig. 5showthehigh-resolutionOCTimages.Themicrostructureoftheshellshowednosignificant changes,besidesaslightincrementofcuticle-thickness,aslightroughersurfaceandlesspenetrationdepthreflectedbythe changeincolorin thecaseofthemaltedbarley corn.Due toscatteringandabsorption,thepenetration depthwas quite low.Thereforeadestructiveintermediate stepwasnecessaryby cuttingthebarleycornsinhalf.Theinnermicrostructure hadchangedsignificantly.Whilethecellwallsoftheuntreatedcornwerelargelyintact,thecellsinthemaltedoneseemed tohaveswollenintheprocess untilmostofthecellwallshadburst.Thiscan beassociatedwiththemaltingprocess,in whichthecellsswellduringthesteepingandareexposedtoheatduringkilning.
4. Conclusionsandsummary
Allthreemethodspresentedinthispaperrelyondifferentmechanismsforimageformationandunderlaycertain phys-icalpropertiesaswell asrestrictions.While thecontrastofACisbasedonabsorption,thecontrastofDFCisproportional tothe localscatteringstrength ofthesample andOCT visualizeslocalchangesoftherefractive index.Eventhough high-resolutionμXCTsarepowerfultoolsformaterialscharacterization,conventionalabsorption-basedmethodsreachtheirlimits whenscanninglowabsorbingstructuresormaterialswithsimilarattenuationcoefficients.Theintroductionofnewimaging modalitiesby Talbot–LauμXCThelpstoovercomecertain limitations.Forexample,DFCis capableofidentifyingcracksin variousmaterials rangingfromcalcifiedtissues liketeeth andbonestofiberreinforcedpolymers[14],which canbeeven
JID:CSNDT AID:26 /FLA [m3G; v1.172; Prn:23/02/2016; 7:43] P.8 (1-9) 8 C. Gusenbauer et al. / Case Studies in Nondestructive Testing and Evaluation•••(••••)•••–•••
smallerthanthespatialresolutionofhigh-resolution,absorption-basedμXCTsystems.Nevertheless,thereareafew draw-backsconcerningTalbot–LauμXCTformaterialscharacterization,sinceconventionalabsorption-basedμXCTsystemsusually offeramuchfasterdataacquisitionbyafactorof5–10andsignificantlyhigherpenetrationcapabilities.Moreover,athigh resolutions,ACiscapableofresolvingsmallerstructuresintherangeofmicronsforsampleswithasmalldiameter.Finally, OCTiswellsuitableforaveryfastacquisition(withinseconds)ofthemicrostructureathigh-resolutionbeingabletodepict featuresclosetothesurfaceinnottoostronglyscatteringorabsorbingmaterials.OCTisabletoscanarbitrarylargesample areas.
Inthispaper,wescannedmedicalfoam,corticalbone,molartooth,andbarleycornseedsampleswiththenewTalbot– LauμXCTdeviceandcomparedtheresultstohigh-resolutionμXCTandOCTasreferencemethods:
•
Medical foam: While Nanotom ACshows good data quality in terms ofimage contrast andnoise, it fails in the vi-sualization ofthinwall structures. DFCturns outto be thekey imagingmodality,since individual wallsofthefoam structure canberesolvedinmuchmoredetailandwithbettercontrastcomparedtoACallowingthecharacterization offoamsbye.g.computingtheporesizedistribution.Nevertheless,ithastobeconsidered,thatthestrongDFCsignal of cell wallsisleading to a strongoverestimation oftheir actual thickness. OCT is showingits potential forimaging and characterizingqualitatively shape, size anddistributions ofthe individual cells inpolymeric foams in a fastand non-destructive way.Unfortunately,shadowingeffectsinOCTdataofincompletelyimagedwallsaremakingstatistical evaluationofporesimpossible.•
Cortical bone: DFCshowsespecially forsmallcrack-likestructuresa strongdark-field signal,even thoughthe images havebeenacquiredatthenativedetectorresolutionandtheimage isheavilyprone tonoise.Talbot–LauμXCTallows the extractionofsharpACimagesatthenativedetectorresolution,evenata relativelylarge focalspotsizeofabout 30 μm,whichisalsoconfirmedbythehigh-resolutionNanotomACscan.•
Molar tooth:AdualenergyapproachwiththesubsequentimagefusionofACwithhigh-passfilteredACandDFCimages allowsthecharacterizationofinnerstructuresclosetotheocclusalsurface,whilethephysicalrepresentationofdental filling, dentalenamel, anddentinphases regardingtheir gray values ispreserved. OCT iscapable of resolving larger cracksneartheocclusalsurfaceandinterfacesatafinerscale.ThepenetrationwithOCT isratherlimited.Thereforeit isnotpossibletotrackthecrackuntilitreachesthedentinphase.•
Barley corns:Comparingtheuntreatedandmaltedbarleycorn,DFCshowsadistinctchangeinmicrostructure,sincethe maltingprocesscausesthedevelopmentofmanysmallcracksintheendospermregion,whereas theuntreatedbarley cornshowsamorecompactmatrixwithfewercracks.InthecaseofOCT,individualburstcellscanbeidentifiedinthe caseofthemaltedcorn,showingasignificantchangeinmicrostructureatafinerscaleaswell.Acknowledgements
Thisworkwassupportedbythe“K-Projectfornon-destructivetestingandtomographyplus”supportedbyCOMET pro-gram of FFG andthe Federal GovernmentofUpperAustria andStyria andtheproject“MiCi” supportedby the European RegionalDevelopmentFund(EFRE) intheframeworkoftheEU-programIWB2020.TheauthorswanttothankMr.Sasovfor hiscontinuoussupportandfruitfuldiscussions.
References
[1]David C,Nöhammer B,Solak HH,Ziegler E.DifferentialX-rayphasecontrastimagingusingashearinginterferometer.ApplPhysLett2002;81:3287–9.
[2]Momose A,Kawamoto S,Koyama I,Hamaishi Y,Takai K,Suzuki Y.DemonstrationofX-rayTalbotinterferometry.JpnJApplPhys2003;42:866–8.
[3]Pfeiffer F, Weitkamp T, Bunk O, David C. Phase retrieval and differential phase-contrast imaging with low-brilliance X-ray sources. Nat Phys 2006;2:258–61.
[4]Rutishauser S,Bednarzik M,Zanette I,Weitkamp T,Börner M,Mohr J,etal.Fabricationoftwo-dimensionalhardX-raydiffractiongratings. Microelec-tronEng2013;101:12–6.
[5]Scholkmann F,Revol V,Kaufmann R,Baronowski H,Kottler C.Anewmethodforfusion,denoisingandenhancementofx-rayimagesretrievedfrom Talbot–Laugratinginterferometry.PhysMedBiol2014;59:1425–40.
[6]Bevins N,Zambelli J,Li K,Qi Z,Chen GH.Multicontrastx-raycomputedtomographyimagingusingTalbot–Lauinterferometrywithoutphasestepping. MedPhys2012;39:424–8.
[7]Sarapata A,Ruiz-Yaniz M,Zanette I,Rack A,Pfeiffer F,Herzen J.Multi-contrast3DX-rayimagingofporousandcompositematerials.ApplPhysLett 2015;106:154102.
[8]Lauridsen T, Willner M, Bech M, Pfeiffer F, Feidenhans R. Detection of sub-pixel fractures in X-ray dark-field tomography. Appl Phys A 2015;121(3):1243–50.
[9]Malecki A,Potdevin G,Biernath T,Eggl E,Willer K,Lasser T,etal.X-raytensortomography.EurophysLett2014;105:38002.
[10]Hannesschläger C,Revol V,Plank B,Salaberger D,Kastner J.Fibrestructurecharacterisationofinjectionmouldedshortfibre-reinforcedpolymersby X-rayscatterdarkfieldtomography.CaseStudNondestructTestEval2015;3:34–41.
[11]Bech M,Tapfer A,Velroyen A,Yaroshenko A,Pauwels B,Hostens J,etal.In-vivodark-fieldandphase-contrastX-rayimaging.SciRep2013;3:3209.
[12]Stampanoni M,Wang Z,Thüring T,David C,Rössl E,vanStevendaal U,etal.Towardclinicaldifferentialphasecontrastmammography:preliminary evaluationsandimageprocessingschemes.JInstrum2013;8.
[13]Momose A,Yashiro W, Kido K, Kiyohara J,Makifuchi C,Ito T, et al. X-rayphaseimaging:from synchrotron tohospital.PhilosTrans RSoc A 2014;372(2010).
[14]Kastner J,Senck S,Gusenbauer C,Plank B,Hannesschläger C,Zauner H,etal.Three-dimensionalcharacterizationoffibre-reinforcedpolymersusinga Talbot–LaugratinginterferometerμCTand datafusionmethods.In:ProceedingsXNPIG20153rdmeetingofX-rayandneutronphaseimagingwith gratings.2015.
[15]Bouma BE,Tearney GJ.Handbookofopticalcoherencetomography.NewYork:MarcelDekker;2002.
[16]Huang D,Swanson EA,Lin CP,Schuman JS,Stinson WG,Chang W,etal.Opticalcoherencetomography.Science1991;254(5035):1178–81.
[17]Stifter D. Beyond Biomedicine: a review of alternative applications and developments for optical coherence tomography. Appl Phys B 2007;88(3):337–57.
[18]Nemeth A,Hannesschläger G,Leiss-Holzinger E,Wiesauer K,Leitner M.Opticalcoherencetomography–applicationsinnon-destructivetestingand evaluation.2013.
[19]Leiss-Holzinger E, Wiesauer K,Stephani H,Heise B,Stifter D,Kriechbaumer B,et al.Imagingoftheinner structureofcave bearteethbynovel non-destructivetechniques.PalaeontolElectronica2015;18(1):18.1.1T.
[20]Choma M, Sarunic M, Yang C, Izatt J. Sensitivity advantage of swept source and Fourier domain optical coherence tomography. Opt Express 2003;11(18):2183–9.
[21]Fercher AF,Drexler W,Hitzenberger CK,Lasser T.Opticalcoherencetomography–principlesandapplications.RepProgPhys2003;66(2):239–303.