Breakup and Behavior
Dissertation zur Erlangung des Grades des Doktors der Naturwissenschaften der Naturwissenschaftlich-Technischen Fakultät II
Physik und Mechatronik -der Universität des Saarlandes
von
Dipl. Phys. Michael Hein Saarbrücken
Dekan: Univ.-Prof. Dr.-Ing. Georg Frey Mitglieder des Prüfungsausschusses:
Vorsitzender: Univ.-Prof. Dr. rer. nat. Ludger Santen
Gutacher: Univ.-Prof. Dr. rer. nat. Ralf Seemann
Univ.-Prof. Dr. rer. nat. Helmut Seidel Univ.-Prof. Dr. rer. nat. Steen Hardt
Tropfenbasierte Mikrouidik ist eine beliebte Methode zur Miniaturisierung (bio-)chemi-scher Analysen und Synthesen. Allerdings mangelt es bis heute an einem vollständigen Verständnis der Tropfenbildung und der Strömung von Tropfen in Mikrokanälen, welche beide durch Grenächenkräfte und dynamische Eekte beeinusst werden. Tropfenbil-dung wurde im Rahmen dieser Arbeit am Beispiel des Zerfalls üssiger Filamente an einer topograschen Stufe untersucht. Durch Charakterisierung der Filamentform konn-te der Übergang zwischen zwei Regimen der Tropfenproduktion mitkonn-tels eines einfachen geometrischen Kriteriums vorhergesagt werden. Weitere Regime wurden für breitere Fi-lamente gefunden und beschrieben. Weiterhin wird gezeigt, dass die sich die Strömung in länglichen Tropfen in rechteckigen Mikrokanälen mit zunehmender Tropfengeschwindigkeit strukturell ändert, was durch die zunehmende Deformation der Tropfen verursacht wird. Folglich lässt sich die geschwindigkeitsabhängige Akkumulation von Partikeln in länglichen Tropfen durch das Zusammenspiel von innerer Strömung und Sedimentation erklären. Die Anwendbarkeit dieses Eekts für On-Chip Partikel- und Zellanreicherung wird aufgezeigt. Zusätzlich wird ein Verfahren eingeführt, mit dem sich der Einuss de-fokusierter Tracerpartikel auf Strömungsmessungen mittelsµPIV bestimmen lässt. Dies erleichtert sowohl die Versuchsplanung als auch die Interpretation von Messungen in dreidimensionalen Strömungen.
Droplet based microuidics today is a popular tool for miniaturized (bio-)chemical anal-ysis and synthesis. Despite large scientic eorts, a profound understanding of droplet formation and of the dynamics of droplets in microchannels is still wanted, both deter-mined by interfacial forces and dynamic eects. Droplet formation is studied for a liquid lament subject to a sudden release of connement. Characterizing the lament shape, the transition between two distinct breakup regimes is predicted by a simple geomet-ric criterion. Additional breakup regimes are reported and described upon increasing the width of the lament. The internal ow eld of elongated droplets in rectangular microchannels is demonstrated to qualitatively change with increasing droplet velocity, caused by deformation of the droplet's outer shape. Consequently, the velocity depen-dent accumulation of particles within droplets is explained by the interplay between the internal ow eld and gravity driven sedimentation. Application of this eld free particle accumulation to on-chip particle and cell enrichment is demonstrated. Additionally, a method to directly characterize the inuence of defocused tracer particles on ow veloci-ties measured by µPIV is proposed to facilitate design of experiments and interpretation of velocity elds measured in three dimensional ows.
Kurzzusammenfassung v
Abstract vii
1. Introduction 3
2. Theory and Background 7
2.1. Flows on Small Scales - Fundamentals . . . 7
2.1.1. General Equation of Motion . . . 7
2.1.2. Navier-Stokes Equation . . . 9
2.1.3. The Reynolds Number . . . 10
2.1.4. Stokes and Hele-Shaw Approximation . . . 10
2.2. Multiphase Flow and Emulsions . . . 12
2.2.1. Interfacial Tension . . . 12
2.2.2. Laplace Pressure . . . 13
2.2.3. Capillary and Weber Number . . . 13
2.2.4. Wettability . . . 14
2.2.5. Surfactants . . . 15
3. Materials and Methods 19 3.1. Device Preparation and Liquid Systems . . . 19
3.1.1. Softlithography . . . 19
3.1.2. Micromilling . . . 22
3.2. Quantitative Measurements . . . 23
3.2.1. Pendant Drop Method . . . 23
3.2.2. Experimental Setup, Optical Microscopy and Image Analysis . . . 24
3.2.3. Fluorescence Microscopy and µPIV . . . 25
4. Droplet Generation from Squeezed Filaments upon Release of Connement 29 4.1. Emulsication - Overview . . . 29
4.2. Droplet Formation in Microuidics . . . 30
4.2.1. Cross-Flow . . . 32
4.2.2. Co-Flow . . . 33
5. Employing Droplet Dynamics to Concentrate Particles 39 5.1. Introduction and State of the Art . . . 39 5.1.1. Particle Accumulation in Microuidics . . . 39 5.2. Particle Accumulation within Droplets in Rectangular Microchannels . . . 43
6. Determining the Weighting Function and Depth of Correlation in µPIV 47
6.1. PIV and µPIV- Basic Principles . . . 47 6.2. Depth of Correlation and Weighting Function - Context and State of the Art 49 6.3. Weighting Function and Depth of Correlation Determined from
Experi-mental Particle Images . . . 51
7. Summary and Outlook 53
8. Addenda 57
Addendum I: Capillary focusing close to a topographic step: shape and insta-bility of conned liquid laments . . . 58 Addendum II: Coexistence of dierent droplet generating instabilities: new
breakup regimes of a liquid lament . . . 66 Addendum III: Template-Free Preparation of Platinum Doped Silica Catalyst
Microspheres Through a Microuidic Scheme . . . 76 Addendum IV: Flow eld induced particle accumulation inside droplets in
rect-angular channels . . . 90 Addendum V: Calculation of the weighting function and determination of the
depth of correlation in micro-PIV from experimental particle images . . . 102 Addendum VI: Direct calculation of depth of correlation and weighting function
in µPIV from experimental particle images . . . 125
List of Figures 135
Bibliography 136
A. Publications 145
B. Acknowledgements 147
Miniaturization is one of the most vibrant and thriving trends in science and industry ever since the beginning of the microelectronic revolution in the 1960s. The miniaturization of electronic systems and the accompanying decrease of cost of computational power make communication and acquisition of information easier than ever, available everywhere at all times. These developments have changed the way of live in industrialized countries with a momentum and impact incomparable to any other technological achievement in the history of humanity.
To facilitate the production of microelectronic systems, a plethora of microfabrication techniques have been developed that are nowadays commonly used in semiconductor industry. However, researchers quickly realized that techniques like selective etching and deposition of functional material layers allow for much more than just purely elec-tronic microsystems [1, 2]. Starting in the 1980s, increasing numbers of Micro Electro-Mechanical Systems (MEMS) were developed, combining electronics and miniaturized mechanical components. Today, MEMS are widely used in our everyday gadgets with applications ranging from microphones and position sensors in smartphones to accelera-tion sensors in cars.
Naturally, the next step was including the handling of tiny amounts of uids on microchips to make MEMS valuable for (bio-)chemical detection and synthesis. However, it was not before the 1990s that the emerging new discipline in science and engineering called microuidics gained in momentum. Initial microuidic research mainly dealt with handling continuous streams of a single liquid phase or with inkjet-printing, where ink droplets are ejected from a micro-actuated nozzle [35]. Besides working on the development of uid handling tools such as small valves, pumps and separation systems [69], researchers quickly began to specically design microuidic systems for chemical reactions or (bio-)chemical analysis, so called micro-Total Analysis Systems (µTAS) or Lab-on-a-Chip (LoC) devices [10,11]. An early example of a commercialized LoC product are the widespread glucose-meter test strips used to monitor glucose levels of diabetes patients, that consume only minute amounts of blood.
Downscaling bulk methods to microuidic systems oers signicant advantages, i.e. minute sample and reagent consumption, possible portability of the analytic device, low-cost production of disposable chips and superior control over reaction conditions such as temperature and concentration gradients. However, several diculties arise from the changing physics at small scales: Microuidic ows are typically laminar as viscous
dissipation quickly damps out any possible turbulence on small scales. While this is benecial whenever precise control of the ow is needed, laminar ow prevents rapid mixing of uids and reagents that can only proceed via diusion. Additionally, the ow prole typically established due to viscous friction with channel walls causes plugs of sample liquids loaded into the channel to smear out due to Taylor-Aris dispersion. Thus, concentrations of analytes may be signicantly reduced prior to analysis and channels are contaminated by the sample, preventing re-use of the same chip for subsequent analysis. The disadvantages of continuous microuidic systems can be overcome using multi-phase ows in microuidics. In droplet based microuidics, droplets surrounded by another immiscible liquid are manipulated. The presence of liquid/liquid interfaces in-duces recirculative swirling ow proles within the droplet, that signicantly reduce mixing timescales of reactants and thus eectively accelerate chemical reactions. Addi-tionally, using droplets as discrete reaction vessels intrinsically reduces contamination of channel walls and dispersion [5,12]. Furthermore, the problem of channel clogging in the presence of particles or jellifying reactions can be signicantly reduced using droplets to host the respective substances and to prevent contact to channel walls. Manipulating the content of each droplet, droplet based microuidic systems oer the potential for mas-sive parallelization and high-throughput screenings for (bio-)chemical or pharmaceutical application [13].
To exploit the full potential of droplet based systems, a profound understanding of the interfacial instabilities leading to the formation of monodisperse emulsions as well as the dynamics of droplets in microchannels is crucial, both studied within the framework of this thesis. The present work is comprised of six publications, which are presented in the Addendum of this thesis: Four scientic papers already published or accepted in peer-reviewed journals, accompanied by two conference proceedings. Although these publications are the ospring of dierent projects, they are strongly interconnected.
The results chapters are preluded by a short introduction to the physics of liquids on small scales in Chapter 2. Subsequently, device fabrication methods and quantita-tive measurement techniques employed in the framework of this thesis are elucidated in Chapter 3. These common fundamentals are essential to the three following result chapters. Each of these result chapters is comprised of a review summarizing the relevant literature and state of the art of the respective topic, followed by a short summary of the results presented in the journal articles and proceedings attached as addenda.
Chapter 4 deals with the breakup of a squeezed liquid lament co-owing with an immiscible continuous phase in a shallow channel and subject to a sudden release of connement at a topographic step. Droplet formation devices of this type, so called Step-emulsication geometries, typically feature two distinct breakup regimes. In the rst regime the lament decays into monodisperse droplets right at the topographic step. The second regime features a jet of dispersed phase being ejected beyond the step, from which droplets detach primarily due to capillary instabilities. A quantitative model for
Addendum I, capable to accurately predict the transition between both droplet breakup regimes. Addendum II widens the parameter range studied in Addendum I, surprisingly nding a plethora of new droplet breakup regimes for very wide and shallow laments. These new regimes, consisting of several coexisting droplet producing instabilities in-teracting on the same lament, are characterized experimentally and arguments for the transitions between individual regimes are proposed. Finally, Addendum III exemplies practical application of two hydrodynamically coupled Step-emulsication geometries to on-chip production of solid particles via a sol-gel reaction scheme.
Chapter 5 and Addendum IV deal with particle accumulation and concentration within elongated droplets of several nanolitres in volume in rectangular microchannels. The ability to concentrate particles on-chip is a prerequisite for miniaturization of many biochemical assays using solid particles with functionalized surfaces or chemical reactions facilitated by the presence of a solid catalyst. Accumulation patterns depend on particle and dispersed phase properties as well as on the droplet traveling velocity, which is shown to be a consequence of a topologically changing ow eld inside the droplets. The topo-logical transition of the internal ow is shown to be caused by increasing deformation of the droplet interface at elevated droplet velocities.
The internal velocity eld of droplets has been studied byµPIV, a non-invasive opti-cal technique based on cross-correlation of images of small tracer particles which follow the internal ow. Tracer particles within a certain interval around the focal plane can signicantly inuence the measured in-plane velocities in the presence of out-of-plane velocity gradients. Knowing this distance is important when designing experiments and interpreting measurements on complex three-dimensional ows such as the internal recir-culation within droplets in microuidic channels. In Chapter 6 and Addenda V and VI, a novel method to determine the inuence of out-of-focus particles onµPIV measurements from experimentally recorded particle images is introduced.
Finally, the presented ndings and results are discussed in an overall summary and an outlook to possible future work is given in the concluding Chapter 7.
Microuidic systems have evolved to powerful tools in many dierent elds of applica-tion. The main reason for this success, besides the minute sample volumes that can be handled in typical microuidic chips, is the changing physics of uid ow upon decreas-ing the system size to the micro-scale. The phenomenon can be best illustrated by a simple scaling argument: surface forces typically scale with surface area, i.e. l2, while volume forces scale with l3. Consequently, the ratio of these two forces grows l1. Thus, interfacial forces typically dominate over viscous forces and inertia on small scales, turbulence is suppressed by viscous dissipation and mixing is governed by diusion. It is the purpose of this chapter to give a brief overview over the physics of uid ow on small scales.
2.1. Flows on Small Scales - Fundamentals
2.1.1. General Equation of MotionTo describe the ow of liquids on any scale and without making any assumption on the nature of the uid, the integral form of Newtons second law is a good starting point. Below, the general equation of motion is derived following the line of argumentation given in [14]. The sum of the forces acting on a small volume of uid is related to its change of momentum: d dt <@ @@ @> y V ρÑu dτ=AAA A? y V ρf dτÑ ´¹¹¹¹¹¹¹¹¹¹¹¹¹¹¹¹¹¹¹¸¹¹¹¹¹¹¹¹¹¹¹¹¹¹¹¹¹¹¹¶ volume forces x S σÑn dΣ ´¹¹¹¹¹¹¹¹¹¹¹¹¹¹¹¹¹¹¹¹¹¹¸¹¹¹¹¹¹¹¹¹¹¹¹¹¹¹¹¹¹¹¹¹¹¹¶ surface forces , (2.1) with d
dt representing the Lagrangian derivative in the co-moving frame of reference,ρthe
density of the uid in the element dτ, Ñu the uid velocity, V the volume, Ñf body forces per unit mass acting on the uid element dτ such as gravity and σ the stress tensor including all surface forces caused by pressure and viscous forces acting on a surface elementdΣwith the normal vector Ñn. As any element of uid in this frame of reference by denition contains the same number of molecules,ρdτ is a constant and the left hand side of equation 2.1 reads as:
d dt <@ @@ @> y V ρu dτÑ =AAA A? y V ρd dtu dτÑ (2.2)
Using the Gauss theorem for each componentiof the surface forces, the last term on the right hand side of 2.1 reads as:
<@ @@ @> x S σÑn dΣ=AAA A?i x S σijnjdΣ Gauss y V ∂σij ∂xj dτ (2.3)
with i, j indicating directional components of the vector Ñx x, y, z and Einstein implicit summation over the index j. Thus, for an innitesimal volume element, the equation of motion is derived as:
ρduÑ
dt ρfÑ Ñ© σ (2.4)
Finally, decomposing the components of the stress tensor σ into viscosity termsσij and pressure related termspδij [15]:
σij σij pδij withδij ¢¨¨¦¨¨ ¤ 1 i j 0 ixj Ñ© σ Ñ© σ Ñ©p (2.5)
and using the Lagrangian derivative of the uid velocity Ñu:
duÑ dt
∂uÑ
∂t Ñu Ñ©Ñu (2.6)
the general equation of motion for uids is obtained: ρ∂uÑ
∂t ρÑu Ñ©Ñu ρfÑ Ñ©p Ñ© σ
(2.7)
2.1.2. Navier-Stokes Equation
Using 2.7, the equation of motion for Newtonian liquids, i.e. liquids with a constant viscosity, can be derived. The ith component of the gradient of σ can be substituted by: Ñ© σ i ∂σij ∂xj µ ∂ 2u i ∂xj∂xj ζ µ 3 ∂ ∂xi ∂ul ∂xl (2.8) Ñ© σ µÑ©2uÑ ζµ 3Ñ©Ñ© Ñu ´¹¹¹¹¹¹¹¹¹¹¹¹¹¹¹¹¹¹¹¹¹¹¹¹¹¹¹¹¹¹¹¹¹¹¹¹¹¹¹¹¹¹¸¹¹¹¹¹¹¹¹¹¹¹¹¹¹¹¹¹¹¹¹¹¹¹¹¹¹¹¹¹¹¹¹¹¹¹¹¹¹¹¹¹¹¶ compressibility (2.9) again with Einstein summation over the indices [15]. Here, spatial variations of both viscosity coecients µand ζ are implicitly neglected, which holds true for most liquids. However, spatial variations of these coecients have to be considered when dealing with the ow of inhomogeneous media such as emulsions or suspensions. Limiting the analysis to incompressible liquids, which is typically valid for Newtonian liquids even on the micro-scale, reduces the equation of continuity to:
∂ul
∂xl Ñ© Ñ
u 0 (2.10)
Thus causing the last term in eq. 2.9 to vanish. The Navier-Stokes equation is obtained substituting eq. 2.9 and 2.10 into eq. 2.7 [14,15]:
ρ∂uÑ
∂t ρÑu Ñ©Ñu ρfÑ Ñ©pµÑ©
2uÑ (2.11)
µrepresents the dynamic viscosity. Equation 2.11 represents the balance of forces for an incompressible uid element. The terms on the left represent inertial forces, while the terms on the right include viscous dissipation, pressure gradients and body forces such as gravity. This equation is often considered the basic equation of uidics. Indeed, a lot of physical understanding of the ow of liquids, especially on small scales, can be derived from equation 2.11, provided the uids can still be assumed to be a continuous medium. The latter assumption, however, remains valid in the course of the present work, as all channel dimensions typically remain well above molecular scales.
2.1.3. The Reynolds Number
Before turning back on the simplication of the Navier-Stokes equation specically in-teresting to ows on the micro-scale, the Reynolds Number Re is introduced, that is frequently used to non-dimensionalize the Navier-Stokes equation [14].
Re ρU L
µ (2.12)
withU being a typical velocity andLa characteristic length, respectively. Rerepresents the ratio of convective ux of momentum to diusive ux of momentum and determines the relative importance of uid inertia compared to viscous forces: At low Re viscous forces dominate and thus the emergent ow eld is determined by an equilibrium be-tween viscous dissipation and external forcing, e.g. by an external pressure gradient. In this regime, the ow eld is usually stationary with streamlines regularly spaced relative to each other. Additionally, the ow eld is very stable, as any disturbance is quickly suppressed by viscous dissipation. This regime is called laminar ow. Equation 2.12 illustrates that the laminar regime can be maintained by either increasing the uid vis-cosityµ or decreasing the typical dimension or velocity, keeping Re small. At elevated values ofRe, however, the ow is mainly dominated by inertia. Thus, small disturbances are amplied and the ow eld becomes increasingly chaotic and non-stationary upon increasing the average velocity. This regime is referred to as turbulent ow. For pipe ow, complete turbulence is typically reached for Re O102103. In the course of
the present work and for typical microuidic systemsReis typically O103100, thus
deep within the laminar regime. However, depending on the considered problem, uid inertia might become relevant already in the laminar regime atReO100.
2.1.4. Stokes and Hele-Shaw Approximation
As described above, ows at small scales typically present low Reynolds numbersRe@@
1. In this regime, the Navier Stokes equation 2.11 can be signicantly simplied by
neglecting all inertia terms, i.e.ρ∂∂tÑu ρÑu Ñ©Ñu 0. The result is the Stokes equation,
that describes the ow of viscous uids at lowRe:
ρfÑ Ñ©pµÑ©2uÑ 0 (2.13)
Albeit being much easier to handle than the full Navier-Stokes equation, equation 2.13 is still only numerically solvable in many cases. One special case that can be solved analytically is the so called Hele-Shaw approximation. In this approximation, the liquid ow is conned by two at plates of distance W at y 0 and y W, cf. Fig. 2.1. Thus
y x z
W
umaxFigure 2.1.: Poiseuille ow established between two parallel plates.
the problem reduces to a two dimensional ow problem. The velocity components uy
anduz are neglected. Employing the No-Slip boundary conditionuxy 0, W 0at the
walls, resulting from the friction with the walls and absence of additional body forces, the resulting ow prole is derived from equation 2.13 [14]:
uxy ∂xp 2µ yW y 2 ∂xp 8µ W 2 ´¹¹¹¹¹¹¹¹¹¹¹¹¹¹¹¸¹¹¹¹¹¹¹¹¹¹¹¹¹¹¹¹¶ umax 4y W 4y2 W2 (2.14)
with the plates being aty 0andy W. Equation 2.14 shows a quadraticy-dependence of uxy. Thus the velocity prole between two parallel plates takes a parabolic shape
and is referred to as Poiseuille ow. This well known ow-prole also represents a good approximation for rectangular channels of high aspect ratio [4].
The presented Hele-Shaw approximation is the theoretical foundation for the volume-of-uid simulations used to model the interface between two immiscible phases in Ad-dendum I.
Averaging equation 2.14 results in:
¯
u ∂xpW
2
12µ (2.15)
This relation is often referred to as Darcy's law. From equation 2.15 it can be easily seen, that:
ω rotyu¯ 0 (2.16)
Hereωis the vorticity of the ow. Thus, the ow eld in Hele-Shaw cells is free of vortices [4]. In multiphase ow, however, the situation is changed by the presence of liquid/liquid interfaces, e.g. the interface of droplets of one phase dispersed in another immiscible phase. These interfaces can introduce swirling ows and vortices within droplets that are caused by recirculation due to friction with the channel walls and volume conservation
fluid 1
fluid 2
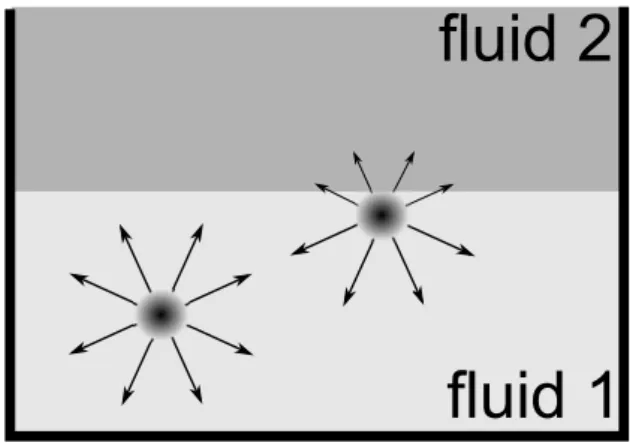
Figure 2.2.: Model explaining the interfacial tension by dierent forces on a molecule in the bulk of a uid or at interfaces.
within the droplet.
2.2. Multiphase Flow and Emulsions
2.2.1. Interfacial TensionThe mathematical description of uid ow derived in equation 2.7 is valid for any liquid owing in any geometry. However, when dealing with mixtures of dierent immiscible liquids, such as emulsions consisting of droplets of a dispersed phase surrounded by a continuous phase, additional forces arise that have to be considered. The origin of these forces is the surface tensionγ, also more precisely referred to as interfacial tension. The origin of the interfacial tension is depicted in Fig. 2.2. Molecules in liquids attract each other, e.g. via van der Waals forces (black arrows). Typically, these forces only range for a few nanometers and strongly depend on the molecules involved [4, 16]. For a molecule in the bulk of uid 1, that is completely surrounded by molecules of the same family, these forces cancel out. For a molecule at an interface, however, a net force directed towards the bulk of uid 1 arises due to the reduced attractive forces towards molecules of the second uid. Thus, being at the interface is energetically unfavorable for molecules. However, volume conservation and the Pauli principle force some molecules towards the interface. As a consequence, immiscible liquids try to minimize their interfacial area, which explains the typically spherical shapes of small liquid droplets provided external forces and gravity are negligible. To create additional interfacial areaA, more molecules have to be transported from the bulk of uid 1 towards the second uid, a process that consumes energy E γA. The interfacial tension counteracting the creation of new interfacial area physically represents a specic surface energy.
2.2.2. Laplace Pressure
A direct consequence of the interfacial tension and the resulting minimization of inter-facial area is an additional pressure contribution within liquid volumes surrounded by another uid. The pressure within a liquid volume surrounded by another liquid will be larger than the pressure in the surrounding medium to compensate for the surface-force generated by interfacial tension. For a liquid volume of arbitrary shape, comparing the work needed to increase the interfacial area with the corresponding work by the counteracting internal pressure ∆p pinpout leads to the Young-Laplace relation:
∆p pinpout γ1
R
1
R (2.17)
with R and R the principal radii of the considered liquid volume interface. ∆p is commonly known as the Laplace pressure. If the liquid volume is not conned by walls or deformed by external forces, it will adopt a spherical shape with radiusR R, which leads to an additional internal pressure of ∆p 2γ~R [14].
2.2.3. Capillary and Weber Number
To characterize the relative importance of surface forces in multiphase systems two more non-dimensionalized numbers will be used in the remainder of this thesis.
The Capillary Number Ca is dened as the ratio of viscous friction and interfacial forces:
Ca µU
γ (2.18)
Note, that besides being a function of the liquid system properties, Ca may depend on the sample geometry via the denition U. Analogous to the denition of the Reynolds Number, U is a typical velocity for the considered problem and µ is a characteristic viscosity. While the average velocity over the entire sample may be low, local velocities might be signicantly higher, e.g. in porous media ow, leading to viscous forces becom-ing relevant locally while the overall Caremains small. This generality leads to a large variety of denitions for many non-dimensional numbers and specically for Ca. In the course of this thesis Ca will be dened in dierent ways depending on the considered physical problem: µ is either chosen to be the viscosity of the dispersed phase within droplets or of the surrounding oily phase. U can represent either the average ow velocity of either phase at a given point or the average traveling velocity of a droplet in a channel, cf. chapters 4 and 5 and Addenda I, II and IV. However, typical values ofCawithin this thesis range fromO104101. Thus interfacial forces typically dominate over viscous
forces for all considered systems, irrespective of the dierent denitions ofCa.
The Weber Number W e compares uid inertia to surface forces and is thus dened by the ratio:
W e ρU
2L
γ (2.19)
Again,W e is typically @1 in the present experiments, which shows that capillarity, i.e.
forces by interfacial tension, dominates also over uid inertia. 2.2.4. Wettability
The wettability of a solid surface by a liquid surrounded by another uid is of massive relevance for many technical applications were a surface is coated by a liquid, e.g. in ink-jet printing, spray coating or photolithography. Whenever three dierent phases meet at a common contact line, interfacial energies will arrange the liquids to the energetically most favorable shapes at constant Laplace pressure, i.e. constant curvature of the free liquid interfaces [17].
To explain the interfacial tension driven organization of uids on a substrate the example of a liquid droplet on a solid substrate, surrounded by a vapor phase will be considered. Nonetheless, the vapor phase can be replaced by a second liquid without any changes of the underlying processes. Depending on the combination of surface energies of the interfaces between solid/vapor γsv, solid/liquid γsl and liquid/vapor γlv, three
dierent fundamental wetting situations can be distinguished, cf. Fig. 2.3. The liquid phase either wets the surface completely by spreading over the entire surface (Fig. 2.3a) or it forms a droplet shaped as a spherical cap (Fig. 2.3b). In the extreme case of non-wetting, the liquid will minimize the contact area with the solid surface by forming a spherical droplet sitting on the surface (Fig. 2.3c).
The macroscopic contact angle θis used to quantify the wettability of a surface by a liquid surrounded by a given uid. This contact angle can be calculated by the Young's construction, provided γsv, γsl and γlv are known, cf. (Fig. 2.3b). A droplet can only
reach its equilibrium shapes once the forces acting on the three face contact line caused by the three interfacial tensions balance. To calculate the equilibrium contact angle θ, the variation of energy needed to displace the contact line by a distanceδxis calculated:
δW γsvγslδxγlvcosθδx (2.20)
Solid Liquid Vapor
Q
=0°
glv0°< <180°
Q
Q
=180°
a) complete wetting
b) partial wetting
c) non-wetting
gsv gsl
Q
Figure 2.3.: Sketches of wetting regimes: a) Complete wetting resulting in a closed liquid lm on the surface. b) Partial wetting: liquid droplets form spherical caps on the surface. c) Non-wetting: liquid minimizes the contact area to the surface by forming a spherical droplet.
obtained:
γsvγsl γlvcosθ (2.21)
For θ 0X the surface is completely wet by the liquid, cf. Fig. 2.3. For all intermediate
values of θ, the surface is partially wet, while for θ 180X the surface is non-wetting for
the given liquid system.
The Young's equation works well on ideal surfaces. However, real surfaces usually present surface roughness or chemical inhomogeneities. Contact lines can become pinned at these surface inhomogeneities, leading to a large scatter in measured contact angles when simply placing a droplet on the surface. To quantify the wettability of real sub-strates the contact angles during advancing θadv and receding θrec of the three phase
contact line have to be measured. This is typically done by inating and deating a droplet on the surface and measuring θ during the process. If the movement of the con-tact line is slow, i.e. Ca@@1andW e@@1, then the droplet is in quasi-equilibrium at all
times andθadv andθrecare independent of the contact line velocity, withθadv Aθrec. The
hysteresis betweenθadv andθrecthen presents a good measure for the surface quality. For
faster moving contact lines, inertia and viscous forces are non-negligible and the dynamic contact angle depends on the contact line velocity.
2.2.5. Surfactants
Interfacial tensions between pure immiscible liquids are typically on the range of several tenth of mN/m. Such large interfacial tensions make it very dicult to control droplet producing instabilities on a micro-scale and to produce monodisperse droplets. Large surface forces destabilize the system and typically lead to random droplet breakup. Fur-thermore, as small droplets are energetically unfavorable due to their high surface to volume ratio, high interfacial tension prevents the production of stable emulsions. Small
O O O OH OH OH sorbitan oleic acid
hydrophobic tail hydrophilic head
a)
b)
Figure 2.4.: a) Molecular structure of the surfactant sorbitane-monooleate (Span80), which is composed of a hydrophilic head (sorbitane) and a hydrophobic tail (oleic acid).
b) Simplied sketch of the amphiphilic structure of surfactant molecules.
droplets will rapidly disappear due to Ostwald ripening, which is caused by the higher Laplace pressure inside of small droplets. Dispersed phase from small droplets will pref-erentially dissolve in the continuous phase and diuse into larger droplets with a smaller Laplace pressure. Additionally, coalescence occurs when two droplets approach each other by thinning and rupture of the liquid lm separating the droplets. At high inter-facial tension, coalescence can occur right at the droplet production site, thus disturbing the droplet production itself. These eects should be avoided when studying droplet generating liquid instabilities as in Chapter 4 and Addenda I and II.
To facilitate a stable droplet production and to stabilize the generated emulsion, a third component called surface active agent, or in short surfactant, is added to the liquids. Surfactants are amphiphilic molecules that are composed of a polar hydrophilic head and a non-polar hydrophobic tail. The tail typically consists of a hydrocarbon chain. Figure 2.4a shows the molecular structure of sorbitane-monooleate (Span80, ABCR), which is the non-ionic surfactant used in all experiments presented in this thesis. In the sketch in Fig. 2.4b the complex molecular structure is simplied reducing the molecule to its head and tail group.
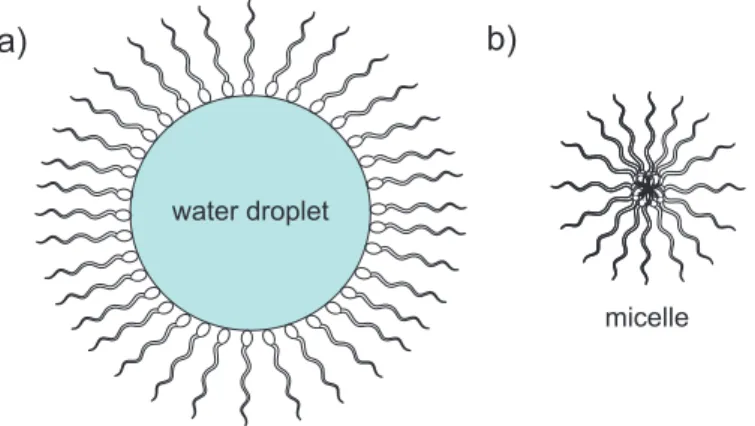
The amphiphilic structure of surfactant molecules causes them to occupy the interface of emulsion droplets, forming a molecular lm with the head groups pointing towards the aqueous phase and the tails pointing towards the oily phase, cf. Fig. 2.5a. By forming this lm, surfactants eectively lower the interfacial tension with increasing surfactant con-centration. Above a certain concentration, the Critical Micellar Concentration (CMC), the maximum solubility of surfactant monomers in the respective solvent is reached. Thus, the interface of emerging droplets is rapidly saturated with surfactant molecules and the interfacial tension plateaus at values of typically a few mN/m [4]. Surfactant molecules that cannot reach the interface will form micelles or inverse micelles as depicted in Fig. 2.5b for a surfactant in an oily solvent. This self assembly process is driven by an increase of the total entropy: surfactant molecules organize to geometrical structures
water droplet
a) b)
micelle
Figure 2.5.: a) Sketch of surfactant molecules covering a water droplet interface with the surrounding oily phase.
b) Sketch of surfactant molecules forming an inverse micelle in a surrounding oily phase.
that prevent the exposure of hydrophilic parts to the oily solvent. However, less solvent molecules need to organize to a cage-like structure surrounding micelles compared to cage-formation by solvent molecules surrounding each surfactant monomer. Thus the overall order of the system decreases. To ensure rapid maximum coverage of droplet interfaces with surfactants, all experiments were performed at a concentration of 2wt%
Span80, well above the CMC.
The presence of surfactants also has a dramatic eect on the contact angle of a droplet of dispersed phase surrounded by another liquid to a solid substrate. Already small concentrations of surfactants are typically sucient to change the wettability of the substrate by the dispersed phase from partial wetting to non-wetting [4] and a small external ow will release the droplet from the surface. Thus, surfactants facilitate the formation of emulsions in microuidic channels by preventing wetting of the channel walls by the dispersed phase, a precondition for the formation of emulsions. The strong eect of surfactants on the wetting characteristics can be understood by using equation 2.21 adapted to an aqueous droplet on a solid surrounded by an oily phase.
cosθ γsoγsw
γwo (2.22)
Here,γso denotes the interfacial energy at the solid/oil interface,γsw at the solid/water
interface and γwo represents the interfacial tension of the water/oil interface. The
sur-factant lowers both γso andγwo signicantly, while the eect onγsw is less pronounced,
provided the surfactant is preferentially soluble in the oily phase. Thus,γsoγswbecomes
negative and the right term in equation 2.22 approaches its minimum, i.e. -1. Adding surfactant considerably increasesθ, causing the water droplet to detach from the surface that is preferentially wet by the oil phase in the presence of surfactant. In the presented experiments, Span80 was chosen because it is preferentially soluble in hydrocarbon
In the course of this chapter the dierent device preparation methods are presented along with the experimental setups used within this thesis. While experimental methods are introduced by the underlying principles, experimental details and results will be given in the relevant chapters.
The selection of the device material is crucial for the design of droplet based microuidic systems due to wettability constraints as described in chapter 2.2.5. Fortunately the large industrial and scientic progress made in the elds of microelectronics and MEMS gave rise to a large variety of microchannel production methods, allowing to select from a plethora of device materials. Softlithography and micromilling, the fabrication methods of choice within the present work, are introduced in Sections 3.1.1 and 3.1.2.
Optical methods were applied to characterize the liquid systems of interest and the ow properties within droplet based microuidic systems. The Pendant Drop Method, em-ployed to measure the interfacial tension between two liquids, is presented in Section 3.2.1. Optical microscopy is used to characterize the shape of liquid interfaces and the behavior of particles inside of droplets. Experimental setups and typical image analysis performed within this thesis are introduced in Section 3.2.2. Finally the optical setup used to char-acterize droplet shapes by uorescence microscopy and ow elds inside of droplets by micro-Particle Image Velocimetry (µPIV) are presented in Section 3.2.3.
3.1. Device Preparation and Liquid Systems
3.1.1. SoftlithographyMany microuidic device preparation methods were originally developed to fabricate three dimensional MEMS-structures such as cavities for pressure or acceleration sensors. A comprehensive review on early micromechanical etching techniques along with early sensor structures and microuidic applications was given by Petersen in 1982 [1]. In the early 1990's these mostly silicon based micro-fabrication techniques became widely used to produce microuidic devices [3, 4]. However, the fabrication of microuidic chips in silicon or glass is tedious, requires expensive cleanroom-technology and involves handling dangerous chemicals. Additionally, clogging of channels by particles or contamination of the channel regularly occur, making disposable and cheap devices desirable. In 1998 Duy et al. introduced a technique named softlithography, which is a fast and low-cost
replication technique producing microchannels in an elastomer substrate [18]. The most widespread polymer, used also in the framework of this thesis, is Polydimethylsiloxane (PDMS). PDMS is a silicon based polymer that is liquid in absence of a curing agent at room temperature, but readily solidies to a transparent elastomer when mixed with the curing agent. PDMS is a good choice for many droplet microuidic systems based on wa-ter in oil (W/O) emulsions as the PDMS-surface is naturally hydrophobic. Additionally, PDMS is highly transparent, which facilitates optical access to the device. Its exibility allows for the fabrication of microchannels on curved surfaces. However, the high ex-ibility of the substrate has to be taken into account for high pressure applications, as channel deformation might occur. This was no issue within the experiments of this thesis. The major disadvantages of PDMS are the high diusivity of many gases and liquids due to the porous molecular structure of the cured elastomer and swelling by a large variety of organic liquids. Both can lead to drainage of liquid from the channel and signicant deformation of the channel cross-section, depending on the channel geometry. However, for the channel geometries and ow rates typically used within this thesis deformation of the channel structure and drainage of liquids did not pose signicant problems.
The choice of the liquid system generally depends on the used device material and on the specic experiment. However, the main components of the liquid systems used within PDMS devices produced by softlithography were the same in all experiments. An aqueous phase was used as the dispersed phase and n-hexadecane (Alfa Aesar) as continuous phase. The viscosity of n-hexadecane is µ 3.3mPas. 2wt.% Span80 were added to
the continuous phase to ensure wetting of the channel walls by the continuous phase and increase emulsion stability. Although n-hexadecane is known to signicantly swell PDMS, no signicant channel deformation was expected and observed within the used channel geometries on experimental timescales [19]. Depending on the aim of the experiment, various particle suspensions or dyes were added to the liquids. A specic description of the used emulsion systems are given in the context of the respective experiment.
Figure 3.1 illustrates the device fabrication process used in the present work. The device layout is created using AutoCAD software (Autodesk). Subsequently, the lay-out is printed on a transparency lm mask with a maximum lateral resolution of 5µm (Micro Lithography Services Ltd). Device fabrication starts by generating a master by standard photolithography. A silicon wafer (Silicon Materials) is spin-coated with nega-tive photoresist of the SU-8 (MicroChem) family. The lm thickness of the SU-8 layer, that determines the channel height of the nal device, can be adjusted by changing the rotational velocity during the spin-coating process and the viscosity of the photoresist. As specied by the manufacturer, SU-8 100 is suitable for lm thicknesses ranging from below100µm to about250µm. SU-8 50 which is less viscous than SU-8 100 and allows for lower lm thickness was used for devices with a channel height of about50µm utilized
in Chapter 5 and Addendum IV. After spin-coating, the resist is soft-baked on a hotplate to improve adhesion to the silicon wafer and to remove remaining solvent (65XC for 10 to
printed transparency film mask
negative resist layer
illumination
developer + postbake
master
molding with PDMS
cure and peel PDMS off the master
seal with glass slide microchannel
Figure 3.1.: Block-diagram of the softlithography process.
15 min and95XC for 45 min). The resist polymers are cross-linked upon illumination with
UV light, rendering it insoluble to the developer solution. UV-illumination is performed in contact with the printed mask using a Model 60DUV/MUV/Near UV exposure tool (ABM Inc.). To improve the cross-linking of the resist polymers, exposure is followed by a post-bake at65XC for 1 min and95XC for 10 min. Subsequently, the sample is bathed in
a developer solution (MR-dev 600, MicroChem) to remove non-cross-linked regions of the resist lm, thus obtaining the master used as a mold in the following steps. Figure 3.2a shows an example of such a master.
The fabrication of the actual microuidic device starts by mixing PDMS base and curing agent (Sylgart184, DowCorning) at a ratio of 10:1 and degassing in a desiccator prior to pouring the PDMS onto the master. After degassing in a desiccator, the PDMS is cured on the master on a hotplate at 65XC for 2 to 3 h depending on the thickness of the PDMS layer. After the PDMS has solidied, the channel region is cut out with a scalpel and peeled o from the master. Holes are punched into the PDMS slap to create uidic inlets and outlets. Subsequently, the PDMS slap and a clean glass slide are plasma treated (Femto, Diener electronic) to activate both the glass and the PDMS surface. An irreversible molecular bond forms upon placing the activated PDMS slap onto the activated glass slide. To ensure an hydrophobic surface, the sealed channel geometry is again placed on a hotplate at150XC for at least 2 h to allow for hydrophobic
recovery of the plasma treated PDMS surface. The elasticity of PDMS allows to directly insert Teon tubing into the inlet and outlet ports punched into the PDMS to create a uidic connection, cf. Fig. 3.2b. However, to further prevent leakage, inlets can be optionally sealed using PDMS or glue (Araldite rapid).
a)
b)
inlets
outlet
Figure 3.2.: a) Silicon mold with channel geometry composed of SU-8 photoresist. b) PDMS chip sealed by a glass slide and connected with Teon tubing. 3.1.2. Micromilling
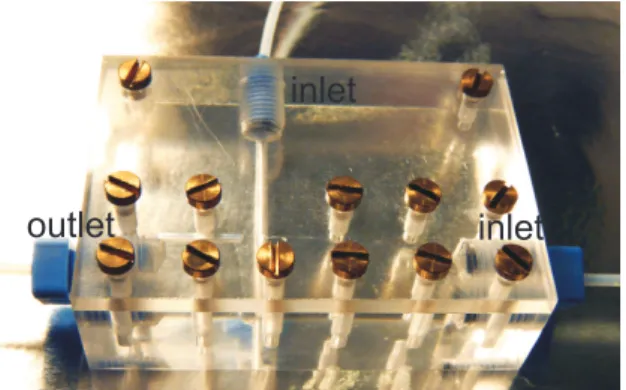
Directly micromilling channel geometries into a solid substrate, e.g. a polymeric material, is a fast and simple option for device production whenever multiple channel depths are required on the same chip. The fabrication of such three dimensional structures by lithographic means is tedious as structuring of multiple layers of photoresist has to be performed. However, micromilling is only suitable for channel geometries with a width typically A150µm and a height A10µm. These constraints have to be considered when creating the channel layout. Polymethylmethacrylate (PMMA) was chosen as the material of microuidic devices that feature a sudden increase in channel depth and height. PMMA is highly transparent, micromachinable and comparatively cheap. The PMMA blocks are micromachined in the workshop of the Physics Department at Saarland University using a Computerized Numerical Control (CNC) milling machine, that is also suitable for drilling and threading the uidic connections. Teon tubing is shaped at one end using a anging tool and connected to the device by plastic ttings (Omnit). Leakage is prevented by placing a rubber O-ring between the anged end of the tubing and the tting. The channels of the PMMA device are sealed by a PMMA sheet that is attached to the PMMA block by metal screws, cf. Fig. 3.3. One major advantage of PMMA compared to PDMS is that PMMA devices are reusable. They can be disassembled and cleaned by rinsing with ethanol, thus making them ideal whenever the same experiment has to be repeated many times using exactly the same channel geometry.
Devices made of PMMA were used with an emulsion system consisting of aqueous solution as dispersed phase and Isopar M (ExxonMobil Chemical) as continuous phase with a viscosity of µ 2.1mPas. Again, 2wt.% Span80 were added to the continuous
phase. The viscosity of the dispersed phase was adjusted by adding glycerol (Sigma Aldrich). A specic description of the used emulsions systems is given in the context of the respective experiment.
inlet
inlet
outlet
Figure 3.3.: Microuidic device machined into a PMMA block and sealed by a PMMA sheet.
3.2. Quantitative Measurements
3.2.1. Pendant Drop Method
The interfacial tensions of the dierent liquid systems used in the present work were determined by the Pendant Drop Method. During the experiment a droplet is produced that is hanging from a needle and surrounded by another liquid of lower density. The droplet is inated to the maximum volume that is achievable before the droplet detaches due to gravity. In this situation, the droplet shape is determined by gravity trying to elongate the droplet and interfacial tension γ counteracting the increase in interfacial area. Note, that the pendant drop method is a static method to determine γ as no liquid ow inuences the measurement. A detailed description of the method is provided by Andreas et al. [20]. The only input parameter needed to determine the interfacial tension γ is the density dierence between the surrounding uid and the droplet phase. The measured droplet shape can then be related to the interfacial tension by comparison to either numerically calculated droplet shapes or experimental measurements taken with a liquid system of known γ [20].
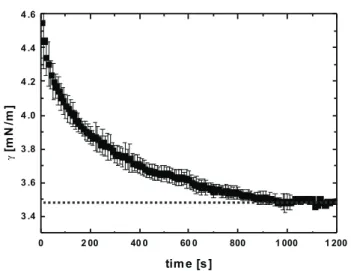
In presence of surfactants, however, the interfacial tension becomes a function of time. Immediately after the droplet has been produced at the needle, the interface is only partially covered by surfactant molecules. Over time, more and more surfactant molecules diuse to the interface reducing γ until the interface is fully decorated and a plateau-value of γ is reached. The pendant drop method allows to measure the time dependent interfacial tension, provided the droplet shape changes slowly and can be assumed to be in quasi-equilibrium at any instant of time. Figure 3.4 shows the example of the evolution ofγ over time for a water droplet immersed in n-hexadecane (Alfa Aesar) with 2wt.% Span80 added to the oil phase. In the remainder of the present thesis, the
interfacial tension is always specied as the plateau value. This is justied as droplet interfaces in microuidic channels have been shown to saturate much faster due to strong convection of surfactants to the interface caused by the ow of the surrounding oil phase
0 2 00 40 0 60 0 800 1 000 1 200 3 .4 3 .6 3 .8 4 .0 4 .2 4 .4 4 .6 g [m N /m ] tim e [s ]
Figure 3.4.: Interfacial tension of water in n-hexadecane with 2wt.% Span80 as a function of time measured by the pendant drop method atT 2425XC. Data are averaged over several measurements, error bars denote standard deviation.
[21].
All measurements in the present thesis were performed at lab temperature T 23 25XC by imaging droplets suspended in a glass cuvette in the respective continuous phase
using an OCA 20 device (DataPhysics). The recorded images were directly analyzed by the corresponding software package SCA 20 (V3.6.02, DataPhysics).
3.2.2. Experimental Setup, Optical Microscopy and Image Analysis
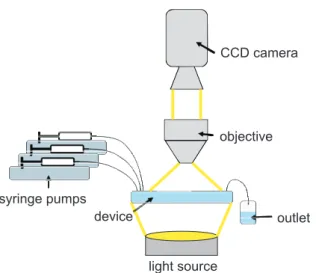
A typical experimental setup for optical microscopy is illustrated in Figure 3.5. The central part is of course the microuidic device, which is connected to gastight glass sy-ringes (Hamilton) by Teon tubing. The sysy-ringes are driven by custom-built, computer controlled syringe pumps that allow to precisely control the volume inux at each inlet. These pumps are controlled via a LabVIEW (National Instruments) interface. To observe and characterize droplet production and ow within a microuidic device, it is placed either on an inverted microscope (AxioVert or AxioObserver Z1 (Zeiss) or MeF3 (Rei-chert and Jung)) or below a macroscope (Z16 (Leica)) equipped with a transmitted light source. Images are recorded in brighteld microscopy using a Charge Coupled Device (CCD) camera (1600 (PCO), Imager pro X (LaVision)) or Complementary Metal-Oxide Semiconductor (CMOS) cameras (1200 hs (PCO) and FastCam SA3 (Photron)), depend-ing on the timescale of the considered experiment. Further image analysis was done usdepend-ing numerical image analysis software (Image J 1.49n (National Institue of Health USA) and Image-Pro Plus 6.3 (Media Cybernetics)). Lateral distances were directly measured from
syringe pumps
device outlet
objective CCD camera
light source
Figure 3.5.: Block-diagram of a typical experimental setup used for the characterization of droplet based microuidic systems.
microscopy images. Droplet frequencies and velocities were calculated from the camera frame rate.
3.2.3. Fluorescence Microscopy and µPIV
Fluorescene Microscopy is an optical microscopy technique that uses selective staining with uorescent dyes (uorophores) to generate the contrast in a sample of interest. When a uorophor molecule is illuminated with light of a certain wavelengthλ, photons of the excitation wavelength increase the molecules energy by lifting an electron from a ground state to a higher state. However, these higher states are not stable and the molecule relaxes back to its ground state emitting another photon within typically a few nanoseconds. The loss of energy due to vibrational relaxation, that transfers the excited electron to lower states without emitting photons is called Stokes Shift. The Stokes Shift allows to separate scattered light from the excitation light source from the uorescence signal of the sample. An in depth review about the underlying physical mechanisms as well as practical hints on optimizing uorescence microscopy setups is given in [22]. Fluorescence microscopy meanwhile is a powerful tool to biologists and bio-physicists, e.g. allowing to selectively stain and observe certain cells in a tissue [23] or even study the self-organization of lipid membranes [24]. More advanced uorescence based imag-ing techniques such as Stimulated Emission Depletion (STED) microscopy even permit to overcome the limitation of resolution of conventional optics as dictated by Abbé's law. STED enables researchers to study the organization of cells, their interior compo-nents and even transport processes on a molecular level. The impact of these imaging techniques on our understanding of the molecular processes within living organisms is expected to be so large, that the inventors of super-resolution uorescence microscopy
received the Nobel Price in Chemistry in 2014 [25].
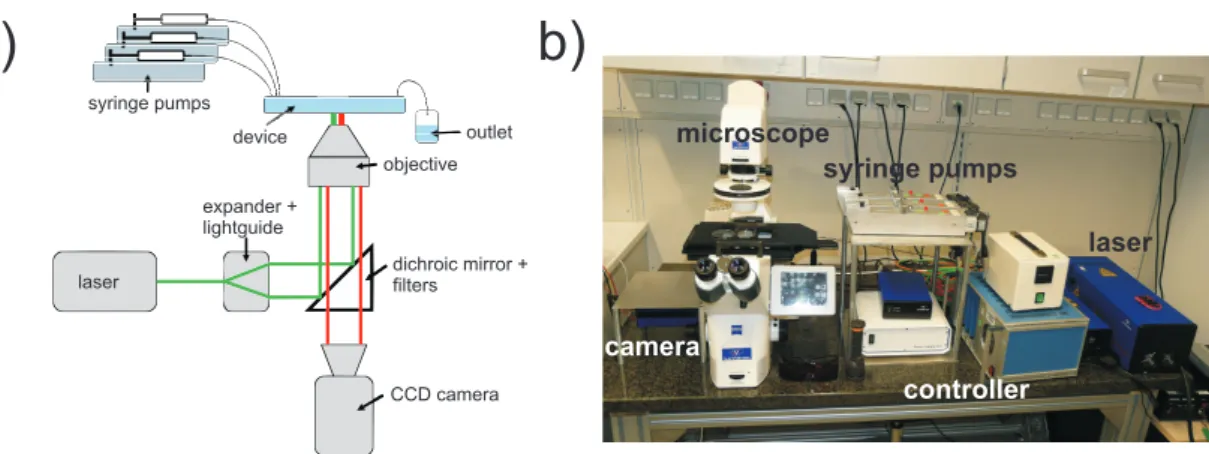
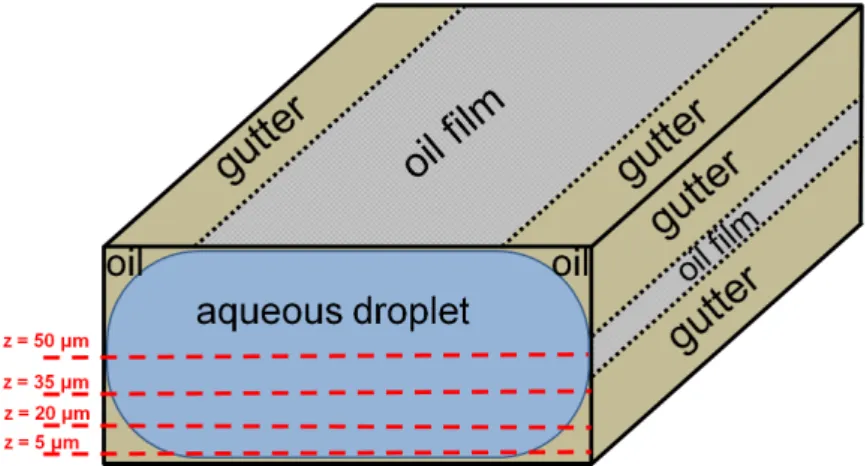
In the course of this thesis, uorescence microscopy was used to characterize the thickness of a uorescently labeled oil layer surrounding an aqueous droplet owing in a microchannel, cf. Chapter 5. The experimental setup used for these measurements is a standard epiuorescence setup illustrated in Figure 3.6. It consists of a computer controlled inverted microscope with a motorized focus system (AxioObserver Z1, Zeiss) equipped with lter cubes containing a dichroid mirror, a laser cut-o lter and an excitation lter (LaVision). The uorescent sample can be excited through the same objective used for image recording by either a green laser (λ 532nm, pulsed DPSS,
2.72 W, LaVision) or a blue laser (λ 473nm, pulsed DPSS, 1.5 W, LaVision) coupled
to the microscope by a multi-mode glass ber. The uorescence signal emitted by the sample is isolated from scattered laser light by the lter cube assembly and recorded by a CCD camera (ImagerPro X 2M, LaVision) coupled to the microscope by a 0.63 x camera adapter (Zeiss).
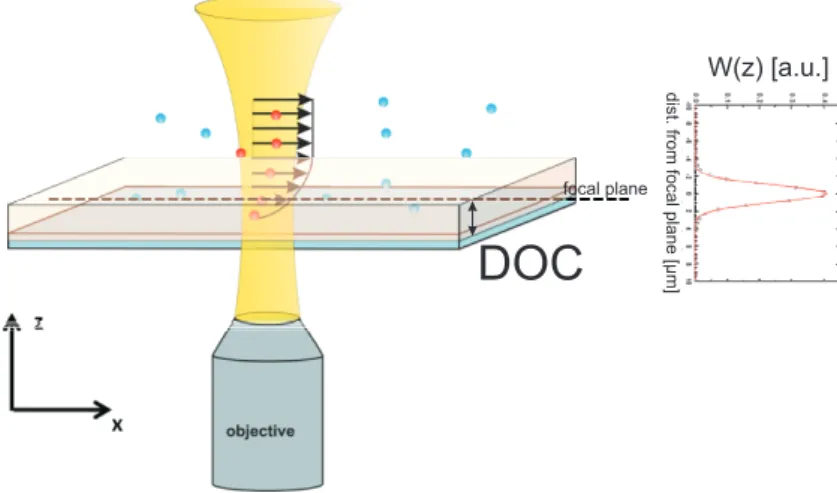
Micro-Particle Image Velocimetry (µPIV) is a non-invasive optical method to measure ow elds within microuidic devices based on uorescence microscopy. The ow is seeded with uorescent tracer particles that are imaged using the optical setup depicted in Figure 3.6. These tracer particles are typically Polystyrene (PS) particles of a diameter ranging between 0.5 and 2µm when measuring ow elds of an aqueous phase. Such particles have been shown to follow the ow of the liquid motion without lagging behind or signicantly alternating the ow eld by their presence [26].
In µPIV experiments, the CCD camera is operated in double-frame mode, which means that the CCD chip is subdivided in an active region and a storage area. This allows for rapid recording of two subsequent frames. The rst frame is shifted from the active region to the storage area immediately after recording. Thus, the CCD is very quickly ready for a second exposure. The storage area is read out by the frame grabber while the second frame is recorded, prolonging the exposure time of the second frame, which can cause a signicant increase of the image background. The big advantage of the double-frame recording mode is the option to record two images with an inter-frame time as low as 150 ns for the camera used, which facilitates tracking of fast objects moving in the sample. Images of these particles are recorded by illumination with two laser pulses synchronized to the end of the exposure of frame 1 and the beginning of frame 2. Thus the laser pulse width eectively determines the image exposure time. Subsequently, a two dimensional ow eld is calculated from the known time interval between the laser pulses and the displacement of a group of particles, which is processed from the double-frames by a cross-correlation algorithm. An in depth description of µPIV is given in Chapter 6 and Addenda V and VI, where the inuence of defocused particles and ow gradients onµPIV measurements is quantied. In the course of this thesis,µPIV is used to characterize the three dimensional ow pattern within elongated droplets moving in
camera microscope syringe pumps controller laser syringe pumps device outlet objective expander + lightguide laser CCD camera dichroic mirror + filters
a)
b)
Figure 3.6.: a) Block-diagram of a typical optical setup used for uorescence microscopy andµPIV. b) Foto of the actual custom built setup from LaVision, Göttingen, Germany.
Filaments upon Release of
Connement
4.1. Emulsication - Overview
The production of droplets surrounded by a typically immiscible continuous phase is obviously the very rst step in every emulsion system. Emulsions are typically formed either by water droplets in an oily phase or vice versa, often stabilized by surfactants, cf. Section 2.2.5. Emulsions are widely used, versatile materials with applications ranging from a simple vinaigrette on salad, elaborate food products to pharmaceutical products and cosmetics. Due to their compound structure and the presence of many liquid/liquid interfaces, the rheology of emulsions can be signicantly altered without changing its liquid components by changing the volume fraction of the dispersed phase, the droplet size or the droplet size distribution. Additionally, monodisperse emulsions can be employed to compartmentalize (bio-)chemical reactions within the controlled volume of individual droplets, an approach oering the potential for massive parallelization of (bio-)chemical analysis [13, 27, 28]. Droplet sizes that can be reached by bulk emulsication methods can be as small as0.1µm. However, the production of droplets by classical bulk methods such as rapid stirring, colloid mills, high pressure valve homogenization or ultrasonic agitation has been shown to result in polydisperse emulsions [29]. This polydispersity is intrinsic to macrosystems exploiting shear induced instabilities for droplet breakup caused by e.g. the occurrence of turbulence and cavitation with spatially varying shear rates and the resistance to secondary breakup of mother droplets varying with droplet diameter, cf. Section 2.2.2.
Membrane emulsication has been developed for bulk production of emulsions with less polydispersity and uses spontaneous droplet formation that occurs when the dis-persed phase is pushed into the continuous phase through pores of a membrane, cf. top left tile of Fig. 4.1. When the dispersed phase leaves the pore, it forms a round droplet in the continuous phase due to interfacial tension [29, 30]. The droplet is released from the pore by the decrease of Laplace pressure in the growing droplet which increases the ow rate of dispersed phase into the droplet. This leads to collapse of the uid thread within the pore when the ow of liquid from the pore into the droplet exceeds the
feed-ing volume ux [31]. Dependfeed-ing on the particular ow rates, shear exerted by the ow of continuous phase can aid the droplet release. The resulting droplet size distribution depends on the size distribution of the pores as well as on the ow rates applied. Using microfabrication techniques, membrane emulsication has been signicantly improved by replacing the porous membrane by precisely manufactured parallel microchannels or per-forated channel walls, thus allowing to produce emulsions with a coecient of variation in droplet diameter @5% [32].
4.2. Droplet Formation in Microuidics
Many microuidic techniques have been developed during the last two decades that ex-ploit the superior control of the local laminar ow intrinsic to microuidic systems to further improve the droplet monodispersity. Droplet sizes achievable with microuidic systems vary from spherical droplets with diameters of typically several microns to elon-gated plugs of millimetric size, while polydispersities as low as a few percent can be reached [5]. However, the improved monodispersity comes on expense of low volume throughput with droplet production frequencies ranging from only a few to several thou-sands of droplets per second. In microuidic devices, droplet breakup typically occurs sequentially, drop by drop, in one single droplet forming unit. Thus, microuidic sys-tems are less interesting for bulk applications of emulsions but rather oer new tools and applications for specialized material synthesis and (bio-)chemical analysis, i.e. droplet based Lab-on-a-Chip systems [5,13,33]. Addendum III presents one example of a droplet based microuidic system exploiting excellent monodispersity and control of the droplet ow for production of mesoporous platinum doped silica particles by an optimized sol-gel synthesis route. The resulting particles feature superior surface area and catalytic activity compared to commercially available particles produced in bulk.
The high technological potential of droplet based microuidic systems has lead to vast engineering and scientic research on microuidic droplet formation devices. Re-cently, some active droplet formation units, that employ external elds or actuation by valves to destabilize liquid laments or jets or to produce drops on-demand, have been proposed [3436]. However, passive droplet formation units are usually much easier to incorporate on-chip and allow to produce continuous streams of monodisperse droplets with controlled spacing. These devices will be treated in the remainder of this sections as passive droplet formation units were employed in all experiments presented within this thesis. Newtonian liquids are used in all experiments and non-Newtonian liquids are consequently not considered in the following. However, viscoelastic eects and shear-thinning in polymer solutions have been recently examined and proven to signicantly impact the droplet breakup process [37,38].
Many dierent device geometries for passive microuidic droplet production have been proposed and characterized, both experimentally as well as analytically and numerically.
Cross-Flow e.g. T-Junction Membrane Emulsification Co-Flow Step-Emulsification disp. phase disp. phase disp. phase disp. phase flow flow flow flow
Figure 4.1.: Dierent droplet breakup systems used to produce emulsions in microuidics. Extensive reviews on droplet breakup in microuidic junctions can be found in literature, cf. among others [5, 12, 3941]. The vast majority of the proposed channel geometries can be grouped as 1) cross-ow, 2) co-ow and 3) step-emulsication droplet formation units, cf. Fig. 4.1. In all these junctions two or more immiscible liquids, driven either by controlling external pressures or volumetric ow rates, are guided into a common main channel where a liquid/liquid interface is formed. The dispersed phase protrudes into the main channel forming either a nger, a jet or a squeezed lament, depending on the particular channel geometries and ow rates. The interface subsequently is deformed by the local ow eld or capillary eects, which amplies free surface instabilities and nally causes the detachment of droplets. Generally, the entire process is characterized by a competition of forces that try to deform the liquid interface and interfacial tension ghting the creation of additional interfacial area. Depending on the relative ow rates of the dispersed and the continuous phase and on physical parameters such as interfacial tension and viscosities, dierent droplet breakup regimes have bee observed in each of the junction families. All presented channel junction geometries are readily character-ized experimentally and can thus be easily calibrated for controlled droplet production. However, a more general understanding of the underlying droplet breakup mechanisms and especially a prediction criterion for the transitions between dierent droplet breakup regimes for each particular geometry is desirable. Similar droplet breakup mechanisms act in all presented systems, however, each of the above mentioned families of droplet
forming junctions has to be studied separately due to geometrical dierences changing the local ow elds and the inuence of connement eects. In the following, the three families of droplet forming junctions are presented in more detail.
4.2.1. Cross-Flow
Cross-ow geometries are typically comprised of two straight channels meeting at a junc-tion at a certain angle. The most common and also the earliest example of a microuidic cross-ow geometry is the T-junction introduced by Thorsen et al. [42], where the dis-persed phase channel perpendicularly enters a main channel transporting the continuous phase, c.f also top right tile of Fig. 4.1. Breakup of the dispersed phase nger invading the main channel either occurs right at the inlet in the dripping and squeezing regime, or further downstream, when both phases initially form parallel ows in the jetting regime.
The dripping regime typically occurs for junctions with a dispersed phase inlet being much smaller than the continuous phase channel width or at low ow rate ratios of the dispersed to the continuous phase Q1~Q2. The nger of dispersed phase invading the main channel is sheared o by the ow of continuous phase before approaching the channel wall opposite of the dispersed phase inlet [5, 12]. Droplet sizes are controlled changing the ow rate of the continuous phase or the viscosity ratio of the liquids [37].
In the squeezing regime, typically occurring in T-junctions with both inlets having comparable dimensions or at low ow rates of the continuous phase, the dispersed phase protrudes far into the main channel and approaches the opposite channel wall. Thus, the ow of continuous phase is hindered which leads to a pressure built-up upstream of the junction. The higher pressure in the continuous phase aids to deform the interface which nally leads to pinch-o of large elongated droplets conned by the channel sidewalls [43,44]. In the squeezing regime, the droplet size can be primarily adjusted by changing the ow rate ratioQ1~Q2 and is largely independent of liquid viscosities and interfacial tension.
In the jetting regime, which occurs at high ow rates of both phases, the pressure at the dispersed phase inlet is large enough to resist deformation of the interface by shear exerted by the continuous phase and a liquid jet of dispersed phase is formed in the main channel. Droplets can be released downstream by growing capillary instabilities breaking the typically cylindrical jet. This breakup process reduces the overall interfacial area and thus the interfacial energy, similar to the classical Rayleigh-Plateau instability at a dripping faucet [45]. If interfacial tension causes the tip of the jet to bulge and grow to the same dimension as the surrounding channel, plugging of the main channel by the tip of the jet additionally promotes droplet breakup, similar to the squeezing regime [46]. Dierent angles of the channel junctions or altered junction geometries present similar droplet breakup behavior [4648]. T-junctions have become widely used in microuidics
due to their relatively simple channel geometry and exibility regarding droplet size and production frequency, as well as ease of fabrication and operation [5,4953]. Accordingly, a T-junction has been used for the production of long, plug like droplets of millimetric length in the squeezing regime in Addendum IV, allowing to vary the droplet length by more than a factor of 10. However, both the monodispersity and production frequency
of droplets can be signicantly improved by more sophisticated channel geometries, as elucidated in the following.
4.2.2. Co-Flow
Another family of junction geometries frequently used for droplet generation are co-ow geometries, cf. lco-ower left tile of Fig. 4.1. The dispersed phase and the continuous phase enter the common main channel as co-owing streams through a set of concentric channels. Similar to T-junctions, co-ow geometries typically show two dierent droplet breakup regimes: 1) the dripping regime at low ow rates with droplet breakup close to the dispersed phase inlet and 2) the jetting regime at higher ow rates where droplet breakup occurs further downstream and a jet of dispersed phase is ejected into the main channel.
Dripping is caused by a competition between viscous drag pushing the droplet down-stream and interfacial forces trying to hold it at the inlet of the dispersed phase. Thus, droplet sizes typically decrease with increasing ow rate of continuous phase Q2.
Jetting, however, has been shown to either occur at increased Q2, where the jet of dispersed phase thins as it moves downstream and decays into small droplets, or at increased ow rates of dispersed phase Q1, where large droplets detach from a jet that grows in diameter along the main channel length [54, 55]. In both jetting cases, droplet breakup is driven by Rayleigh-Plateau type instabilities, but may be additionally aided by a squeezing mechanism when deformations of the jet approach the size of the channel cross-section [56], cf. section 4.2.1. Droplet size can be adjusted changing the ow rate ratio. Thinning jets emerge when the ow of the continuous phase exceeds a critical value where the resulting shear is sucient to overcome the interfacial tension. Thus the dispersed phase is stretched as a thread into the main channel, where it decomposes into droplets. Widening jets, in contrast, are created by the momentum of the dispersed phase at highQ1which acts cooperatively with the viscous drag exerted by the continuous phase to drive the emerging droplet downstream in the main channel. The large velocity dierence between both phases creates shear acting on the interface, that causes the jet to widen in diameter. Depending on Q1, interfacial tension completely or partially pulls the jet back towards the dispersed phase inlet after droplet pinch-o and the droplet production cycle restarts.
Whether a jet of dispersed phase in a co-owing system will decay into droplets or will remain stable in the entire microchannel largely depends on connement [56, 57].