J.
Stat.
M
ech.
(2007)
P06010
ournal of Statistical Mechanics:
An IOP and SISSA journalJ
Theory and Experiment
Ranking scientific publications using a
model of network traffic
Dylan Walker
1,2, Huafeng Xie
2,3, Koon-Kiu Yan
1,2and
Sergei Maslov
21 Department of Physics and Astronomy, Stony Brook University, Stony Brook, NY 11794, USA
2 Department of Condensed Matter Physics and Materials Science, Brookhaven National Laboratory, Upton, NY 11973, USA
3 New Media Lab, The Graduate Center, CUNY, New York, NY 10016, USA E-mail: [email protected],[email protected],[email protected]
[email protected] Received 27 December 2006 Accepted 24 May 2007 Published 14 June 2007 Online atstacks.iop.org/JSTAT/2007/P06010 doi:10.1088/1742-5468/2007/06/P06010
Abstract. To account for strong ageing characteristics of citation networks,
we modify the PageRank algorithm by initially distributing random surfers exponentially with age, in favour of more recent publications. The output of this algorithm, which we call CiteRank, is interpreted as approximate traffic to individual publications in a simple model of how researchers find new information. We optimize parameters of our algorithm to achieve the best performance. The results are compared for two rather different citation networks: all American Physical Society publications between 1893 and 2003 and the set of high-energy physics theory (hep-th) preprints. Despite major differences between these two networks, we find that their optimal parameters for the CiteRank algorithm are remarkably similar. The advantages and performance of CiteRank over more conventional methods of ranking publications are discussed.
Keywords: network dynamics, new applications of statistical mechanics,
communication, supply and information networks
J.
Stat.
M
ech.
(2007)
P06010
Contents 1. Introduction 2 2. Results 3 3. Discussion 7 Acknowledgments 10 References 10 1. IntroductionDue to their rapid growth and large size, many information networks have become untenable to navigate without some sort of ranking scheme. This is particularly evident in the example of the World Wide Web, a network of pages connected by hyperlinks. A successful solution to the problem of ranking the Web is Google’s PageRank algorithm [1]. Another class of information networks that could benefit from such a ranking method are citation networks. These networks are comprised of scientific publications connected by citation links.
Current methods of ranking publications based on the total number of citations received are rather crude. They are too ‘democratic’ in treating all citations as equal and ignoring differences in importance of citing papers. One of the advantages of Google’s PageRank algorithm is that it implicitly accounts for the importance of the citing article in a self-consistent fashion. Authors of [2] proposed using the PageRank algorithm to improve the formula used to calculate the impact factor of scientific journals. In [3] some of us directly applied this algorithm to individual papers published in all American Physical Society journals. This allowed us to discover a set of highly influential papers (‘scientific gems’) that would be undervalued based on just their number of citations. However, there exist significant differences between the World Wide Web and citation networks that suggest a modification of the original PageRank algorithm. The most important difference is that, unlike hyperlinks, citations cannot be updated after publication. This makes ageing effects [4,5] in citation networks much more pronounced than in the WWW. The other consequence is the inherent time-arrow present in the topology of citation networks, due to the constraint that, at the time of publication, a paper may only cite earlier works. This significantly alters the spectral properties of the adjacency matrix which lie at the heart of the PageRank algorithm. In particular, the absence of directed loops means that the adjacency matrix can have only zero eigenvalues.
The success of the PageRank algorithm can be attributed, in part, to its ability to capture the behaviour of people randomly browsing the network of web pages. Indeed, the PageRank of a given web page can be interpreted as the predicted traffic (quantified, for example, by the rate of downloads) for that page if every WWW user follows a random path of (on average) 1/α hyperlinks starting from a randomly selected webpage. The assumption that a typical web surfer starts at a randomly selected webpage might be not completely unreasonable for the WWW, but it needs to be modified for citation networks.
J.
Stat.
M
ech.
(2007)
P06010
As all of us know, researchers typically start ‘surfing’ scientific publications from a rather
recent publication that caught their attention on a daily update of a preprint archive, a recent volume of a journal or, perhaps, was featured in a news article in the popular media. Thus a more realistic model for the traffic along the citation network should take into account that researchers ‘surfing’ the citation network preferentially start their quests from recent papers and progressively get to older and older papers with every step.
In this work we introduce the CiteRank algorithm, an adaptation of the PageRank algorithm to citation networks. Our algorithm simulates the dynamics of a large number of researchers looking for new information. Every researcher, independent of one another, is assumed to start his/her search from a recent paper or review and to subsequently follow a chain of citations until satisfied or saturated with information. Explicitly, we define the following two-parameter CiteRank model of such a process, allowing one to estimate the traffic Ti(τdir, α) to a given paper i. A recent paper is selected randomly from the whole population with a probability that is exponentially discounted according to the age of the paper, with a characteristic decay time of τdir. At every step of the path, with probability α the researcher is satisfied/saturated and halts his/her line of inquiry. With probability (1−α) a random citation to an adjacent paper is followed. The predicted traffic, Ti(τdir, α), to a paper is proportional to the rate at which it is visited (downloaded) if a large number of researchers independently follow such a simple-minded process.
While we interpret the output of the CiteRank algorithm as the traffic, its utility ultimately lies in the ability to successfully rank publications. High CiteRank traffic to a publication denotes its high relevance in the context of currently popular research directions, while the PageRank number is more of a ‘lifetime achievement award’ [3]. It is fruitful to compare the CiteRank traffic to a paper,Ti, with the more traditional method
of ranking publications, the number of citations received. Indeed, the two are highly correlated; a result easily understood on the basis that the larger the number of citations a paper has, the more likely it will be visited by a researcher via one of the incoming links. However, the more refined CiteRank algorithm surpasses the conventional ranking, by number of citations, in its characterization of relevancy on two accounts:
• Like the original PageRank algorithm [1,2], in CiteRank, the popularity of papers is calculated in a self-consistent fashion: the effect of a citation from a more popular paper is greater than that of a less popular one. A citation from a paper that is ‘highly visible’ will contribute more to the visibility of the cited paper.
• The age of a citing paper is intrinsically accounted for: the effect of a recent citation to a paper is greater than that of an older citation to the same paper. New citations indicate the relevancy of a paper in the context of current lines of research.
2. Results
An algorithmic description of the aforementioned model can be understood as follows. The transfer matrix associated with the citation network is
Wij = ⎧ ⎨ ⎩ 1 kout j if j cites i; 0 otherwise,
J.
Stat.
M
ech.
(2007)
P06010
where koutj is the out-degree of the jth paper. Let ρi represent the probability of initially
selecting the ith paper in a citation network:
ρi = e−agei/τdir. (1)
The probability that the researcher will encounter a paper by initial selection alone is given by ρ. Similarly, the probability of encountering the paper after following one link is (1 −α)W · ρ. The CiteRank traffic of the paper is then defined as the probability of encountering it via paths of any length. That is, given an initial distribution of new papers, ρ, and transfer matrix, W, the CiteRank traffic is given by:
T =I·ρ+ (1−α)W·ρ+ (1−α)2W2·ρ+· · ·. (2) Practically, we calculate the CiteRank traffic on all papers in our dataset by taking successive terms in the above expansion to sufficient convergence (<10−10 of the average value).
In order to assess the viability of this ranking scheme and to select optimal parameters (τdir, α), we need a quantitative measure of its performance on real citation networks. Two real citation networks are evaluated:
• Hep-th: An archive snapshot of the ‘high energy physics theory’ archive (http://arxiv.org/archive/hep-th) from April 2003 (preprints ranging from 1992 to 2003). This dataset, containing around 28 000 papers and 350 000 citation links, was downloaded from [6]. We know the actual date of appearance of each of the entries in the preprint archive and thus the age of each node is known with the resolution of 1 day.
• Physrev: Citation data between journals published by the American Physical Society4. This dataset contains around 380 000 papers and 3100 000 citation links.
We know only the year in which each paper was published and it ranges from 1893 to 2003.
Of course, evaluating the performance of any ranking scheme is a delicate, but often necessary, matter. One way to select the best performing α and τdir is to optimize the correlation between the predicted traffic,Ti(τdir, α) and the actual traffic (e.g. downloads). Unfortunately, the actual traffic data for scientific publications are not readily available for these networks. However, it is reasonable to assume that traffic to a paper is positively correlated with the number of new citations it accrues over a recent time interval, Δkin.
For lack of better intuition we first assume a linear relationship between actual traffic and number of recent citations accrued. This corresponds to a simple-minded scenario in which every researcher downloading a paper will, with a certain small probability, add it to the citation list of the manuscript he/she is currently writing. It should be noted that we make no attempt to model network growth in this paper.
In order to compare CiteRank with actual citation accrual, we constructed an historical snapshot of both networks used in this study. In both cases, the most recent 10% of papers are pruned from the network. This corresponds to the last 4 years (2000–2003) 4 The APS journals include Phys. Rev. Series I (1893–1912), Phys. Rev. Series II (1913–1969), and Phys. Rev. Series III (1970–present). This latter series includes the five topical sections: Phys. Rev. A, B, C, D and E (the latter from 1990 to the present). Also included are Phys. Rev. Lett., Rev. Mod. Phys. and Phys. Rev. Special Topics, Accelerators and Beams (1998–present).
J.
Stat.
M
ech.
(2007)
P06010
2 4 6 8 10 0.2 0.4 0.6 0.8 1 τdir(year) α B 2 4 6 8 10 0.2 0.4 0.6 0.8 1 0.2 0.3 0.4 0.5 0.6 0.2 0.4 0.6 AFigure 1. The Pearson (linear) correlation coefficient between the number of recent citations accrued (Δkin) and CiteRank traffic (Ti) is calculated over the
parameter space of the CiteRank model for the Hep-th (A) and Physrev (B) network. Both networks exhibit peaks in correlation coefficient in the α-τdir plane. The highest correlation is achieved for α = 0.48, τdir = 1 year in the Hep-th network andα= 0.50,τdir= 2.6 years in the Physrev network.
in the Physrev network and last 1 year in the Hep-th network. The CiteRank traffic, Ti,
of the remaining 90% of the papers is then evaluated and correlated with their actual accrual of new citations, Δkin, originating at the most recent 10% of papers.
It is important to note the qualitative and quantitative differences between the two citation networks considered. The Physical Review citation network (Physrev) is comprised of a large number (∼400 000) of peer-reviewed publications acquired over a period close to 100 years. The high-energy physics archive citation network (Hep-th) is completely comprised of a much smaller number (∼28 000) of electronically submitted publication preprints, with no associated form of peer review. Despite these significant differences in the nature of the networks considered, the general features of their correlation contours are outstandingly similar. In both cases, a single sharp peak in correlation is evident for particular values of the parameters. The value of the optimal parameters for both networks are:
• hep-th: α= 0.48,τdir= 1 year
• physrev: α= 0.50,τdir= 2.6 years.
Remarkably, the value ofαis nearly the same for the rather different networks considered and is in agreement with that proposed in [3] on purely empirical grounds. The difference in optimal parameter τdir for these networks is in agreement with the commonsense expectation of faster response time (and hence faster ageing of citations) in preprint archives compared to peer-reviewed publications. Another feature of figure 1 is that, in both networks, large values of the correlation coefficient are concentrated along a diagonally positioned ridge. In other words, the best choice of α for a given τdir seems to rise linearly with τdir, a behaviour that will be revisited later in this text.
J.
Stat.
M
ech.
(2007)
P06010
τdir(year) α B α A 0.45 0.35 0.4 0.5 0.55 0.55 0.45 0.5 0.6 2 4 6 8 10 2 4 6 8 10 0.2 0.4 0.6 0.8 1 0.2 0.4 0.6 0.8 1Figure 2. The Spearman rank correlation coefficient between recent citations accrued (Δkin) and CiteRank traffic (Ti) for the Hep-th (A) and Physrev (B)
network. Both networks exhibit similar behaviour. There are more extended regions of good correlation relative to the linear correlation contours of figure1. This broadening is expected as a consequence of the more relaxed correlation measure. The highest rank correlation occurs for α = 0.31, τdir = 1.6 years, in the Hep-th network andα= 0.55,τdir= 8 years, in the Physrev network.
While the correlation contour plots shown in figure 1 are a promising indication that the CiteRank model of traffic with optimized parameters provides a good zero-order approximation to the actual traffic along a citation network, they are, to some extent, predicated on the assumption of a linear relationship between actual traffic and Δkin. One might readily ask how this model fares in the absence of such an assumption. While the assumption of a linear relationship may be unreasonable, a positive, monotonic relationship between these quantities is certainly expected. There is a statistical correlation method precisely adapted for such a situation, namely, the Spearman rank correlation. Under this relaxed correlation measure, only the rank ofTi is
correlated with the rank of Δkin. Numerical changes inTi that do not lead to reordering
have no effect on the value of the rank correlation coefficient. Another rationale for using rank correlations is that our ultimate goal is ranking publications, not modelling the traffic. Thus, we are currently not interested in individual Ti’s, but only in their relative
values. Spearman correlation contour plots are constructed for both networks and shown in figure 2. The optimal values for both networks are:
• hep-th: α= 0.31,τdir= 1.6 year
• physrev: α= 0.55,τdir= 8 years.
These results roughly confirm the prediction of α ∼ 0.5 from figure 1: however, there is a more appreciable discrepancy in τdir between linear and rank correlation for both networks.
J.
Stat.
M
ech.
(2007)
P06010
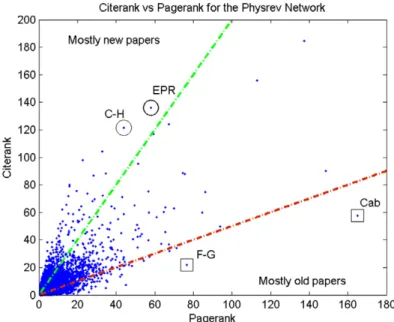
Figure 3. The scatter plot of CiteRank versus PageRank for all papers in the Physrev network. Two sectors of the data are distinguished according to the CiteRank to PageRank ratio: CR/PR > 2 (above the dashed green line) and CR/PR < 1/2 (below the dashed red line). The average publication year of papers in these sectors is 2000 and 1973, respectively. The sophistication of CiteRank goes beyond simple age classification, however. Particular examples that illustrate this sophistication are marked above and discussed in the main body of the text.
3. Discussion
A qualitative examination of CiteRank performance over the unmodified PageRank algorithm can be accomplished by direct comparison on the networks in question. As an example of this, the scatter plot of CiteRank versus PageRank for all papers in the Physrev network is shown in figure3. The positive correlation between the two algorithms is clearly evident in the plot. Two sectors of the data are distinguished according to the ratio of CiteRank to PageRank, CR/PR. Papers with a relatively large (small) ratio have been marked comparatively higher (lower) by the ageing effects inherent to the CiteRank algorithm. These sectors are distinguished in figure 3 above (below) the dashed green (red) line, respectively. In accordance with our claim that the CiteRank algorithm ranks papers of current relevance in research higher, the average publication year of papers in the high-(low-) ratio sector is found to be 2000 (1973). Of course, CiteRank is more sophisticated than a simple re-ranking according to publication age. For one thing, recent citations contribute greatly to a paper of any age. A particularly good example of this is the famous 1935 Einstein, Podolsky and Rosen (EPR) paper [8] which receives both a large CiteRank and CR/PR ratio despite its age. A quick glance at citing papers reveals approximately fifty citations to this paper throughout this year (2007) alone, indicating its clear connection to current lines of research. Another notable example of a publication in the high-ratio sector is a review paper of out-of-equilibrium pattern formation [9] by
J.
Stat.
M
ech.
(2007)
P06010
Cross and Hohenberg (C–H). It has a high ratio, despite being significantly older than papers in this sector. This paper is a good example of a class of review papers that serve to summarize the state of affairs regarding a particular topic that is of continuing interest to research. They are clearly of great use to the modern researcher and thus obtain their high CR/PR by virtue of recent citations. Of further interest are papers that received high PageRank (lifetime achievement) but have a relatively low CR/PR ratio. The wealth of these papers cover undeniably fundamental advancements in physics. Two explicit examples of this are the Feynman and Gell-Mann paper on Fermi interactions [11] (F–G) and the well known Cabibbo paper on leptonic decay (Cab) [10]. The low CR/PR of these papers can be explained by a dearth of recent citations, which in turn is likely due to the incorporation of fundamental discoveries and advancements into textbooks and other published works that include more recent developments, in addition to historical context. A better physical understanding of the sophistication of the CiteRank algorithm may be gleaned from a simple quantitative analysis of the traffic dynamics in terms of its parameters. In both panels of figure 1, over a broad range of parameters, the optimal value of α(τdir) for a given value of τdir is positively correlated with τdir. This is an indication that these two parameters are entangled. In fact, this is to be expected as it is some admixture of the two parameters which leads to the exposure of a given paper to the researcher. An intuitive picture of this entanglement can be understood in terms of the penetration depth, which is a measure of how far back in time a random surfer following the rules of the CiteRank algorithm is likely to get. The penetration depth is affected by bothτdir—the average age of the initial paper at which he/she started following the chain of citations—and 1/α—the mean number of steps on this chain of citations. For smallτdir and largeα, the penetration depth is small, implying that only very recent papers receive traffic. On the other hand, for large τdir and small α, the penetration depth is very large, indicating that most of the traffic is directed towards older papers.
To better understand howαandτdirinfluence the age distribution of CiteRank traffic, we performed the following quantitative analysis. Let Ttot(t) denote the CiteRank model traffic to papers written exactlytyears ago, where the meaning of the additional subscript shall be made clear in the lines that follow. As described by equation (2), two distinct processes contribute to Ttot(t). The first is the ‘direct’ traffic Tdir(t) due to the initial selection of papers in this age group, which is proportional to exp(−t/τdir).5 The second is the ‘indirect’ trafficTind(t) arriving via one of the incoming citation links, which is given by
Tind(t) = (1−α)
t
0 Ttot(t)Pc(t, t) dt, wherePc(t, t) is the fraction of citations originating from papers of age t that cite papers of age t. It should be noted that Pc(t, t) is an
empirical distribution and, as such, is ameasured property of the citation network under consideration. The integral takes into account the fact that incoming links to papers of age
tcan originate from all possible intermediate times. According to [5] and our own findings,
Pc(t, t) is reasonably well approximated by the exponential form (1/τc) exp(−(t−t)/τc).
Taking the Fourier transform of the equation Ttot(t) =Tdir(t) +Tind(t), we have
Ttot(ω) =Tdir(ω) + (1−α)Ttot(ω)Pc(ω). (3)
5
Precisely speakingTd(t) in the CiteRank model is given byNp(t)—the number of papers of aget—multiplied by
the exponential probability of selection exp(−t/τdir). SinceNp(t) itself often has an approximately exponential
form with time constantτp,τdirused in the following equations should be ‘renormalized’ to ˜τdir=τdir·τp/(τp+τdir).
However,τpis usually rather large (∼28 years in the PhysRev network). Thus, except for very large τdir’s this
J.
Stat.
M
ech.
(2007)
P06010
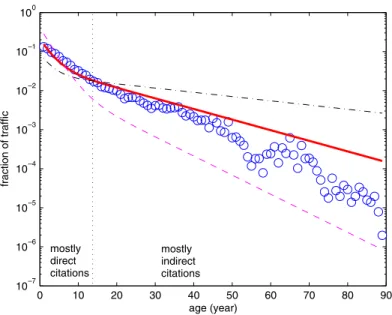
0 10 20 30 40 50 60 70 80 90 10–7 10 –6 10 –5 10 –4 10 –3 10 –2 10 –1 100 age (year) fraction of traffic mostly direct citations mostly indirect citationsFigure 4. The age distribution of newly accrued citations Δkin (blue) for the Physrev network. Theoretical predictions (4) for the CiteRank traffic are calculated for the optimal τdir= 2.6 and three values ofα= 0.2 (dotted–dashed line), 0.5 (thick solid line) and 0.9 (dashed line). In agreement with figure1, the optimal value, α = 0.5, provides the best agreement with Δkin. All curves are normalized so that the sum of all data points is equal to 1.
Solving equation (3) and taking the inverse Fourier transform, yields
Ttot(t)∼(τc −τdir) exp(−t/τdir) + (1−α)τdirexp(−αt/τc). (4)
Thus, the traffic arriving at the subset of papers of age t is given by the superposition of two exponential functions.
Having an approximate analytical expression for Ttot(t), we are now in a position to better understand what determines the optimal values of α and τdir. Figure 4 shows the age distribution of the number of recently acquired citations, Δkin, for papers in the Physrev dataset. The approximate CiteRank traffic, given by equation (4), is also displayed. It is calculated using the empirically determined value τc = 8 years, optimal
τdir= 2.6 years and three values of α= 0.2,0.5 and 0.9. As one would expect, the profile of Δkin versus t best agrees with the CiteRank plot for the optimal value α = 0.5.6 Figure4also provides some clues to the positive correlation between near-optimal choices of α and τdir, visible as diagonal ‘ridges’ in figures 1(A) and (B). Indeed, if the value of
α is chosen to be large, the contribution from the second term is diminished; the use of a larger value of τdir could partially compensate for the loss of CiteRank traffic to older papers, and would thus be in reasonably good agreement with the Δkin data.
Another encouraging observation is that, like equation (4), the age distribution of recently acquired citations shown in figure4has two regimes characterized by two different decay constants of about 5 and 16 years, with a crossover point aroundt= 15 years. Our 6 The apparent disagreement in the tail involves profound dips due to World War II and I [5], which of course cannot be explained by any theoretical model.
J.
Stat.
M
ech.
(2007)
P06010
interpretation of this fact is that papers are found and cited via two distinct mechanisms: researchers can either find a paper directly or by following citation links from earlier papers. For each of these mechanisms, the probability that a given paper is found decays with its age but the characteristic decay time for the direct discovery is shorter. While very recent papers, especially the ones altogether lacking citations, are for the most part discovered directly, older papers are mostly discovered by following citation links.
The optimal values of α in the two very different citation networks considered are remarkably close to each other. In both cases it appears that, on average, the length of chains of citations followed by a typical researcher is close to 1/α 2. Since this chain includes the original starting point (the paper from which the researcher started his quest), the length of around 2 means that the average cited paper is just one link away from the starting point. This raises a disconcerting possibility that many of the papers cited in any given manuscript are not read by the authors but instead their citations are copied from other papers they know. Sadly, this was recently proven to be a very common scenario [7].
Acknowledgments
Work at Brookhaven National Laboratory was carried out under Contract No. DE-AC02-98CH10886, Division of Material Science, US Department of Energy. We are extremely grateful to Mark Doyle, Marty Blume and Paul Dlug from the Physical Review Editorial Office for providing us with the APS citation data used in this work.
References
[1] Brin S and Page L, 1998Comput. Netw. ISDN Syst.30107
[2] Bollen J, Rodriguez M A and Van de Sompel H, 2006Preprintcs.DL/0601030 [3] Chen P, Xie H, Maslov S and Redner S, 2006Preprintphysics/0604130
[4] De Solla Price D J, 1965Science149510(The PDF-file of this pioneering study can be downloaded e.g. fromhttp://garfield.library.upenn.edu/papers/pricenetworks1965.pdf)
[5] Redner S, 2005Phys. Today 5849[physics/0407137]
[6] This hep-th dataset was used in the KDD Cup 2003, a knowledge discovery and data mining competition, and can be downloaded from their websitehttp://www.cs.cornell.edu/projects/kddcup/
[7] Simkin M V and Roychowdhury V P, 2003Complex Syst.14269 [cond-mat/0212043]
[8] Feynman R P and Gell-Mann M,Can quantum-mechanical description of physical reality be complete?, 1935Phys. Rev.47777
[9] Cross M C and Hohenberg P C,Pattern formation outside of equilibrium, 1993Rev. Mod. Phys.65851 [10] Cabibbo N,Unitary symmetry and leptonic decays, 1963Phys. Rev. Lett.10531