Cornell University School of Hotel Administration Cornell University School of Hotel Administration
The Scholarly Commons
The Scholarly Commons
Working Papers School of Hotel Administration Collection
4-2017
Customer Concentration and Cost Structure
Customer Concentration and Cost Structure
Hsihui ChangDrexel University
Curtis M. Hall
Drexel University
Michael Paz
Cornell University, [email protected]
Follow this and additional works at: https://scholarship.sha.cornell.edu/workingpapers Part of the Finance and Financial Management Commons
Recommended Citation Recommended Citation
Chang, H., Hall, C. M., & Paz, M. T. (2015). Customer concentration and cost structure. [Electronic version]. Retrieved [insert date], from Cornell University, School of Hospitality Administration site:
http://scholarship.sha.cornell.edu/workingpapers/9
This Working Paper is brought to you for free and open access by the School of Hotel Administration Collection at The Scholarly Commons. It has been accepted for inclusion in Working Papers by an authorized administrator of The Scholarly Commons. For more information, please contact [email protected].
If you have a disability and are having trouble accessing information on this website or need materials in an alternate format, contact [email protected] for assistance.
Customer Concentration and Cost Structure Customer Concentration and Cost Structure
Abstract Abstract
This study examines the effects of customer concentration levels on firm cost structure decisions. Analyzing cost data from a sample of manufacturing firms from 1976 through 2013, we find a negative relationship between customer concentration and cost elasticity whereby firms exhibit lower proportions of variable-to-fixed costs in the presence of higher levels of customer concentration. Additionally, we find that greater customer bargaining power, proxied by supplier industry competition and product market fluidity, leads to lower cost elasticity as customer concentration becomes greater. These results are robust to alternate specifications as well as controlling for endogeneity using a two-stage model. Our results suggest that suppliers respond to customer concentration by pursuing increased mutual dependence and cooperation with customers rather than attempting to reduce the effect of power imbalances within the supplier-customer relationship.
Keywords Keywords
customer concentration, cost structure, cost elasticity, bargaining power
Disciplines Disciplines
Finance and Financial Management
Comments Comments
Copyright held by the authors.
0
Customer Concentration, Cost Structure, and Performance
Hsihui Chang
KPMG Professor of Accounting LeBow College of Business
Drexel University Philadelphia, PA 19104
[email protected] Curtis M. Hall* Assistant Professor LeBow College of Business
Drexel University Philadelphia, PA 19104
[email protected] Michael T. Paz Assistant Professor School of Hotel Administration S.C. Johnson College of Business
Cornell University Ithaca, NY 14850 [email protected]
Last revised: April 2017
* Corresponding Author
The authors would like to thank Rajiv Banker, John Barrios, Jeffery Callen, Eddy Cardinaels, Craig Chapman, Clara Xiaoling Chen, Agnes Cheng, Leslie Eldenburg, Shunlan Fang, Susanna Gallani, Itay Kama, Ranjani Krishnan, Eva Labro, Jacob Miller, Rui Shen, Kam-Ming Wan, Dan Weiss, two anonymous reviewers, and seminar participants at Hong Kong Polytechnic University, Kent State University, National Chung Hsing University, National Taipei University, Peking University, the 2014 PhD Project ADSA Conference, 2014 Temple Accounting Conference, and 2015 AAA MAS Midyear Meeting for their valuable feedback.
1
Customer Concentration, Cost Structure, and Performance Abstract
We examine how suppliers’ relationship-specific cost structure decisions affect future performance. We argue that suppliers can avoid risk by choosing more flexible cost structures (less fixed-to-variable costs) or commit resources by choosing more rigid cost structures (more fixed-to-variable costs). Analyzing cost data from a sample of manufacturing firms, we document that suppliers with greater customer concentration make relationship-specific investments with less flexible cost structures. Our primary findings suggest that suppliers making relationship-specific investments with more flexible cost structures outperform those with more rigid ones. We also find that, while suppliers’ competitive environment has no effect on the relative profitability of their relationship-specific cost structure decisions, suppliers in more competitive industries make less flexible relationship-specific investments, further exacerbating the risk associated with higher customer concentration. Our results suggest that a risk avoidance strategy outperforms a commitment strategy in the context of relationship-specific cost structure decisions.
JEL: M41; L25.
2
I. Introduction
Understanding the effect of customer concentration on firms’ decisions has become increasingly important for both researchers and practitioners as customer bases become more concentrated. Transaction cost economics (TCE) predicts that firms with greater customer concentration are likely to make more relationship-specific investments in an effort to decrease the customer’s cost of buying from the supplier relative to the customer making the product themselves or buying from another supplier. These relationship-specific investments will exhibit different proportions of fixed-to-variable costs depending on managers’ cost structure decisions. More rigid (i.e. less flexible) cost structures, those with higher proportions of fixed-to-variable costs, allow firms to generate higher profits when sales are strong, but result in lower profits when sales are weak. Thus, the quality of managers’ relationship-specific cost structure decisions depends on their ability to accurately gauge the benefits and risk associated with making these investments.
In this study, we examine how supplier firms’ relationship-specific cost structure decisions affect future performance. We focus on firms’ cost structure decisions because they are one of the most important strategic choices that managers make as they directly affect current and future profitability (Holzhacker, Krishnan, and Mahlendorf 2015a). Traditional wisdom in managerial accounting suggests that managers choose more flexible (higher proportion of variable-to-fixed costs) cost structures when they face greater risk (Garrison, Noreen, and Brewer 2011). However, recent research has found that the choice of more rigid cost structures can be a beneficial strategy for firms facing certain types of risk. Banker, Byzalov, and Plehn-Dujowich (2014) develop a theoretical model, which predicts that firms may benefit from more rigid cost structures when the cost of not meeting customer demand outweighs the cost of
3 maintaining idle capacity. Thus, while making relationship-specific investments with more flexible cost structures may help suppliers avoid the risks associated with the loss of strong customers, the need to meet the ongoing demands of major customers may outweigh the desire to avoid this risk and lead suppliers to commit greater resources leading to more rigid cost structures.
Prior studies have documented the benefits and risk associated with making relationship-specific investments. Patatoukas (2012) examines the financial benefits to having strong customers. Using DuPont analysis, he documents that firms with higher customer concentration have better operating performance and their stock prices react positively to changes in customer concentration. Irvine, Park, and Yildizhan (2016) extend Patatoukas (2012) by examining the effect of relationship length on the association between customer concentration and finical financial performance. They find that suppliers exhibit higher profits as the age of the relationship between the strong customer and supplier increases, and note that one reason for this finding is that suppliers make relationship-specific SG&A investments with less flexible cost structures, in the early stages of the relationship. However, Irvine et al. (2016) do not explore whether the cost structure of relationship-specific investments has any impact on suppliers’ future performance.
Using data from a sample of U.S. manufacturing firms from 1993 through 2012, we extend prior research by examining the effect of relationship-specific cost structure decisions on suppliers’ future profitability.1 Our focus on a single industry sector, rather than on a broader
sample of businesses, allows us to avoid the problem of inter-industry variation in cost structure noted in prior research (Balakrishnan, Labro, and Soderstrom 2014). For example,
1 We end our sample in 2012 because we require three years of subsequent data for future performance tests, which
4 manufacturing overhead consists of fixed and variable costs, which are recorded in a manufacturing firms’ cost of goods sold (COGS). Thus focusing on an overly broad sample of firms can create comparability issues when analyzing different types of costs.2
Given our focus on the manufacturing sector, we begin our analysis by examining the effect of customer concentration on cost structure in our setting. Using firm-specific cost structure models similar to those developed in Irvine et al. (2016), we measure cost elasticity as a firm’s log change in costs divided by its log change in revenue from the prior year. Our results indicate that higher levels of customer concentration are negatively associated with SG&A, COGS, and operating cost (OC) elasticities, which suggests that suppliers with strong customers make relationship-specific investments that consists of greater fixed-to-variable costs (i.e. less flexible cost structures). While Irvine et al. (2016) document this results for SG&A costs only, our finding that customer concentration is associated with less flexible COGS is consistent with our assertion of greater comparability of cost categories in our setting.
Our primary analysis focuses on the effect of suppliers’ relationship specific cost structure decisions on future profitability. A key implication of Irvine et al. (2016) is that suppliers that invest more in relationship-specific fixed assets are at greater risk to recognize future losses should the relationship end before the supplier can recoup their fixed cost investments. Holzhacker et al. (2015b) explain that more flexible cost structures allow managers to guard against financial risk, which in our setting would apply to losing a major customer or to a major customer exerting their bargaining power to negotiate a more favorable deal. Studies from the TCE literature such as Williamson (1979) posit that relationship-specific investments
2 An example of this issue is the difference in composition of cost of goods sold (or cost of sales) across industries.
In manufacturing firms, cost of goods sold includes direct materials, direct labor, and manufacturing overhead, while the cost of goods sold for retail firms may include wholesale markups, etc. The composition of cost of goods sold also differs within the Compustat database (according to its data definitions), reducing comparability across industries within the same Compustat line item.
5 may expose suppliers to greater risk as strong customers use their superior bargaining power to extract rent from suppliers by threatening to stop buying from the supplier.3 To the extent that
these relationship-specific investments have more rigid cost structures, this will increase the risk of rent extraction by strong customers as suppliers will have greater difficulty adjusting cost downward should a strong customer leave. However, Kang, Mahoney, and Tan (2009) point out that the conventional view of Williamson (1979) ignores that managers may be willing to make these investments because they foresee positive spillovers or believe these investments will strengthen the bond between the customer and supplier, reducing the probability of defection (Kang et al. 2009; Dekker, Sakaguchi, and Kawai 2013).4
Given the conflicting theory on the relative profitability of flexible versus rigid relationship-specific cost structures, we exploit variation in these decisions and examine their effect on supplier firms’ future performance. We define the flexibility of relationship-specific investments as the interaction of a supplier’s customer concentration with its cost elasticity. Suppliers with more elastic cost are interpreted to have more flexible cost structures and as customer concentration increases, the firms’ relationship-specific investments are defined as being more flexible. We then examine the effect of this flexibility on future performance, defined as return on assets (ROA) in the subsequent three years (following Gunny 2010; Eldenburg et al. 2011). Our findings indicate that suppliers that make more flexible relationship-specific investments outperform those that chose more rigid relationship-specific investments.
3 For example, Walmart recently made news when they attempted to use their superior bargaining power to force
additional storage fees and extended payment terms on their supplier network (Pettypiece and Townsend, 2015). While some vendors have chosen to take legal action in order to prevent the unilateral imposition of new costs by Walmart, other vendors, particularly those in more competitive industries, are left with little recourse given the potential for Walmart to retaliate by reducing product orders or by simply ending their customer relationship entirely.
4 For example, investments in customized machinery allow suppliers to provide custom orders for specific
customers at lower costs relative to their competitors. Similarly, investments in specialized inventory management systems support more efficient production and logistics planning within the relationship.
6 Importantly, we control for the age of the suppliers relationships with their strong customers, using the method developed by Irvine et al. (2016), and find that the flexibility of the suppliers’ relationship-specific investments is incremental to that of relationship age.
As a cross-sectional test, we examine how suppliers’ competitive environment affects the association between relationship-specific cost structure decisions and future performance. Theory posits that suppliers operating under higher competition face greater operating risks because customers have more substitute suppliers to buy from (Dhaliwal et al. 2016). Measuring suppliers’ product market competition using the firm’s three digit SIC Herfindahl-Hirschman Index (HHI) and the product market fluidity score (Fluid) developed by Hoberg, Phillips, and Prabhala (2014), we find no evidence that product market competition affects the relative profitability of relationship-specific cost structure decisions. However, we do observe that suppliers in more competitive industries make less flexible relationship-specific investments than those in less competitive industries. This implies that competition exacerbates the risk associated with higher customer concentration through greater cost rigidity.
In supplemental analysis, we explore whether less flexible (more rigid) relationship-specific investments lead to improved relationships with strong customers as suggested by prior literature (Jia 2013). We find no evidence that more rigid relationship-specific investments improve future sales growth to strong customers or the subsequent duration of the relationship between suppliers and their strong customers. Furthermore, our findings are robust to alternative models of testing cost structure decisions, separately examining SG&A and COGS flexibility, and the use of different sample periods.
Our study contributes to the accounting literature in a number of ways. First, we add to the cost structure literature (see Banker et al. 2016) by examining the performance consequences
7 of relationship-specific cost structure decisions.5 Drawing from managerial accounting and TCE
theory, we argue that suppliers facing higher customer concentration can either manage risk through more flexible (i.e. more elastic) cost structures or make greater commitments to their strong customers by choosing more rigid cost structures. We examine the relative profitability of a risk avoidance versus a commitment strategy in the context of strong customers where there is high demand for relationship-specific investments. Our finding that the decision to make more flexible relationship-specific investments is positively associated with future performance informs the accounting literature about the effect of cost structure decisions on future profitability.
Second, we extend the literature on the determinants of cost structure decisions (Banker 2014, Holzhacker et al. 2015a and 2015b, Hall 2016) by examining the effect of competition. Particularly, we complement Irvine et al. (2016) by documenting that suppliers operating under higher competition make less flexible relationship-specific investments than suppliers operating under lower competition. Theory suggests that suppliers facing higher competition may commit more resources to their strong customers because of relatively weaker bargaining power or as a strategy to bind the strong customer to the supplier. While we cannot speak to the ex ante reasoning for these investment decisions, our finding that more rigid (i.e. less flexible) relationship-specific investments result in less profitable future performance suggests that strategies that seek to bind strong customers through greater investments in fixed costs are relatively less successful than those that avoid risk through more flexible costs.
5 Balakrishnan et al. (1996) examine the performance effects of JIT investment and find that firms with greater
customer concentration have lower accounting returns to JIT adoption. Aboody et al. (2014) examine the effect of firms’ overall cost structure decisions and find that more rigid cost structure are associated with higher future earnings (on average), but lower earnings when there is a negative revenue shock. By contrast, our study examines the effect of relationship-specific cost structure decisions on future performance in light of theoretical predictions derived from the TCE literature.
8 Third, our findings complement those of Patatoukas (2012) and Irvine et al. (2016) by contributing to the understanding of how customer concentration affects firm performance. Patatoukas (2012) finds that financially healthy firms benefit from customer concentration through higher levels of ROA and Irvine et al. (2016) documents that these benefits increase with the length of the relationship with firms’ strong customers. Our results contribute to these studies by documenting that the cost structure impact of relationship-specific investments affects ability of firms to profit from strong customer relationships. While customer concentration has the potential to improve performance, a key implication of our study is that managers should prefer a risk management strategy to a commitment strategy by choosing relationship-specific investments that result in more flexible cost structures.
Finally, our findings help to bridge the gap between financial and managerial accounting research by providing insights about one of the mechanisms that affects the relationship between customer concentration and supplier firm risk. Dhaliwal et al. (2016) find that customer concentration increases suppliers’ cost of capital, particularly for firms at higher risk of customer defection. Our results add to their findings by suggesting that relationship-specific cost structure decisions may contribute to the documented higher cost of capital since prior research finds that higher levels of operating leverage are associated with higher cost of capital (Lev 1974; Mandelker and Rhee 1984).
The rest of the paper is organized as follows: Section II provides an overview of relevant literature and motivates our research questions. Section III describes our empirical methodology, while Section IV presents and discusses our results. Section V provides concluding remarks.
II. Literature review and research questions
9 Customer concentration refers to the number and relative size of customers that contribute to a firm’s revenues. As a higher proportion of overall revenues is contributed by a firm’s major (i.e. largest) customers, that firm is said to exhibit a higher level of customer concentration (Patatoukas 2012). The Statement of Financial Accounting Standards (SFAS) 131 (FASB 1997) requires that firms disclose the presence of any and all customers who contribute 10% or more of enterprise-wide revenue, either to a single segment or across multiple segments. The FASB and SEC’s decision to mandate major customer disclosure reflects the idea that the existence of major customers is important in helping investors to assess firm risk (Dhaliwal et al. 2016). Despite the perceived risks, Patatoukas (2012) documents an upward trend in customer concentration since SFAS 131 became effective.
While prior studies suggest that relationship-specific investments lower suppliers’ profitability (Lustgarten 1975), Patatoukas (2012) focuses on firms with positive operating performance and documents that firms with higher customer concentration exhibit higher ROA, lower SG&A expenses, and better asset turnover rates. Irvine et al. (2016) further these findings by extending their sample to include firms with negative operating performance. They find that the positive effect of customer concentration on operating performance increases with the length (in time) of the relationship between suppliers and their major customers, possibly due to suppliers making relationship-specific investments, with more rigid costs structures, in the earlier part of the relationship. However, they do not examine why firms would be willing to sacrifice profits early in the relationship and whether this decision is good for suppliers, especially since doing so will decrease profits even more if their strong customers leave before the supplier can recoup their initial investment.6
6 While both customers and suppliers make relationship-specific investments, we focus on suppliers’ investments
10
Relationship-specific investments
TCE focuses on whether a transaction is more efficiently performed within a firm or by an outside supplier (Geyskens, Jan-Benedict, and Kumar 2006), and provides a number of insights as to why suppliers choose to engage in relationship-specific investments. TCE suggests that customer firms will contract with outside suppliers for a certain product because the outside supplier can achieve higher product quality and lower product costs through specialization and economies of scale. However, transactions costs are created when customers buy from outside suppliers instead of making the product themselves. To lower these transaction costs, customers and suppliers engage in relationship-specific investments (Williamson 1979), which are assets that are customized for a particular user or transaction, and would lose at least part of their value if the relationship were terminated (Jia 2013).
Cost structure
Managers’ investment decisions affect the firm’s cost structure, or the relative proportion of variable-to-fixed costs that a firm incurs from production. Cost structure decisions are one of the most important decisions that managers make because they directly affect firm profitability, with more rigid cost structures (i.e. higher proportions of fixed costs) leading to greater reductions in profits when sales decline, but higher profits when sales increase. The traditional view of cost structure strategy is that firms take steps to offset increased operating and environmental risk by adopting less rigid cost structures to minimize the potential downside risk associated with fluctuations in sales (Banker et al. 2014).
Consistent with the traditional view of cost structure strategy, Kallapur and Eldenberg (2005) find that hospitals chose more flexible (less rigid) cost structures, by increasing their ratio
available for a small subset of publicly traded companies. Additionally, in contrast to the requirement for suppliers, the public companies that are listed as strong customers are not required to list their strong suppliers.
11 of variable-to-fixed costs, after a change in Medicare reimbursement policy that increased the uncertainty of hospital’s revenues. Similarly, Holzhacker et al. (2015b) find that hospitals facing greater demand uncertainty and financial risk adapt more flexible cost structures by adjusting their procurement decisions to use greater outsourcing, leasing of equipment and a greater share of contract labor. However, contrary to the traditional view of cost structure strategy, Banker et al. (2014) document that demand uncertainty, measured as the standard deviation of changes in sales, is positively associated with more rigid cost structures for a sample of manufacturing firms. They develop a model predicting that firms will prefer more rigid cost structures when facing demand uncertainty in order to capitalize on periods of unusually high demand. More generally, their study implies that other types of firm-level risk may have similarly “counterintuitive” effects on firm cost structure decisions.
Development of research questions
Relationship-specific investments and cost structure
Following the logic of TCE theory, suppliers and customers make relationship-specific investments to lower the transactions costs of trading with each other. Suppliers compete with each other through their ability to lower transaction costs or increase transaction values. Some supplier-level relationship investments that help to achieve this goal include investing in specialized inventory management systems, hiring dedicated customer service personnel, expanding delivery capabilities, and procuring machinery to meet customized orders. The managers of supplier firms can choose how to make these relationship-specific investments, affecting the firm’s cost structure with their choices. For example, customer service personnel can be full-time employees or temporary hourly contractors, delivery trucks and specialized
12 equipment could be purchased or leased, and the manufacturing of custom products can be done in-house or outsourced.
The TCE literature posits that suppliers bear greater risk when making these investments because the customer typically has stronger relative bargaining power. Thus, suppliers can choose to manage risk by adopting more flexible cost structures (Kallapur and Eldenberg 2005) or commit more resources by choosing more rigid cost structures in hopes of recognizing higher demand from strong customers (Banker et al. 2014). An additional risk associated with making relationship-specific investments with more rigid cost structures is that the fixed costs associated with these investments likely adjust downward more slowly than those of non-relationship specific investment because these investments lose value if put to alternative use (if they have any alternative use at all).7 In their study on the relationship between relationship life cycle and
firm profitability, Irvine et al. (2016) examine a sample of firms from various industries and document that firms make more fixed costs SG&A investments earlier in their relationship with strong customers. They do not, however, find the same relationship for cost of goods sold (COGS).
The examples of relationship-specific investments given earlier can affect both SG&A and COGS cost structures. For example, the decision to insource (outsource) deliveries would make SG&A costs more rigid (flexible) while the decision to purchase (lease) equipment for meeting specialized orders would make COGS costs more rigid (flexible). Since we focus our study on manufacturing firms with differing relationship lengths, we examine the effect of customer concentration on cost structure as an empirical question.
7 Downward adjustments refer to the reduction of costs when activity declines. Fixed costs (inherently) adjust
downward more slowly than variable costs, and the speed that fixed costs adjust downward depends on the type of fixed cost. For example, selling a machine with a very specialized use will be harder than selling a machine with a generic use.
13 Performance outcomes
Next we examine how the cost structure of relationship-specific investments affects subsequent performance. Williamson (1996) argues that relationship-specific investments without safeguards are a form of poor management. While TCE theory focuses on the existence of a formal contract between a supplier and customer as the typical form of an economic safeguard, a number of studies document that it is common for suppliers to make relationship-specific investments without formal contracts (Rokkan, Heide, and Wathne 2003; Kang et al. 2008). From a managerial accounting perspective, a major economic safeguard would be to choose more flexible cost structures to guard against the risk of losing a major customer since costs would adjust downward more quickly should the major customer leave.
Rather than focusing on safeguards, recent TCE studies have focused on the advantages of relationship-specific investments. Kang et al. (2009) extend TCE theory by explaining that one reason suppliers make relationship-specific investments without formal contracts is because their managers have foresight into the potential benefits of making these decisions. Consistent with the intuition of Banker et al. (2014), if managers foresee an increase in demand from a strong customer as a potential benefit, they will make relationship-specific investments with more rigid cost structures. Additionally, Jia (2013) posits that although relationship-specific investments put suppliers at greater risk should the buyer leave, certain types of specific investments can bind customers to their suppliers. Thus investing in more relationship-specific fixed costs could serve to increase customer switching costs and create barriers to entry for competing suppliers, which reduces the probability of customer defection (Dekker, Sakaguchi, and Kawai 2013).
14 On one hand, choosing a risk avoidance strategy by making relationship-specific investments with more flexible cost structures may be more profitable as it safeguards against the loss of a major customer. On the other hand, a commitment strategy, where managers make relationship-specific investments with a greater proportion of fixed-to-variable costs may be more profitable as profits will increase by more as sales to strong customers increase. Since theory is mixed on whether a risk avoidance or commitment strategy is, on average, more profitable, we follow prior studies (Gunny 2010; Eldenburg et al. 2011; Hall 2016) and compare the relative profitability of each strategy by examining their effect on future performance. If a risk avoidance (commitment) strategy is preferable then relationship-specific investments with more flexible cost structures will be positively (negatively) associated with future performance.
III. Data and methodology
Sample
We build our sample using major customer information reported in the Compustat Segment Files, which include data on customer name, type, and revenue contributed to the supplier firm. Following Banker et al. (2014), we restrict our sample to manufacturing firms (two digit SIC Codes 20 – 39). We also require that the supplier report at least one major customer.8
We develop a 20-year sample beginning in 1993 and ending in 2012 because we require enough leading data to calculate future return on assets.
After compiling our sample of supplier firms with customer concentration data, we gather additional financial information related to suppliers’ operating costs and sales revenue (REV)
8 While SFAS 131 requires companies to disclose any and all customers who contribute ten percent or more of
wide revenue, firms often choose to disclose customers who contribute less than ten percent of company-wide revenues based on the importance of such customers to the company (Patatoukas 2012). Following prior literature, our analysis uses information about all disclosed major customers regardless of the percentage of revenue contributed by each customer.
15 from Compustat. Following Banker et al. (2014) and Irvine et al. (2016), we focus on three cost categories: total operating costs (OC), selling, general, and administrative costs (SGA), and cost of goods sold (COGS).9 We control for the potential impact of outliers on our analysis by
truncating observations with values of REV, OC, SGA, and COGS in the highest and lowest 0.5% of the distribution. While we exclude observations, which are missing total operating cost data, we do not exclude observations missing any of the two sub-categories of operating costs (SGA or COGS). Additionally, we restrict our sample to firms with sufficient data to calculate return on assets (ROA) for year t+1 in order to facilitate comparability between our main tests and performance tests. We are left with a final sample of 26,438 firm-year observations across the entire sample period. Table 1 reports a description of the sample composition by industry. Observations from firms in the electronic equipment and components industry, industrial/commercial machinery and computer equipment industry, and chemicals and allied products industry make up slightly more than 50% of the sample.
< Insert Table 1 About Here >
Descriptive statistics
Table 2 presents descriptive statistics for variables used in the study. Differences in numbers of observations across variables are attributable to missing data. The average (median) firm in our sample reported sales revenue of $1,311 ($109) million dollars and total operating costs of $1,188 ($107) million. Table 3 reports correlations among the variables used in our multivariate tests. Spearman (Pearson) correlations are reported in the upper (lower) diagonal.
< Insert Tables 2 and 3 About Here >
Model specification
9 We follow Kama and Weiss (2012) in using operating costs (OC), defined as revenue minus operating income, as a
summary measure of total firm costs. As we discuss later, inferences are unchanged when separately analyzing COGS and SG&A cost rigidity.
16 We construct our customer concentration variable (CC) by adopting the measure developed by Patatoukas (2012). This measure allows us to capture both the total number of major customers present within a firm’s customer base and their relative importance within the firm’s revenue stream. The resulting measure of firm i’s customer concentration in year t, essentially a weighted-average index of customer-specific revenue to total firm revenue, is described by the following equation:
𝐶𝐶
𝑖𝑡= ∑ (
𝑆𝑎𝑙𝑒𝑠𝑆𝑎𝑙𝑒𝑠𝑖𝑗𝑡𝑖𝑡
)
2 𝐽
𝑗= (1)
where Salesijt represents firm i’s sales to customer j in year t and Salesit represents total sales for
firm i in year t. Average (median) CC is 0.142 (0.073) for our sample of firms. Detailed variable descriptions are provided in Appendix A.
Following the methodology proposed in prior research (Irvine et al. 2016), we examine our research questions using a firm-specific cost elasticity measure. The elasticity of costs with respect to sales of a firm in year t is calculated as the log-change in cost between year t-1 and year t divided by the log-change in sales from year t-1 to t as defined the equation below:
𝐸𝑙𝑎𝑠𝑡𝑖𝑐𝑖𝑡𝑦 (𝐶𝑜𝑠𝑡) = 𝑙𝑛(𝐶𝑜𝑠𝑡𝑡)−𝑙𝑛(𝐶𝑜𝑠𝑡𝑡−1)
𝑙𝑛(𝑆𝑎𝑙𝑒𝑠𝑡)−𝑙𝑛(𝑆𝑎𝑙𝑒𝑠𝑡−1) (2)
Firm-specific elasticities are separately calculated for each cost category (OC, SGA, and COGS). We then examine our research questions regarding the relationship between customer concentration and cost structure using the following regression specification:10
Elasticity(Costit) = β0 + β1RankCCit + β2MVEit + β3AGEit + β4GROWTHit
+ β5FLEVit + β6CONGLOit + Σγ1-19IndFEit + ε (3)
10 We use yearly Fama-MacBeth (1973) and Newey-West-adjusted t-statistics to estimate results for equations (3)
through (7) in order to account for serial correlation in our customer concentration measure. The Newey-West adjustment adjusts the Fama-MacBeth t-statistics for serial correlation (up to three lags) in the time-series of estimated coefficients. Our inferences are robust to the use of pooled cross-sectional regressions and clustering standard errors by firm and year.
17 We estimate equation (4) using three separate specifications of the Elasticity(Cost) term: total operating costs (OC Elasticity), selling, general, and administrative costs (SGA Elasticity), and cost of goods sold (COGS Elasticity). RankCC is defined as the decile rank of a firm’s customer concentration measure for year t. We construct the variable RankCC by first calculating the value for CC as described in equation (1) for each firm-year observation. We then rank each firm-year observation into deciles based on their CC score and scale the decile rank so that the measure takes a value between 0 and 1. We also include controls for a firm’s market value of equity (MVE), age (AGE), annual sales growth (GROWTH), and leverage ratio (FLEV). We include an indicator variable set equal to one if the firm reports at least two business segments, and 0 otherwise (CONGLO). Our model also includes controls for industry fixed effects (IndFE). The slope coefficient β1 in this regression equation provides an estimate of the
relationship between customer concentration and firm cost structure. A negative coefficient suggests that customer concentration leads to firms adopting a more rigid cost structure (i.e. greater fixed costs) while a positive coefficient suggests that customer concentration leads to firms adopting a more elastic cost structure (i.e. less fixed costs).
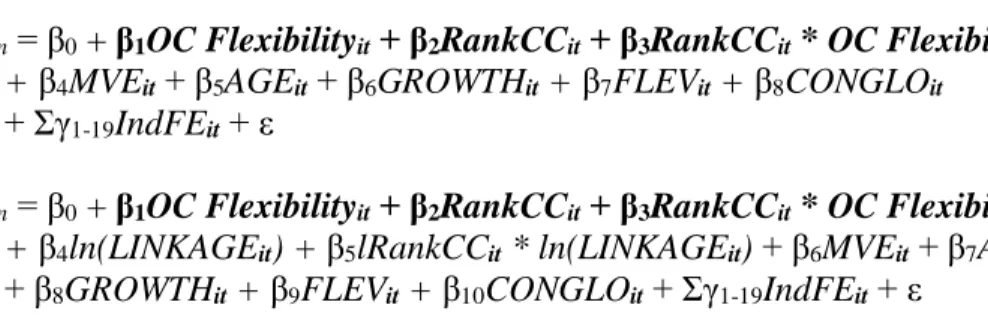
To examine the relative profitability of managers’ relationship-specific cost structure decisions, we analyze the impact of these decisions on future firm performance. Future firm performance is measured using return on assets (ROA) in years t+1 through t+3. We utilize our measure of operating cost structure flexibility (OC Flexibility) to test this relationship. OC Flexibility is defined as the decile rank of a firm’s operating cost elasticity measure for year t scaled from 0 to 1, with 0 indicating firms with the least elastic (i.e. least flexible) operating cost structure and 1 indicating the firms with the most elastic (i.e. most flexible) operating cost structure. We also adopt the measure of relationship duration (LINKAGE) from Irvine et al.
18 (2016) as an additional control for our performance tests. LINKAGE is calculated as the weighted average duration of strong customer relationships at the end of year t. Our resulting future performance regressions are specified below:
ROAit+n = β0 + β1OC Flexibilityit + β2RankCCit + β3RankCCit * OC Flexibilityit
+ β4MVEit + β5AGEit + β6GROWTHit + β7FLEVit + β8CONGLOit (4a)
+ Σγ1-19IndFEit + ε
ROAit+n = β0 + β1OC Flexibilityit + β2RankCCit + β3RankCCit * OC Flexibilityit
+ β4ln(LINKAGEit) + β5lRankCCit * ln(LINKAGEit) + β6MVEit + β7AGEit (4b)
+ β8GROWTHit + β9FLEVit + β10CONGLOit + Σγ1-19IndFEit + ε
IV. Empirical results
Regression results
Customer concentration and cost structure
Table 4 presents our results on the effect of customer concentration on cost structure. Estimates of equation (3) for each of the three cost elasticity categories, operating costs (OC), SG&A costs (SGA), and cost of goods sold (COGS) are provided. Columns 1 through 3 present estimation results for continuous values of our dependent variables while columns 4 through 6 present estimation results for decile-rank transformed values of these same variables. The coefficient for the variable of interest, RankCC, (β1) is negative and significant in the estimates
of all three cost categories, indicating that firms with greater customer concentration have less elastic costs structures. While Irvine et al. (2016) document this effect only for SG&A costs, we find a significant negative relationship between RankCC and COGS Elasticity. Since our sample includes only manufacturing firms as compared to the broader sample utilized by Irvine et al. (2016), this result suggests differences between manufacturers and other types of firms in terms of the relationship between customer concentration and cost structure. The results presented in Table 4 are consistent with supplier firms making relationship-specific investments with more
19 fixed-to-variable costs, which benefit the firm should sales to strong customers continue and/or increase in the future. The sign and direction of our control variables are consistent with those shown in Irvine et al. (2016).11
< Insert Table 4 About Here > Future performance
Next, we test the impact of relationship-specific cost structure decisions on future performance. Results for our estimates of equations (4a) and (4b) are presented in Table 5. The coefficient on the interaction term RankCC * OC Flexibility (β3) captures the combined effect of
the firms relationship-specific cost structure decision on future firm performance. We observe positive and statistically significant β3 coefficients in years t+1, t+2, and t+3 (columns 1-3). Our results persist after controlling for relationship duration (LINKAGE) (columns 4-6). This result indicates that adopting a more flexible cost structure for relationship-specific investments yields superior future performance. Complementing the results of Irvine et al. (2016), our results indicate that the positive association between relationship length and returns to customer concentration extend to subsequent years.
< Insert Table 5 About Here > Supplier industry competition
We also examine the extent to which competitive pressures impact the effect of relationship-specific cost structure decisions on future performance. A number of prior studies argue that suppliers in more competitive product markets are at higher risk when facing greater customer concentration because strong customers have access to more alternative suppliers (Dhaliwal et al. 2016), thereby increasing the risk of defection and lowering the supplier’s
11 Given our consistent results for all cost categories, we focus on total operating costs (OC) when reporting results
for the remainder of our analyses. We obtain qualitatively similar results when we conduct our analyses using sales, general, and administrative costs (SGA) and cost of goods sold (COGS).
20 relative bargaining power (Bucknix and Van den Poel 2005; Hall and Porteus 2006). Thus, our finding that adopting more flexible relationship-specific investments is a more profitable strategy for firms may be affected by competitive pressures since suppliers at greater risk for strong customer defection would benefit more from adopting a risk avoidance strategy. However, it is unclear whether competitive pressures may also constrain suppliers in their ability to adopt more flexible cost structures. Therefore, we examine the effect of product market competition on suppliers’ relationship-specific cost structure decisions in addition to our future performance tests.
To test the effect of competition we adopt two proxies: industry concentration and product market fluidity. We use each firm’s three digit SIC Herfindahl-Hirschman Index (HHI) in year t to measure industry concentration. Lower (higher) values of HHI indicate fewer (more) market participants and lower (higher) levels of competition. As an alternative measure we adopt the text-based measure of product market fluidity (Fluid) developed by Hoberg, Phillips, and Prabhala (2014), which captures changes in the rivals’ products relative to a firm’s own products.12 Higher values of Fluid indicate greater potential for new market entrants and
competitive threats. More detailed explanations of each of these competition measures are presented in Appendix A.
We examine our research question related to competitive pressures and future performance using subsample analysis, dividing each subsample at the median value of HHI. Equation (4b) is estimated for each subsample and coefficients are compared using t-tests from a fully interacted model.13 Results of these estimations are reported in Table 6. We again focus our
12 For more detail on the calculation of the Fluidity scores see Hoberg et al. (2014). Fluidity scores are downloaded
from Gordon Phillip’s website at http://www.rhsmith.umd.edu/industrydata/. We thank Hoberg, Phillips and Prabhala for allowing access to their data.
21 attention on β3, the coefficient on the interaction term RankCC * OC Flexibility. Estimates of β3
are not significantly different between our low and high competition subsamples for any year (t+1 through t+3). This suggests that the performance benefits of adopting a more flexible cost structures for relationship-specific investments do not vary due to industry competition. We find a qualitatively similar pattern of results when we build our subsample using median splits of product market fluidity (FLUID) rather than HHI, although we do not tabulate the results for brevity.
<Table 6 About Here>
While we find no incremental impact of competition for our performance tests, managers of firms operating under higher competition may make different relationship-specific cost structure decisions given their lower relative bargaining power. To test this assertion, we use the following regressions:
Elasticity(Costit) = β0 + β1RankCCit + β2HighCompit + β3RankCCit * HighCompit
+ β4MVEit + β5AGEit + β6GROWTHit + β7FLEVit + β8CONGLOit (5a)
+ Σγ1-19IndFEit + ε
Elasticity(Costit) = β0 + β1RankCCit + β2HighFluidit + β3RankCCit * HighFluidit
+ β4MVEit + β5AGEit + β6GROWTHit + β7FLEVit + β8CONGLOit (5b)
+ Σγ1-19IndFEit + ε
HighComp (HighFluid) is an indicator variable set to 1 if a firm has an HHI (FLUID) value below the sample median in year t. All other variable definitions are the same as those previously described.
Results for estimations of equations (5a) and (5b) are presented in Table 7. In each equation, the coefficient β3 relates to our variable of interest: RankCC * HighComp or RankCC *
HighFluid. Columns 1 and 3 present estimation results for untransformed values of OC Elasticity while columns 2 and 4 present estimation results for decile-rank transformed values for OC
22 Elasticity and our controls. Results show a significant negative coefficient on β3 for all
estimations reported in Table 7. These results suggest that competitive pressures lead firms to adopt relationship-specific investments with less flexible (i.e. more rigid) cost structures. Taken together, the results from Tables 6 and 7 suggest that high customer concentration firms in more competitive markets end up worse off than those in less competitive markets because, on average, they make relationship-specific investments with more rigid cost structures even though more flexible cost structures yield better performance.
< Insert Table 7 About Here > Additional tests
In addition to our main tests, we examine two potential areas where customer concentration and cost structure may contribute positively to firm performance that may not be fully reflected in our ROA tests: growth in sales to strong customers and relationship duration. Theory suggests that firms choosing a commitment strategy are likely to develop deeper relationships, resulting in longer relationship durations and higher shares of sales to strong customers (Joskow 1987). Table 8, Panel A, reports results for the following regression specification:
Sales Growthit+n = β0 + β1OC Flexibilityit + β2RankCCit + β3RankCCit * OC Flexibilityit
+ β4MVEit + β5AGEit + β6GROWTHit + β7FLEVit + β8CONGLOit (6)
+ Σγ1-19IndFEit + ε
We calculate growth in sales to strong customers (SC Sales Growth) for years t+1, t+2, and t+3 and estimate equation (6) separately for each year. Our estimation of equation (6) shown in Table 8, Panel A, suggests that relationship-specific investments do not yield increased sales growth to strong customers. In fact, firms that maintain higher levels of operating cost flexibility realize increased sales growth to strong customers in year t + 1. More specifically, if the investments
23 made to increase cost structure rigidity are in service of specific strong customer relationships (i.e. relationship-specific investments), our results suggest that these investments are not justified by any performance improvement related to sales growth to the intended strong customers.
<Insert Table 8 About Here>
Since Irvine et al. (2016) document that relationship length increases the profitability of having more concentrated customers, we examine the effect of relationship-specific cost structure decisions on the duration of these relationships as a possible mechanism for these investments to benefit suppliers. Table 8, Panel B reports estimation results for the following regression equation:
ln(LINKAGEit+n) = β0 + β1OC Flexibilityit + β2RankCCit
+ β3RankCCit * OC Flexibilityit + β4ln(LINKAGEit) + β5MVEit (7)
+ β6AGEit + β7GROWTHit + β8FLEVit + β9CONGLOit + Σγ1-19IndFEit + ε
Ln(LINKAGE), the natural log of the previously defined LINKAGE variable, is calculated for years t+1 through t+3 and equation (7) is separately estimated for each year.14 Our results
suggest that the cost structure of relationship-specific investments does not impact on the duration of strong customer relationships. In untabulated tests, we identify a subsample of supplier-customer pairs with available Compustat data. Using duration tests similar to the ones used by Raman and Shahrur (2008), we find qualitatively similar results.
Robustness checks
We check the robustness of our documented relationship between customer concentration and cost structure using an alternative, log-linear cost model proposed in prior research (Kallapur and Eldenburg 2005; Banker et al. 2014) where log-changes in costs are regressed on concurrent log-changes in sales revenues along with controls for GDP growth and firm size (in total
14 We log-transform LINKAGE due to the skewness of the variable, but our result are robust to using the
24 assets).15 We report the results of these robustness checks in Table 9. Specifically, column (1)
presents the re-examination of the main relationship between customer concentration and cost structure, while columns 2 and 3 re-examine the effect of competition on this relationship. Results from these alternative cost structure models are consistent with our inferences and support the robustness of our results.
<Insert Table 9 About Here>
We also test the robustness of our results by re-examining our main performance results using SG&A and COGS flexibility in place of operating cost flexibility in Equation 4b. These results are reported in Table 10. The coefficient on RankCC * SGA Flexibility is positive and statistically significant in years t+2 and t+3 while the coefficient on RankCC * COGS Flexibility is positive and significant for all three years. These results support our main finding that risk avoidance through greater cost structure flexibility in relationship-specific investments positively affects future performance.
<Insert Table 10 About Here>
In untabulated results, we use a number of alternative measures and regression specifications. For our cost structure tests (Tables 4 and 7), we replace our main customer concentration variable with either the raw CC score from Patatoukas (2012) or an indicator variable for whether the firm has at least one customer which accounts for more than 10 percent of its sales as alternative measures of customer concentration. For our performance tests (Tables 5 and 6), we redefine operating performance as earnings before interest and income tax or earnings before extraordinary items, both deflated by total assets. We also rerun all of our tests
15 See Banker et al. (2014) for a more complete description of the log-linear model specification. Standard errors are
25 excluding years prior to 1997 (the effective year of SFAS 131). Our results are qualitatively unchanged when using these alternative measures and specifications.
V. Conclusion
We examine the performance consequences of relationship-specific cost structure decisions. Analyzing cost data for a sample of U.S. manufacturing firms from 1993-2012, we find that suppliers making relationship-specific investment with more flexible cost structures (a greater degree of variable-to-fixed costs) outperform those making more rigid relationship-specific investments. We also find that suppliers’ competitive environment has no effect on the relative profitability of their relationship-specific cost structure decisions, but that suppliers in more competitive industries make less flexible relationship-specific investments, which may exacerbate the risk associated with higher customer concentration. Additional analysis indicates that relationship-specific investments with more rigid cost structures increase neither future sales to strong customers nor the length of the customer-supplier relationship. Overall, our findings suggest that a risk avoidance strategy outperforms a commitment strategy in the context of relationship-specific cost structure decisions.
This study contributes to the literature on cost structure by documenting the effects of a specific type of cost structure decision on future performance. Our findings inform the current discussion about the relative advantages of choosing more flexible versus more rigid cost structures (Holzhacker et al. 2015b, Banker et al. 2014). We also identify product market competition as an environmental factor influencing relationship-specific cost structure decisions. Additionally, we extend the customer concentration literature (Patatoukas 2012; Irvine et al. 2016) by documenting that the cost structure of relationship-specific investments affects the profitability of strong customer relationships. Finally, our results have implications for financial
26 accounting research through identifying cost structure as a potential explanation for previously observed increases in financial risk and cost of equity capital associated with higher levels of customer concentration (Dhaliwal et al. 2016).
Our findings should be interpreted with two caveats. First we recognize that the decision to make relationship-specific investments are joint decisions between customers and suppliers. We cannot observe the negotiation process, thus we cannot infer how much of the observed cost structure decision is due to supplier versus customer preferences. As a result, we cannot extend our inferences to assess the quality of managers’ first-best preferences about relationship-specific cost structure. Second, we follow prior cost structure literature and focus our study to a specific industry (Banker et al. 2014; Holzhacker et al. 2015a; Holzhacker et al. 2015b). Thus, our findings may not fully extend to other industries. Future studies may wish to investigate the relation between relationship-specific cost structure decisions and performance in other types of industries or firm level characteristics that affect mangers’ cost structure decisions.
27
References
Aboody, D., S. Levi, and D. Weiss. 2014. Operating Leverage and Future Earnings. Working paper, University of California – Los Angeles and Tel Aviv University.
Balakrishnan, R., E. Labro, and N. S. Soderstrom. 2014. Cost structure and sticky costs. Journal of Management Accounting Research 26 (2): 91-116.
Balakrishnan, R., T.J. Linsmeier, and M. Venkatachalam. 1996. Financial benefits from JIT adoption: Effects of customer concentration and cost structure. The Accounting Review 71(2): 183-205.
Banker, R. D., D. Byzalov, and J.M. Plehn-Dujowich. 2014. Demand uncertainty and cost behavior. The Accounting Review 89(3): 839-865.
Banker, R. D., D. Byzalov, S. Fang, and L. Yi. 2016. Cost behavior research. Retrieved from https://ssrn.com/abstract=2882713.
Buckinx, W., and D. Van den Poel. 2005. Customer base analysis: partial defection of behaviourally loyal clients in a non-contractual FMCG retail setting. European Journal of Operational Research 164(1): 252-268.
Dekker. H.C., J. Sakaguchi, and T. Kawai. 2013. Beyond the contract: Managing risk in supply chain relations. Management Accounting Research 24(2): 122-139.
Dhaliwal, D.S., J.S. Judd, M.A. Serfling, and S.A. Shaikh. 2016. Customer concentration risk and the cost of equity capital. Journal of Accounting and Economics 61(1): 23-48.
Eldenburg, L.G., K.A. Gunny, K.W. Hwee, and N. Soderstrom. 2011. Earnings management using real activities: Evidence from nonprofit hospitals. The Accounting Review 86(5): 1605-1630.
Financial Accounting Standards Board (FASB). 1997. Disclosures about Segments of an Enterprise and Related Information. Statement of Financial Accounting Standards No. 131. Norwalk, CT: FASB.
Garrison, R., E. Noreen, and P. Brewer. 2011. Managerial Accounting. 14th edition. New York, NY: McGraw-Hill.
Geyskens, I., J. E.M. Steenkamp, and N. Kumar. 2006. Make, buy, or ally: A transaction cost theory meta-analysis. Academy of Management Review 49(3): 519-543.
Goodman, T.H., M. Neamtiu, N. Shroff, and H.D. White. 2014. Management forecast quality and capital investment decisions. The Accounting Review 89(1): 331-365.
28 Gunny, K.A. 2010. The relation between earnings management using real activities manipulation
and future performance: Evidence from meeting earnings benchmarks. Contemporary Accounting Research 27(3): 855-888.
Hall, C. 2016. Does ownership structure affect labor decisions? The Accounting Review, 81(6): 1671-1696
Hall, J., and E. Porteus. 2000. Customer service competition in capacitated systems. Manufacturing & Service Operations Management 2(2): 144-165.
Hoberg, G., G. Phillips, and N. Prabhala. 2014. Product market threats, payouts, and financial flexibility. Journal of Finance 69(1): 293-324.
Holzhacker, M., R. Krishnan, and M.D. Mahlendorf. 2015a. The impact of changes in regulation on cost behavior. Contemporary Accounting Research 32(2): 534-566.
Holzhacker, M., R. Krishnan, and M.D. Mahlendorf. 2015b. Unraveling the black box of cost behavior: An empirical investigation of risk drivers, managerial resource procurement, and cost elasticity. The Accounting Review 90(6): 2305-2335.
Irvine, P.J., S.S. Park, and Ç. Yildizhan. 2016. Customer-base concentration, profitability, and the relationship life cycle. The Accounting Review 91(3): 883-906.
Jia, N. 2013. Competition, governance, and relationship-specific investments: Theory and implications for strategy. Strategic Management Journal 34(13): 1551-1567.
Joskow, P.L. (1987). Contract duration and relationship-specific investments: Empirical evidence from coal markets. American Economic Review, 77(1), 168-185.
Kallapur, S., and L. Eldenburg. 2005. Uncertainty, real options, and cost behavior: evidence from Washington State hospitals. Journal of Accounting Research 43 (5): 735-752. Kama, I., and D. Weiss. 2013. Do earnings targets and managerial incentives affect sticky costs?
Journal of Accounting Research 51(1): 201-224.
Kang, M., J. T. Mahoney, and D. Tan. 2009. Why firms make unilateral investments specific to other firms: The case of OEM suppliers. Strategic Management Journal 30(2): 117-135. Klein, B., R.G. Crawford, and A.A. Alchian. 1978. Vertical integration, appropriable rents, and
the competitive contracting process. The Journal of Law and Economics 31(2): 297-326. Lev, B. 1974. On the association between operating leverage and risk. Journal of Financial and
29 Lustgarten, S.H. 1975. The impact of buyer concentration in manufacturing industries. The
Review of Economics and Statistics 57(2): 125-132.
Mandelker, G.N., and S.G. Rhee. 1984. The impact of the degrees of operating and financial leverage on systematic risk of common stock. Journal of Quantitative Finance and Analysis 19(1): 45-57.
Merchant, K.A. 1990. The effects of financial controls on data manipulation and management myopia. Accounting, Organizations, and Society 15(4): 297-313.
Patatoukas, P.N. 2012. Customer-base concentration: Implications for firm performance and capital markets. The Accounting Review 87(2): 363-392.
Peterson, M.A. 2009. Estimating standard errors in finance panel data sets: Comparing approaches. Review of Financial Studies 22(1): 435-480.
Pettypiece, S., and M. Townsend. 2015. Wal-Mart’s suppliers are finally fighting back. Retrieved from http://www.bloomberg.com/news/articles/2015-09-11/wal-mart-sparks-battle-with-suppliers-over-margin-squeezing-fees
Raman, K., and H. Shahrur. 2008. Relationship-specific investments and earnings management: Evidence on corporate suppliers and customers. The Accounting Review 83(4): 1041-1081.
Rokkan, A.I., J.B. Heide, and K.H. Wathne. 2003. Specific investments in marketing relationships: Expropriation and bonding effects. Journal of Marketing Research 40(2): 210-224.
Williamson, O.E. 1979. Transaction-cost economics: The governance of contractual relations. Journal of Law and Economics 22(2): 233-261.
Williamson, O.E. 1996. The mechanisms of governance. New York, NY: Oxford University Press.
30 APPENDIX A
Variable definitions
REV Total revenues (in millions)
OC Total operating costs [revenue minus operating income] (in millions)
SGA Selling, general, and administrative costs (in millions)
COGS Cost of goods sold (in millions)
TA Total assets (in millions)
OC Elasticity Elasticity of total operating costs for a firm defined as (𝑅𝐸𝑉(𝑂𝐶𝑡/𝑂𝐶𝑡−1)
𝑡/𝑅𝐸𝑉𝑡−1) SGA Elasticity
Elasticity of sales, general, and administrative costs for a firm defined as
(𝑆𝐺𝐴𝑡/𝑆𝐺𝐴𝑡−1)
(𝑅𝐸𝑉𝑡/𝑅𝐸𝑉𝑡−1)
COGS Elasticity Elasticity of cost of goods sold costs for a firm defined as (𝐶𝑂𝐺𝑆(𝑅𝐸𝑉𝑡/𝐶𝑂𝐺𝑆𝑡−1)
𝑡/𝑅𝐸𝑉𝑡−1) OC Rigidity
Decile rank of the operating cost elasticity measure (OC Elasticity) scaled to range from 0 to 1, with 1 indicating the firms with the most rigid (i.e. least elastic) operating cost structure and 0 indicating the firms with the least rigid (i.e. most elastic) operating cost structure.
CC
Customer concentration score for firm i in year t (CCit) equals∑ ( 𝑆𝑎𝑙𝑒𝑠𝑖𝑗𝑡
𝑆𝑎𝑙𝑒𝑠𝑖𝑡)
2 𝐽
𝑗= where
Salesijt represents firm i’s sales to customer j in year t and Salesit represents total sales for firm i in year t
RankCC Decile rank of the customer concentration variable CC scaled to range from 0 to 1.
ROA Return on assets defined as net income divided by total assets
HHI Herfindahl-Hirschman Index calculated using three digit SIC code
Fluid
Product market fluidity score for firm I in year t equals (𝑁𝑖,𝑡∙‖𝐷𝐷𝑡−1,𝑡𝑡−1,𝑡‖) where Ni,t is a vector indicating which from among all unique product-related words are used by firm i during year t and Dt-1,t is the aggregate change vector which captures overall changes in word usage between year t-1 and year t.
HighComp High industry concentration indicator variable equals 1 if the firm's HHI is below
the sample median, 0 otherwise.
HighFluid High product market fluidity indicator variable equals 1 if the firm's product market
fluidity is above the sample median, 0 otherwise.
SC Sales Growth Annual sales growth rate for sales to strong customers for a firm.
RC Sales Growth Annual sales growth rate for sales to customers other than strong customers (i.e.
regular customers) for a firm.
LINKAGE Weighted average duration of a firm’s strong customer relationships at the end of
year t.
MVE Market value of equity.
AGE Firm age measured as the number of years since the first year the firm appears in
the Compustat Annual Fundamentals database.
GROWTH Annual sales growth rate between years t-1 and t for a firm.
FLEV Leverage ratio measured as assets divided by market value of equity for a firm.
CONGLO Indicator variable equal to 1 if the firm reports at least to business segments and 0
otherwise.