AALTO UNIVERSITY
School of Electrical Engineering
Department of Communications and Networking
Rabiul Islam Jony
Preprocessing Solutions for Telecommunication Specific Big
Data Use Cases
Master's Thesis submitted in partial fulfillment of the degree of Master of Science in Technology
Espoo, November, 2013
Supervisor: Prof. Heikki Hämmäinen, Aalto University, Finland
i
AALTO UNIVERSITY ABSTRACT OF THE MASTER’S THESIS
Author:
Title of the Thesis:
Rabiul Islam Jony
Preprocessing Solutions for Telecommunications Specific Big Data Use cases
Date: 28.11.2013 Number of pages: 12+65
School: Department:
School of Electrical Engineering
Department of Communications and Networking
Professorship: Network Economics
Supervisor: Prof. Heikki Hämmäinen, Aalto University, Finland
Instructor: Lic.Sc. (Tech.) Pekka Kekolahti, Aalto University, Finland
Big data is becoming important in mobile data analytics. The increase of networked devices and applications means that more data is being collected than ever before. All this has led to an explosion of data which is providing new opportunities to business and science. Data analysis can be divided in two steps, namely preprocessing and actual processing. Successful analysis requires advanced preprocessing capabilities. Functional needs for preprocessing include support of many data types and integration to many systems, fit for both off-line and on-line data analysis, filtering out unnecessary information, handling missing data, anonymization, and merging multiple data sets together.
As a part of the thesis, 20 experts were interviewed to shed understanding on big data, its use cases, data preprocessing, feature requirements and available tools. This thesis investigates on what is big data, and how the organizations, especially telecommunications industry can gain benefit out of it. Furthermore, preprocessing as a part of value chain is presented and the preprocessing requirements are sorted. Finally, The available data analysis tools are surveyed and tested to find out the most suitable preprocessing solution.
This study presents two findings as results. Firstly, it identifies the potential big data use cases and corresponding functional requirements for telecom industry based on literature review and conducted interviews. Secondly, this study distinguishes two most promising tools for big data preprocessing based on the functional requirements, preliminary testing and hands-on testing.
Keywords: Big data, Data preprocesing, Data value chain, Big data in telecom industry,
Preprocessig tools.
ii
ACKNOWLEDGMENTS
This master's thesis has been carried out in the Department of Communications and Networking of Aalto University School of Electrical Engineering as a part of the research project ‘MOMIE – Modeling of Mobile Internet Ecosystem’.
First of all, I would like to express my sincere gratitude to my supervisor, Professor Heikki Hämmäinen for giving me the opportunity to work under his supervision and guiding me throughout the process.
My heartfelt thank and appreciation goes to my instructor Lic.Sc. (Tech.) Pekka Kekolahti, for his guidance, encouragements, ideas, advice and endless patient on me. Its been a pleasure working with him.
My special thanks to all the experts who participated in the interview sessions, for their kind cooperation and valuable time.
Strongest thanks to my parents for their continuous support, encouragement and blessing at every step of my life.
I am grateful to Rashedul Islam Khan Rana, Rakibul Islam Rony and Taslima Akter Shoma for their enormous support and courage on my working and being aside of me always.
Special thanks to Youtube, and the online forums of the tools.
Otaniemi, Espoo: 28.11.2013
iii
iv
Table of Contents
ACKNOWLEDGMENTS ... ii Table of Contents ... iv ABBREVIATIONS ... vii List of Figures ... ix List of Tables ... xi 1. Introduction... 1 1.1. Background ... 1 1.2. Motivation ... 2 1.3. Research Questions ... 2 1.4. Problem statement ... 31.5. Objective of the thesis ... 3
1.6. Outline of the thesis ... 3
2. Big data ... 5
2.1. Definition... 5
2.1.1. Big data characteristics ... 6
2.2. Big data business opportunities in different industries ... 10
2.3. Big data value chain ... 14
2.3.1. Data sources, types and accessibility ... 15
2.3.2. Preprocessing and Storing ... 16
2.3.3. Processing and Visualization ... 17
2.4. Big data Challenges ... 20
2.5. Role of Hadoop in big data... 21
2.5.1. Hadoop Characteristics ... 22
2.5.2. Hadoop Architecture ... 22
v
3. Big data in Telecom Industry ... 25
3.1. Telecom operators’ data volume growth ... 25
3.1.1. Data types and Data sources ... 27
3.2. Big data use case domains for operators ... 31
4. Data Preprocessing ... 37
4.1. Reasons for data preprocessing ... 37
4.2. Major Data preprocessing tasks and techniques... 38
4.3. Big data preprocessing challenges ... 42
5. Preprocessing Solutions... 43
5.1. Feature requirements ... 43
5.1.1. Data preprocessing features ... 43
5.1.2. Performance and Usability features ... 45
5.1.3. Analytics features ... 45
5.2. Preprocessing tools ... 46
6. Hands-on testing of the tools ... 50
6.1. Datasets and preprocessing tasks ... 50
6.2. Tools performance evaluation criteria ... 53
6.3. Tools performance evaluation ... 56
6.3.1. KNIME... 56 6.3.2. RapidMiner ... 57 6.3.3. Orange ... 59 6.3.4. IBM SPSS Statistics ... 60 7. Conclusion ... 62 7.1. Results ... 62 7.2. Assessment of Results ... 62 7.3. Exploitation of Results ... 64 7.4. Future Research ... 64
vi
8. Bibliography ... 66
vii
ABBREVIATIONS
AMA ARFF
Automatic Message Accounting Attribute-Relation File Format AVG
BSC BSS
Average
Base Station Controller Business Support Systems BTS
CAGR CDR
Base Transceiver Station
Compound Annual Growth Rate Call Detail Record
CRM Customer Realtionship Management
CSV Comma-separated values
DBA Database Administator
DDDM Data-Driven Decision-Making
ELT Extract-Load-Transfrom
ETL Extract-Transfor-Load
GPS GUI
Global Positioning System Graphical User Interface
HDFS Hadoop Distributed File System
HLR Home Location Register
HTTP Hypertext Transfer Protocol
IAP IoT
Internet Access Provider Internet of Things
IP Internet Protocol
IPDR Internet Protocol Detail Record
IPG ITU
Inter Packet Gap
International Telecommunication Union LAC
LTE
Location Area Code Long-Term Evolution M2M Machine-to-Machine MAC Max MCC Min MMS MNC MSC NA
Media Access Control Maximum
Mobile Country Code Minimum
Multimedia Messaging Service Mobile Network Code
Mobile Switching Center Not Available/Not Applicable
NoSQL Not only Structured Query Language
NR Not Ranked
OSS Operation Support Systems
OTT PCA
Over-The-Top
Principal Component Analysis PdM QoE QoS RAID Predictive Maintenance Quality of Experience Quality of Service
Redundant Array of Independent Disks
viii RFC RNC RTCP RTP SDR SIP SLA SMS SON SQL
Request for Comments Radio Network Controller
Real-time Transport Control Protocol Real-time Transport Protocol
Service Detail Record Session Initiation Protocol Service-level Agreement Short Message Service Self-Organizing Network Structured Query Language SVM
TCP
Support Vector Machine Transmission Control Protocol
TXT Text files
UDP VLR
User Datagram Protocol Visitor Location Register VOD
XDR
Video on Demand Extended Data Record
XML Extensible Markup Language
ix
List of Figures
Figure 1: 3Vs of big data (Soubra, 2012)... 6
Figure 2: Data volume growth by year in zettabytes (AT Kearney, 2013) ... 7
Figure 3: Examples of big data velocity (Kalakota, 2012) ... 7
Figure 4: Growth of data variety by years (Botteri, 2012) ... 8
Figure 5: Four characteristics (volume, velocity, variety, and veracity) of big data (IBM, 2012) ... 9
Figure 6: Amount of stored data by industry types in the United States, 2009 ... 11
Figure 7: Big data potentiality in different industry ... 11
Figure 8: Types of big data initiatives within an organization (McKendrick, 2013) ... 12
Figure 9: The Data-Information-Knowledge-Wisdom hierarchy pyramid ... 14
Figure 10: Typical big data value chain ... 15
Figure 11: Typical ETL process framework ... 17
Figure 12: Typical Flow diagram for managing big data focusing telecom industry ... 18
Figure 13: Use of real-time analytics to deliver on defined business objectives for operators (Banerjee, 2011) ... 19
Figure 14: Capability comparison of Hadoop with traditional databases (Metascale, 2013) ... 21
Figure 15: Hadoop Ecosystem (Pradhan, 2012) ... 23
Figure 16: Cisco forecast on mobile data traffic growth by 2017 (Cisco, 2013) ... 26
Figure 17: Global total data traffic in mobile networks, 2007-2012 (Ericsson, 2012) ... 26
Figure 18: Major data preprocessing tasks and techniques (typical process flow) ... 41
Figure 19: An example of a large process which requires a numbers of nodes ... 58
Figure 20: Big data landscape (Feinleib, 2012) ... 72
Figure 21: Traffic volume from some sources for end user (Kekolahti, n.d.) ... 73
Figure 22: Commercial tools comparison (1) published in ‘Data miner survey by Rexer Analytics’ (Statsoft, 2013) ... 101
Figure 23: Commercial tools comparison (2) published in ‘Data miner survey by Rexer Analytics’ (Statsoft, 2013) ... 101
x
Figure 25: Preprocessing task 2 on RapidMiner ... 102
Figure 26: Sub-process of preprocessing task 2 on RapidMiner ... 103
Figure 27: Preprocessing task 3 on RapidMiner ... 103
Figure 28: Sub-process of preprocessing task 3 on RapidMiner ... 104
Figure 29: Preprocessing task 4 on RapidMiner ... 104
Figure 30: Sub-process of preprocessing task 4 on RapidMiner ... 105
Figure 31: Preprocessing task 1 on KNIME ... 105
Figure 32: Preprocessing task 2 on KNIME ... 106
Figure 33: Preprocessing task 3 on KNIME ... 106
Figure 34: Preprocessing task 4 on KNIME ... 107
Figure 35: Preprocessing task 1 on Orange ... 107
Figure 36: Preprocessing task 2 on Orange ... 108
Figure 37: Preprocessing task 4 on Orange ... 108
Figure 38: Preprocessing task 1 on IBM SPSS Statistics ... 109
xi
List of Tables
Table 1: Definitions for big data ... 10
Table 2: Data-Information-Knowledge-Wisdom components ... 15
Table 3: Legacy analytics infrastructure Vs. Real-time analytics infrastructure (Banerjee, 2011) ... 19
Table 4: Percentage Comparison table of global device unit growth and global mobile data traffic growth (Cisco, 2013)... 25
Table 5: Typical network log file (Tstat, n.d.) ... 28
Table 6: Typical CDR Fields (Madsen, et al., n.d.) ... 29
Table 7: Data types collected by MobiTrack from handset (Karikoski, 2012) ... 30
Table 8: Potential data sources and available data for operators (Acker, et al., 2013) ... 31
Table 9: Dimensions of data quality ... 37
Table 10: Real world data problems ... 38
Table 11: Major data preprocessing tasks and corresponding sub-tasks ... 40
Table 12: Data preprocessing techniques and corresponding sub-techniques ... 41
Table 13: Data preprocessing features requirements ... 44
Table 14: Example: scoring levels for Missing value analysis functionality ... 44
Table 15: Performance and usability features list ... 45
Table 16: Analytics features list... 46
Table 17: Available tools having certain preprocessing capabilities with mark (x) representing their main focus, texts green represents commercial and text black represents open source tools ... 47
Table 18: Selected 20 tools based on personal qualitative ranking ... 48
Table 19: Datasets descriptions for hands-on testing ... 51
Table 20: Hands-on testing result table... 55
Table 21: Additional traffic volume sources for end user perspective ... 73
Table 22: Potential big data use cases in telecom Industry... 88
Table 23: Scoring conditions of the features ... 97
Table 24: Scoring of tools according to preprocessing features capability ... 98
xii
1
1.
Introduction
1.1.
Background
In 2000, when the Sloan Digital Sky Survey started their operation, its telescope in New Mexico collected more data on its first few weeks than had been amassed in the entire history of astronomy. After one decade, its archive presently contains around 140 terabytes of data. Another large Synoptic Survey Telescope in Chile is predicted to collect a corresponding quantity of data every five days by 2016 (The Economist, 2010) . The retail giant Wal-Mart’s warehouse stores around 2.5 petabytes of data regarding 1 million customer transactions on an hourly basis (Infosys, 2013). Facebook, a social networking website stores 500+ terabytes of new data every day. Search engines, such as Google daily process 20 petabytes of data (The Economist, 2010). All these examples show the big amount of data the world contains, and the speed at which the volume of data is growing. The mankind had managed to create 5 exabytes of data by 2003, and today the same amount of data is created in only two days (Schmidt, 2010). The amount of data in the digital world reached 2.72 zettabytes in 2012, and is expected to double every two years reaching 8 zettabytes by 2015 (Sagiroglu & Sinanc, 2013). Data are getting so large and complex, that it is becoming difficult to process using traditional data processing applications, and introducing big data.
The most popular definition of big data is defined by Gartner as “Big data is volume, high-velocity and/or high-variety information assets that require new forms of processing to enable enhanced decision making, insight discovery and process optimization” (Beyer & Laney, 2012). Definitions of big data will be discussed in more detail in Chapter 2 of this thesis.
The telecommunications industry constantly transfers petabytes of data across their networks. Due to next generation mobile network rollouts, such as LTE (Long-term evolution), IoT (internet of things), and M2M (Machine-to-Machine communications) along with increased use of smart phones and rise of social media, mobile operators are experiencing a rise in volume, variety and velocity of data. According to (CITO Research, 2012), 54 percent of operators claimed, that big data is a current strategic priority in their organization. According to ITU, 2013 will be the year, when the majority of Mobile operators will start treating big data as strategic priority for both internal and external use (ITU, 2013).
Big data is currently treated as a technology, which has been developed to handle large volumes of fast-changing and non-schematic data. Big data technology also provides companies, such as telecom operators with an ideal platform for centralizing and storing and analyzing their structured,
2
unstructured and semi-structured data. These yield major advantages in data analysis, knowledge discovery and new business opportunity identification.
Data analysis is divided into two steps, namely preprocessing and actual processing. Successful processing requires advanced preprocessing capabilities. The data which are not yet subjected to any analysis are known as raw data. Data preprocessing can be defined as bringing out the right data from the raw data, or preparing the raw data for actual processing.
Many tools are presently available for data analysis, new tools focusing on big data analytics are also emerging. Due to new internet business models, different open source preprocessing and analytics tools have been developed which might be well suited for operators’ data preprocessing.
1.2.
Motivation
Operators are collecting large amounts of data every day. The collected data can provide valuable information for the operators about subscriber experience, e.g. how the call has gone through, whether it was dropped or interrupted, how fast the apps were downloaded, and how was the response latency. Collected data also allow the operators to learn about the interest of a subscriber, e.g. which websites the subscriber visits most, what kind of application is being downloaded and what is the subscriber sentiment conveyed in the social media. Network data and other external data can also provide valuable information to the operators which can be applied in different use cases. This thesis has been made in Network Economics Research Group of Prof. Heikki Hämmäinen in the School of Electrical Engineering, Aalto University. The research team has vast experience in data analysis as part of the mobile ecosystem research. The tools and libraries the researchers of this research group are using include Excel, R, Matlab, Weka, SPSS, and Bayesialab. The datasets they are working on include handset based monitoring data, survey data, device databases, sales data, traffic data (TCP/IP, HTTP). Although the mentioned tools and libraries have some level of preprocessing capabilities, new emerged open source tools with modern user interfaces and rich functionalities would facilitate the group's research tasks and extend the scope and possibilities as increasing data sources will be available for them.
1.3.
Research Questions
This thesis attempts to answer two questions relevant to the big data in telecom industry and Preprocessing of data including:
3
Q2: Which of the available tools support best the functionality and usability, regarding telecom industry data preprocessing tasks (including small and big data preprocessing)?
1.4.
Problem statement
Big data is enabling new business cases for the mobile operators, and it is important for them to find out the potential use cases. Operators for example also need to know what are the typical data types, data sources and requirements for the use cases. The data preprocessing is a vital part of the data value chain. It is important in finding out, when data needs to be reduced, cleaned and modified. The preprocessing feature requirements and capable tools-list are important while choosing proper tools out of many. Open source tools are emerging, and it is important to know how these tools can perform data preprocessing, also in academic work.
1.5.
Objective of the thesis
This thesis will sort out potential big data use cases for operators. The data types, data sources, and the requirements for those specific use cases will also be presented. The feature requirements for the preprocessing of data will be classified and selected tools will be graded according to their capability. Finally, several preprocessing tasks with typical datasets will be accomplished with illustrious tools to find out the most suitable tools.
The objectives of this thesis are:
To discover potential big data use cases for telecom operators, and to list the functional requirements for the tools based on the use cases.
To figure out the typical challenges in preprocessing of big data
To understand how the tools meet the preprocessing requirements
To find out how the most promising tools can perform in practical preprocessing tasks, through practical hands-on testing.
As a part of the thesis, 20 experts form Aalto University, vendor, operator and media companies were interviewed to shed understanding on big data, its use cases, data preprocessing, feature requirements and available tools.
1.6.
Outline of the thesis
In Chapter 2 of this thesis, big data will be described and defined, and big data value chain will be discussed.
4
Chapter 3 deals with the typical data types and data sources for telecom operators. The potential big data use case domains will be shortly described along with few examples.
Chapter 4 will be focused on the data preprocessing as a process. Major tasks and techniques of preprocessing will be discussed.
In Chapter 5, the available data preprocessing tools will be listed. The feature requirements for data preprocessing will also be described.
In Chapter 6, the test cases will be introduced for the hands-on testing of top scored tools and the results will be discussed.
Chapter 7 concludes the thesis with discussing the assessment, exploitation, and future research opportunities of this study.
5
2.
Big data
2.1.
Definition
Big data has been defined simply as “Big data refers to data volumes in range of exabytes (1018) and beyond” in (Kaisler, et al., 2013).
According to Wikipedia, “Big data is a collection of datasets so large and complex that it becomes difficult to process using on-hand database management tools or traditional data processing applications, where the challenges include capture, storage, search, sharing, transfer, analysis, and visualization” (Wikipedia, 2013). In this definition big data is addressed as a problem.
Sam Madden from Massachusetts Institute of Technology (MIT) wrote “Big data means too big, too fast, or too hard for existing tools to process” (Madden, 2012). He also explained, the term ‘too big’ as the amount of data which might be at petabyte-scale and come from various sources, ‘too fast’ as the data growth, which is fast and must be processed quickly, and ‘too hard’ as the difficulties of big data that does not fit neatly into an existing processing tool (Madden, 2012).
From PC Mag (popular magazine based on latest technology news), “Big data refers to the massive amounts of data that collects over time that are difficult to analyze and handle using common database management tools” (PC Magazine, 2013).
John Weathington has defined big data as a competitive key parameter in different dimensions such as customers, suppliers, new entrants and substitutes. According to him, big data creates products which are valuable and unique, and prelude other products from satisfying the same need. He also described, “Big data is traditionally characterized as a rushing river: large amounts of data flowing at a rapid pace” (Weathington, 2012).
It has also been defined as “Big data Represents the progress of the human cognitive processes, usually includes data sets the sizes beyond the ability of current technology, method and theory to capture, manage, and process the data within a tolerable elapsed time” (Doctorow, 2008).
Philip Hunter in has stated, “Big data embodies an ambition to extract value from data, particularly for sales, marketing, and customer relations” (Hunter, 2013).
Svetlana Sicular has defined big data as “high-volume, -velocity and –variety information assets that demand cost-effective, innovative forms of information processing for enhanced insight and decision making” (Sicular, 2013).
6
There are many more big data definitions available describing the different characteristics of it.
2.1.1. Big data characteristics
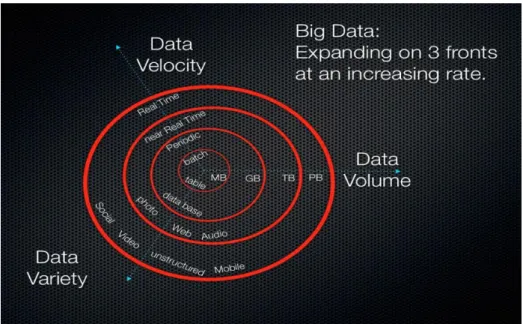
The characteristics of big data are well defined in the definition by Gartner (Beyer & Laney, 2012). The three Vs (volume, velocity and variety) are known as the main characteristics of big data. The characteristics are described below.
Figure 1: 3Vs of big data (Soubra, 2012)
Volume: Data volume measures the amount of data available to an organization; the organization does not necessarily have to own all of it as long as it can access it (Kaisler, et al., 2013). The number of sources of data for an organization is growing. More data sources consisting large datasets increase the volume of data, which needs to be analyzed. As data volume increases, the value of different data records decreases in portion to age, type, richness and quality among the other factors (Kaisler, et al., 2013).
Figure 1 shows that the data volume is growing from megabytes (106) to petabytes (1015) and beyond.
Figure 2 indicates, that the volume of data stored in the world would be more than 40 zettabytes (1021) by 2020 (AT Kearney, 2013).
7
Figure 2: Data volume growth by year in zettabytes (AT Kearney, 2013)
Velocity: Data velocity measures the speed of data creation, streaming and aggregation (Kaisler, et al., 2013). According to Svetlana Sicular from Gartner, velocity is the most misunderstood big data characteristic (Sicular, 2013). She describes that the data velocity is also about the rate changes, and about combining data sets that are coming with different speeds. The velocity of data also describes bursts of activities, rather than the usual steady tempo where velocity frequently equated to only real-time analytics (Sicular, 2013).
Figure 3: Examples of big data velocity (Kalakota, 2012)
Figure 3shows few examples of the pace the data. Data velocity management is much more than a bandwidth issue; it is also an ingest issue (Kaisler, et al., 2013).
8
Figure 1also reflects velocity as a characteristic of big data, showing how it requires near real-time and/or real-time analytics.
Variety: Other than typical structured data, big data contains text, audio, images, videos, and many more unstructured and semi-structured data, which are available in many analog and digital formats. From an analytics perspective, variety of data is the biggest challenge to effectively use it. Some researchers believe that, taming the data variety and volatility is the key of big data analytics (Infosys, 2013). Data variety is a measure of the richness of the data presentation. Incomputable data formats, non-aligned data structures and inconsistent data semantics represents significant challenges that can lead to analytic sprawl (Kaisler, et al., 2013).
Figure 4shows the comparison between increment of unstructured, semi-structured data and structured data by years. Figure 1 also reflects the increment in verity of data.
Figure 4: Growth of data variety by years (Botteri, 2012)
One of the big data vendors, IBM has coined additional V for the big data characteristics, which is veracity. By veracity, they address the inherent trustworthiness of the data. As big data will be used e.g. for decision making, it is important to make sure that the data can be trusted.
Some researchers mentioned ‘viability’ and ‘value’ as the fourth and the fifth characteristics leaving ‘veracity’ out (Biehn, 2013).
9
Figure 5: Four characteristics (volume, velocity, variety, and veracity) of big data (IBM, 2012)
The characteristics of big data can also be described with HACE theorem. The theorem states that, “Big data starts with large-volume; heterogeneous, autonomous sources with distributed and decentralized control and seeks to explore complex and evolving relationships among data (Wu, et al., 2013). From the theorem the key characteristics are defined as:
2. Huge Data with Heterogeneous and Diverse Dimensionality: Here the ‘heterogeneous’
feature refers to the different types of representations for the same individuals. The feature ‘diverse’ reflects the variety of the features involved to represent each single observation.
3. Autonomous Sources with Distributed and Decentralized Control: ‘Autonomous’
feature describes the ability of each data sources to generate and collect information without any centralized control.
4. Complex and Evolving Relationships: With volume of data the complexity and the
correlations among them increases.
In summary, big data can be defined as large volume, high velocity and verities of data, which is complex to process with traditional applications, but able to bring new business opportunities to the industries by enhanced insight generation.
10 Definitions Challenging for
traditional applications/ Requires new forms of application Large volume of data Competitive key parameter Enhanced insights generator High-volume, high-velocity, high-variety Volume, velocity, variety, veracity HACE Theorem (Kaisler, et al., 2013) x (Wikipedia, 2013) x (Madden, 2012) x x (PC Magazine, 2013) x (Weathington, 2012) x x (Doctorow, 2008) x (Hunter, 2013) x (Sicular, 2013) x x (IBM, 2012) x (Wu, et al., 2013) x Table 1: Definitions for big data
2.2.
Big data business opportunities in different industries
In 1974, economist John Kenneth Galbraith stated, that performing complex tasks require a greater amount of data to be processed. He also mentioned ‘vertical information systems’ as the technologies that enable greater collections of information/data (Brynjolfsson, et al., 2011). These facilitate more efficient distribution of information within an organization which lessen the costs and improve the performance.
According to McKinsey Global Institute (MGI) research, big data is becoming the key basis of competition, underpinning new waves of productivity growth, innovation and customer surplus of the future market (McKinsey & Company, 2011).
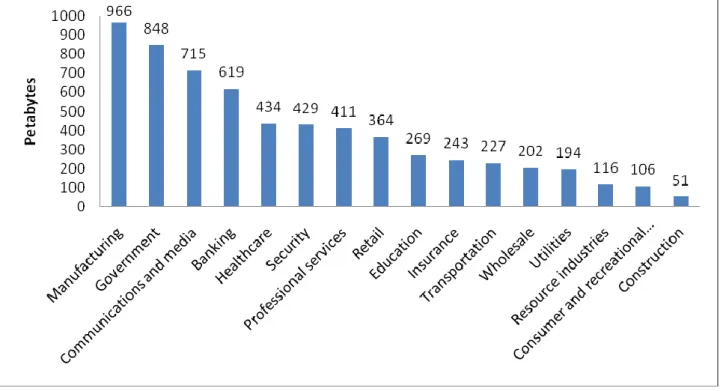
Figure 6presents the amounts of stored data in petabytes by industry types in the United States in 2009 (McKinsey & Company, 2011). It shows that industries, such as Manufacturing, Government, Communications and media, and Banking have more the 500 petabytes of data already stored in their systems. Healthcare, Security, Professional services and Retail industries are holding more than 350 petabytes of data. Industries like Education, Insurance, Transportation, Wholesale and Utilities have more than 200 petabytes of data.
Telecommunications industry, combined with other communications and media industry holds the third position in the ranking having around 715 petabytes of stored data.
11
Figure 6: Amount of stored data by industry types in the United States, 2009
The cloud architecture, open source software and commodity hardware of recent market made the big data processing available to the companies which are not even highly resourced. Researchers argued that big data is not just a property of big web companies like Google or Facebook, organizations of all different sizes and industry groups are now leveraging it in many ways (McKendrick, 2013).
12
Figure 7 shows the potentiality of big data as a new business asset in different industries (KDnuggets, 2012). It shows that the top industries or domain types are customer relation management and healthcare, followed by retail, banking, education, advertising, fraud detection and so on. Telecom industry is in the latter half in the ranking. Telecom industry, in practice includes other domains, such as customer relationship management, fraud detection and social media. This fact reflects the potentiality of big data in telecom industry as well.
Figure 8: Types of big data initiatives within an organization (McKendrick, 2013)
Figure 8 lists big data initiatives emerged from the survey explained in (McKendrick, 2013). According to the survey, the two top most initiatives are customer analysis or segmentation and historical data analysis. Other initiatives includes production system log monitoring, IT system log monitoring, market analysis and so on.
Big data can bring business benefits to the organizations in several ways; few applicable ways are discussed below.
Create transparency: Organizations can make their big data accessible for their
stakeholders in a timely way and make their business progress and strategy transparent.
Supply chain management: Big data analytics can improve organizations’ supply chain management by ensuring real-time delivery management, better vendor management, automated product sourcing and segmented supply chain.
13
Allow experimentation to discover needs: Big data analytics will allow the organizations
to do more experiments on their business strategy and products to find out new requirements.
Dynamic pricing: Big data analytics allow the organizations to optimize their product pricing according to the customer needs, market research and business target.
Targeted marketing: Big data can provide the organizations with information about
customers’ needs and interests, which will allow them to do targeted marketing.
Innovate new business models, services and products: Proper data analysis can provide the organizations with insights about the market, e.g. which types of products are being appreciated or neglected by the customers. New business models, new services or products can be invented by analyzing these types of data.
Predictive analysis: Predictive analysis can identify events before occurring and predict the outcome before implementation.
Better understand the customers: Organizations can utilize their customer data to
understand their customers more efficiently and know how, when, and what they want.
Lessen Business OPEX and CAPEX: Big data analytics will allow the organizations to lessen their operational cost and capital cost in different ways, e.g. by optimizing business strategy.
Improve performance: Big data analysis can also offer improved performance by
improving decision making accuracy and saving time.
Compete more effectively: Big data analysis will allow the organizations to know about themselves and the rivals in the market. Proper Big data analysis will allow the companies to compete more effectively and survive in the market.
Data-Driven Decision-Making (DDDM): DDDM is the technology to use data analytics as
insights for decision making. Survey on 179 large publicly traded firms showed, the firms that adopt DDDM had output and productivity as high as 6% than the others who did not (Brynjolfsson, et al., 2011). More data analysis will offer more effective and accurate decision making.
Insight generation: Analyzing big data will allow the organizations to generate more insights, which were not possible with small datasets.
Big data also has some limitations. Sometimes it can produce few patterns which are entirely caused by chance, not replicable or having no predictive power. It might also provide weaker patterns, where strong patterns get ignored. In (Boyd & Crawford, 2011), six provocations for big data have
14
been discussed. The study argued, that the term ‘Big data’ is not perfect for it, as it is notable not because of its size, but because of its confliction with other data. According to the study, big data is still subjective, clamming objectivity and accuracy of it is misleading. The study has also argued that bigger data are not always better data; meaning that the quantity does not necessarily mean quality and it is important to focus and learn the value of small data first. The study describes one provocation of big data as limited access to big data creates new digital divides. Finally, big data analytics also have potential privacy and ethical issues, because it does not make it ethical just because it is accessible (Boyd & Crawford, 2011).
A proper big data value chain can facilitate the organizations to get the business benefits in above described ways.
2.3.
Big data value chain
Few decades ago, Michale E. Porter first introduced the concept of value chain, where he explained a value chain as a series of activities that create and build value as it progresses (Porter, 1985). Finally these activities culminated in total value, which the organizations then deliver to its customer (Miller & Mork, 2013). In 1988 R. L. Ackoff first specified data value chain (Ackloff, 1989). This was a hierarchy based on filtration, reduction, and transformation showing how data lead to information, knowledge and finally to wisdom. He presented Data-Information-Knowledge-Wisdom hierarchy as a pyramid which produces a series of opposing terms including misinformation, error, ignorance and stupidity when inverted (Bernstein, 2011). Ackoff has fitted wisdom on the top of the hierarchy pyramid followed by knowledge, information and then the data or the raw data.
15
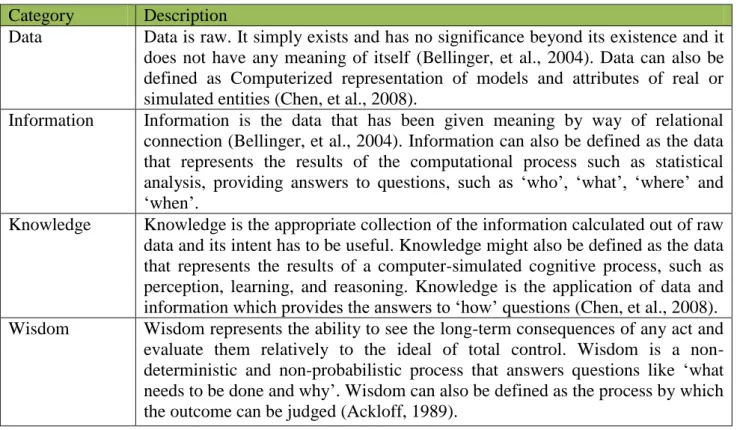
Table 2below describes the four components of Data-Information-Knowledge-Wisdom hierarchy. Category Description
Data Data is raw. It simply exists and has no significance beyond its existence and it does not have any meaning of itself (Bellinger, et al., 2004). Data can also be defined as Computerized representation of models and attributes of real or simulated entities (Chen, et al., 2008).
Information Information is the data that has been given meaning by way of relational connection (Bellinger, et al., 2004). Information can also be defined as the data that represents the results of the computational process such as statistical analysis, providing answers to questions, such as ‘who’, ‘what’, ‘where’ and ‘when’.
Knowledge Knowledge is the appropriate collection of the information calculated out of raw data and its intent has to be useful. Knowledge might also be defined as the data that represents the results of a computer-simulated cognitive process, such as perception, learning, and reasoning. Knowledge is the application of data and information which provides the answers to ‘how’ questions (Chen, et al., 2008). Wisdom Wisdom represents the ability to see the long-term consequences of any act and
evaluate them relatively to the ideal of total control. Wisdom is a non-deterministic and non-probabilistic process that answers questions like ‘what needs to be done and why’. Wisdom can also be defined as the process by which the outcome can be judged (Ackloff, 1989).
Table 2: Data-Information-Knowledge-Wisdom components
The big data value chain in this research is divided into three steps, naming Data sources, Preprocessing and storing, and Processing and Visualization, where each step increases value.
2.3.1. Data sources, types and accessibility
The data types and accessibility are included in the sources tag because these also define the value. This step can be divided into three sub-divisions naming availability, amount and accessibility. These define the value of the data sources.
16
In Figure 10, difficulteasy is mentioned in this step, which means if the data from the sources is easily accessible, it has higher value. This step of the value chain lies under the data section of the Data-Information-Knowledge-Wisdom pyramid.
2.3.2. Preprocessing and Storing
This step of the value chain brings the information out of the data, and belongs to the information part of the pyramid. For ease of graphics design, the pyramid is drawn horizontally in the value chain.
Value increases with the capability of colleting, loading, and preparing the data. There are different kinds of data types in big data, and capability of reading all types of data increases value. The data preparing capability also increases value. Typically data needs to be stored in this phase, but if real-time analysis is required, data might be stored after the actual analysis.
The preprocessing step of the value chain reflects the ETL (Extract-Transform-Load) process. This study will also consider few ETL tools as data preprocessing tool. This is why a clear understanding on the ETL process is important.
Many organizations typically use the traditional ETL tools for their structured data preprocessing purposes. The goals of ETL process are to (Simitsis, 2003):
(i) Identify the relevant information in the source side (ii) Extract the information
(iii) Customization and integration of the information coming from multiple sources (iv) Clean the data on the basis of requirements
(v) Propagate the data to the data ware house
The ETL process achieves these goals by three simple steps called Extract, Load, and Transform, hence the name ETL.
Extract:
Extract is the first step of ETL process which covers the data extraction from the source system and makes it accessible for further processing. The goal of this step is to retrieve required data from all the sources with little resources, and not to affect the process in terms of performance, response time negatively. Data extraction can be performed in several ways like update notification, incremental extraction and full extraction (Anon., 2013).
17
Transform:
Transform step cleans the data, which is important to ensure the quality of the data. When the data is cleaned then transform step applies a set or rules to transform the data from source to target. This includes several tasks, such as translating coded values, encoding free-from values, sorting, joining the data from multiple sources, aggregation and splitting according to the application requirements.
Load:
The load phase loads the transformed data into the end target. Depending on the requirements of the applications, this process varies widely. Typically the target of the load phase is the databases or data warehouses. During the load step it is also necessary to ensure that the load is performed correctly with the minimal resources usage.
The ETL process framework is shown in the Figure 11 below.
Figure 11: Typical ETL process framework
Few tools, such as Oracle Data integrator perform Extract-Load-Transform (ELT) to enhance efficiency.
2.3.3. Processing and Visualization
This step of the value chain creates the highest value. This step can also be called as ‘Analytics and Visualization’. This step lies into both knowledge and wisdom parts of the pyramid. Descriptive analysis works on past and present results and answers questions, such as what happened, what happens, and how it went. On the other hand, diagnostic and predictive analysis investigate the results and answer questions, such as why it happened, who did and what is going to happen. Both the processes increase value and bring knowledge. Prescriptive analysis works on future and
18
includes questions, such as what is needed to be done and why, also brings wisdom. Wisdom has the highest value in the value chain (Stein, 2012).
The big data value chain shows the process of converting data into information, knowledge, and finally to wisdom. It also shows that the data preprocessing plays an important mediator role to enable information and generates insights from data.
A typical flow diagram for managing big data focusing telecom industry is presented below. From the Figure 12 it is clear that, the flow diagram follows the value chain.
Figure 12: Typical Flow diagram for managing big data focusing telecom industry
Analytics warehouse is the process phase where typically all the analytics take places, such as retrospective analysis. Another important (specially focusing the velocity characteristics of big data) analytics type is Real-time analytics.
Real-Time Analytics:
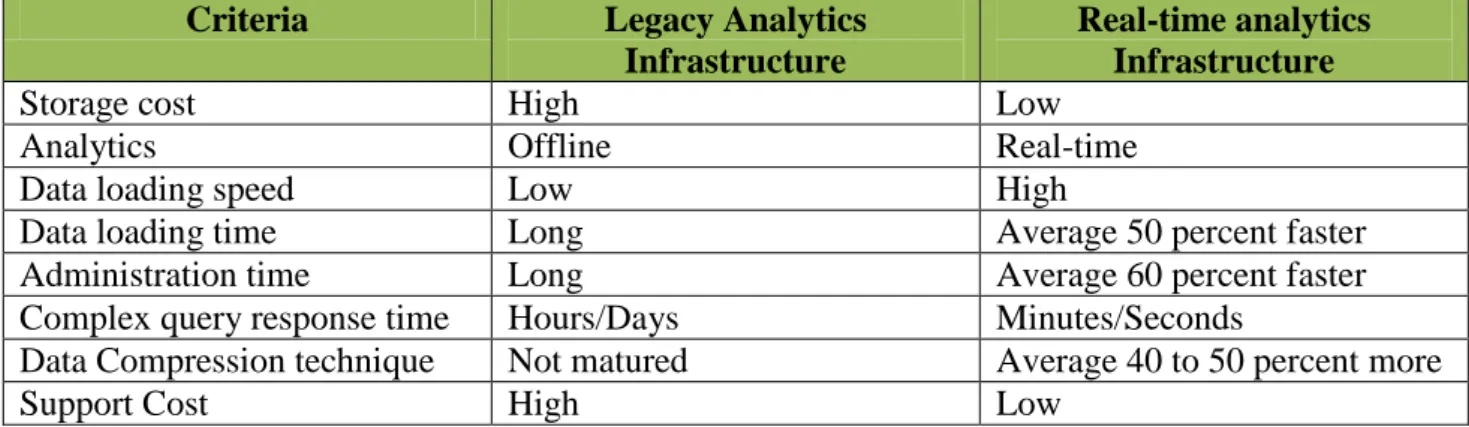
Real-time data analytic refers to the analytics that are able to be accessed as they come into the system. Real-time analytics require the ability to process and analyze parallel streams of data as they come in from the network or from other sources, before they are ever stored in a database. Table 3 shows how telecom operators can gain advantages by implementing real-time analytics infrastructure instead of legacy analytics infrastructure.
19
Criteria Legacy Analytics
Infrastructure
Real-time analytics Infrastructure
Storage cost High Low
Analytics Offline Real-time
Data loading speed Low High
Data loading time Long Average 50 percent faster
Administration time Long Average 60 percent faster
Complex query response time Hours/Days Minutes/Seconds
Data Compression technique Not matured Average 40 to 50 percent more
Support Cost High Low
Table 3: Legacy analytics infrastructure Vs. Real-time analytics infrastructure (Banerjee, 2011)
Figure 13is a survey result, where 65 global operators participated, showing the potential usages of real-time analytics. In the survey 65% of the participants pointed that real-time analytics can be used for operational planning, where 62% of them pointed that the best use of real-time analytics is real-time service assurance. Real-time analytics can also be useful for other analyses, such as price and product mix optimization, conduct advanced analytics and network optimization.
Figure 13: Use of real-time analytics to deliver on defined business objectives for operators
(Banerjee, 2011)
Above discussion, figure, and table implies, that the real-time data analytics can play vital role to meet the business objectives for a network service provider company.
Different organizations are currently offering big data technologies and tools for different steps of the value chain. A big data landscape is presented in Figure 20, Appendix 1A.
20
2.4.
Big data Challenges
Big data also has some significant challenges, some of them are mentioned below:
Storage: The first and foremost challenge of big data is the storing. Traditional data ware houses are not typically made for it. Organizations that are trying to adopt big data strategy need to build a new warehouse, which is capable of storing big data for them.
Complexity: The three dimensions of big data, namely volume, velocity, and variety make
it more complex and challenging to analyze than the other traditional data.
Management: Big data management systems available in the current market are not able to
satisfy the needs of it (Ji, et al., 2012), thus a re-construction of the information framework is needed. Re-organizing the data in this re-constructed frame work is another big challenge.
Preprocessing: Finding out the right data from big amount of data which also have verities
in it, is typically challenging. Big data preprocessing requires collection capability, statistical analysis, and integration capability of large amount of data. Traditional extract-transform-load (ETL) tools are not able to fulfill these requirements.
Analytics: Big data analytic is a highly mathematics intensive analytic modeling exercise which requires proper tools and skilled people. Big data also requires highly capable tools for data visualization, because traditional tools are typically made for small amount of data.
Utilization gap: Christine Moorman stated that the biggest challenge regarding big data is
the Utilization gap (Moorman, 2013). When asked to report the percentage of project in which their companies are using marketing analytics that are available, CMOs report a dismal of only 30% usage rate (Moorman, 2013). In (McGuire, 2013), the hardest challenge of big data is mentioned as, taking the insights generated from the analytics and utilizing them to change the way business operates.
Lack of skilled people: As big data is a new concept and requires newer technologies; there
is a lack of skilled people for it. According to Gartner, big data demand will reach around 4.4 million jobs globally by 2015, with two third of these positions remaining unfilled (Gartner, 2012).
Privacy: In several research studies, privacy concern has defined as the biggest barrier for big data (Kaisler, et al., 2013; Smith, et al., 2012; Demchenko, et al., 2012). When it comes to the customer personal data and how it is used, people generally don’t like surprises. The study (Smith, et al., 2012) shows, how the location data and the social media data are hampering users’ privacy, and the users are not concerned about it. The social media data is
21
being one big topic about the users’ privacy issue in recent days but the user location data being as a privacy issue has not got that much attention yet (Smith, et al., 2012).
Security: Big data security management is also one challenging task. Traditional security mechanisms, which are tailored to secure the small-scale data, are inadequate for it.
Real-time analysis: Big data requires real-time analysis, which is sometimes challenging. Real-time analysis requires high-velocity streaming analysis of big amount of data and typical data analysis tools are incapable of doing so.
Additional challenges: There are more additional challenges regarding big data, such as transportation of data, dynamic design requirement, and scaling.
An organization, before starting big data projects needs to make new policies to mitigate these challenges, and select tools which are truly capable for it. Otherwise, the project acquires a large possibility to be failed in the middle of the process which will cause the organization financial loss.
2.5.
Role of Hadoop in big data
Traditional databases are good at very rapid, interactive queries on moderate and small datasets, but typically run out of stem and can take long time, once the data starts to get very large. On the other hand, Hadoop with its parallel processing is poor at small queries, but is perfect for larger workloads that take large amount of data and more complex queries (Metascale, 2013).
Figure 14: Capability comparison of Hadoop with traditional databases (Metascale, 2013)
Because of Hadoop’s capability of analyzing and storing big amount of data, it is often seen as a synonym for big data. This is why this thesis includes Hadoop description in brief in this chapter.
22
2.5.1. Hadoop Characteristics
The followings best characterize Hadoop:
Hadoop is open source.
Hadoop is scalable. This is one important characteristic of Hadoop that makes it suitable for big data analytics. It allows new nodes to be added as needed, without concerning the data formats or how data is loaded.
Hadoop is flexible, schema-less, and can absorb any types or formats of data. Where traditional databases typically fail to load unstructured data.
Hadoop is fault tolerable. Whenever a node got disabled the systems redirects the process to another location of the data and keep the process running.
Hadoop is fast. It is also able to run parallel processing as big and the background batch jobs in the same server at a time. This saves the user from acquiring additional hardware for a database system to process the data.
2.5.2. Hadoop Architecture
Hadoop architecture consists two main layers, Hadoop distributed file system (HDFS) and MapReduce.
Hadoop distribute file system (HDFS): HDFS is a distributed, scalable and portable file system written in Java. HDFS typically contains one name node and a cluster of data nodes. Each data node serves up blocks of data over the network using a block protocol specifically to HDFS. Each node does not require a data node to be present. HDFS replicates the data across multiple hosts and hence does not require Redundant Array of Independent Disks (RAID) to store, which makes it highly reliable. The term replication value represents the number of nodes the files are stored in. HDFS uses default replication value 3 (Wikipedia, 2013). The data nodes are capable of communicating with each other to rebalance the data, to move copies around and to keep the replication of data high.
MapReduce: MapReduce is a programming model for processing large data sets with a parallel and
distributed algorithm on a cluster. In MapReduce, map performs filtering and storing, and reduce performs a summary operation. In map step master node takes the input or the problem, it then divides the problem into smaller sub-problems and distributes them to the worker node. A worker node also has the capability to divide the sub-problems into several sub-sub-problems and distribute
23
them to other worker nodes under it, which leads to a multi-level tree structure. The worker node processes the smaller problems and passes the answer back to its master node. If all the mapping operations are independent, all maps can be performed in parallel. The same for the reduce parts as well, allowing a distributed parallel processing which can save large amounts of time of the users. Over a period of time to make things simpler, user friendly, and efficient, several other products have been developed around the Hadoop ecosystem.
Figure 15: Hadoop Ecosystem (Pradhan, 2012)
Figure 15shows the current Hadoop ecosystem. Flume is an Apache product which is a distributed, reliable and available service for efficiently collecting, aggregating, and moving large amounts of unstructured data. Sqoop designed for efficiently transferring bulk data between HDFS and relational databases. HBase is distributed, scalable and big data store which is also known as Hadoop database. Apache Pig is an analyzing platform for large data sets. Apache Pig has high level language for expressing data analysis programs. Hive is a data warehouse system for Hadoop. Apache Mahout is a machine learning library which was built to fulfill the goal of building a scalable machine learning libraries. Apache Oozie is the workflow scheduler for Hadoop, which is responsible for managing Apache Hadoop jobs (Apache, 2012).
24
2.5.3. Hadoop’s limitations
Hadoop also has some limitations. The limitations are:
With default replication value 3, Hadoop saves the same data set in three different places. That is why even small data sometimes become big data in Hadoop.
Hadoop has a very limited SQL support (actian, 2012). Lots of companies are already expert on the SQL, and limited SQL support makes Hadoop a bad choice for some of them.
Few experts find MapReduce a challenging framework and the machine learning library Mahout difficult to implement.
Hadoop is not able to do real-time analytics. MapReduce is a batch-based architecture, that means it does not lend itself to use cases which need real-time data access. But recently, with some new tools, such as Storm, Cassandra, and Mongo, Hadoop is getting capable of doing real-time analysis.
Hadoop is not practically a simple technology. Linux and Java skills are critical for making its environment. DBAs will need to learn new skills before they can adopt Hadoop tools. Most importantly, it is also not easy to connect it to legacy systems.
Distributed computing system of Hadoop is a great promise for handling large data, but it lacks the toolset that are familiar with on a single machine (Prekopcsak, et al., 2013). These are why Hadoop is not used in actual tests for this thesis. Many data analysis tools now have Hadoop extensions, which connects them to Hadoop data bases. In this thesis, Hadoop extension will be considered as an important feature while choosing the preprocessing tools.
As a conclusion, big data can be considered as an asset to the organizations. Utilization of proper tools can facilitate the organizations, such as telecom industry getting benefits from their big data in different ways.
25
3.
Big data in Telecom Industry
3.1.
Telecom operators’ data volume growth
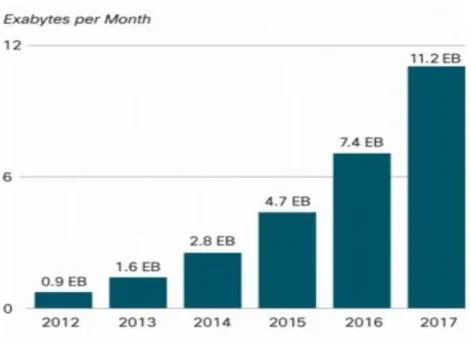
Currently there are little more than 6.2 billion mobile subscriptions worldwide, and this number is predicted to reach 9 billion by 2017 (Ericsson, 2012). With large subscriber base, telecom operators typically need to handle big amount of subscriber data. In addition, every call, internet connection and sending of SMS generates network data for operators. After introduction of smart phones, YouTube, Facebook and possibility of watching TV from the internet, data traffic in operators’ network has increases heavily. According to (Cisco, 2013), monthly global mobile data traffic will surpass 10 exabytes in 2017. The increment of networked devices and applications means more data is being collected than ever before.
In 2011, global mobile data traffic was eight times greater than the total global internet traffic in 2000. More than 50 percent of Facebook users are mobile users, staggering 488 million mobile users (Aginsky, 2012). According to Gartner, 1.8 billion mobile phones were sold and among those 31 percent were smartphones in 2011 (Egham, 2013). According to the Cisco VNI Mobile Traffic Forecast, the typical smartphone generated 35 times mobile data traffic which is around 150MB per month than the typical basic feature cell phone in 2011 (Cisco, 2013).
In 2012, Global mobile data traffic grew 70 percent in 2012 reaching 885 petabytes per month at the end of 2012. Mobile video traffic has exceeded 50 percent for the first time in 2012 and the mobile network connection speeds also been doubled in 2012. Though smartphones were only 18 percent of total global handsets, still 92 percent of total global handset traffic was represented by smartphones (Cisco, 2013). Increasing number of smartphones is going to affect the global network traffic vastly.
Device type Growth in devices, 2012-2017 CAGR (in percentage)
Growth in mobile data traffic 2012-2017 CAGR (in percentage)
Smartphone 20 81
Tablet 46 113
Laptop 11 31
M2M Module 36 89
Table 4: Percentage Comparison table of global device unit growth and global mobile data traffic growth (Cisco, 2013)
With this increment of smart devices usage, consumers are utilizing the network for several purposes. In Appendix 2A, Figure 21demonstrates the expected situation in 2015 regarding certain types of traffic in the network, especially from an individual user’s point of view.
26
In (Cisco, 2013), a forecast of mobile data traffic growth by the year 2017 has been presented and it is as big as 11.2 exabytes per month.
Figure 16: Cisco forecast on mobile data traffic growth by 2017 (Cisco, 2013)
Figure 17: Global total data traffic in mobile networks, 2007-2012 (Ericsson, 2012)
Figure 17 shows, how the amount of data traffic is growing compared with voice traffic in the mobile networks. This also shows that the mobile operator companies are becoming data service
27
provider from only voice service provider. This is making the mobile operators save more and more data.
3.1.1. Data types and Data sources
In telecom industry most of the early big data efforts are targeted at analyzing the existing data such as CDRs, network data and subscriber data. More than half of the operator experts define internal data as the primary source of big data within their organizations (IBM, 2012).
There are three types of data in telecommunications industry form an operator’s point of view, namely Subscriber data, Network data and Call detail record (Weiss, 2005).
Subscriber data
Telecommunication operators typically have millions of subscribers. By necessity this requires maintaining an information database of these subscribers. For example, operator saves the subscriber account information which includes e.g. name and address, billing information including payment methods and details of payment. Subscriber data also includes the information about the connection, disconnection-reconnection and itemized information of the services the subscriber uses. An operator also saves traffic data, such as information identifying the sender and recipient, routing information and online tracing of the communications of an individual subscriber. Subscriber data contains structured, semi-structured, and unstructured data. Subscriber profile data originates from the network systems such as Home Location Register (HLR) or Customer relationship management (CRM).
Network data
Network data is the data generated by the network elements. Nearly all equipment of the telecom network is capable of generating error and status messages, which lead to a large amount of network data. These data contain the timestamp, a string that uniquely identifies the hardware or software component generating the message, and code that explains why the message is being generated. Network data also contains both structured and unstructured data. The alarms or error codes can be categorized as structured data, but the error message if not predefined, is unstructured data.
28
C2S S2C Short Description Unit Long Description Protocol
1 L4 Proto 1/2 1 = TCP, 2 = UDP All
2 38 Protocol 3/4 3 = RTP, 4 = RTCP All
3 39 IP address - Client/Server IP addresses All
4 40 L4 port - TCP/UDP port addresses for the
Client/Server All
5 41 Internal 0/1 1 = internal ip All
6 42 Packets - Number of packets Tstat has seen
belonging to the flow All
7 43 IPG ms Inter Packet Gap (IPG) All
8 44 Jitter AVG ms/ts
Jitter (average):
All - if RTP, computed by Tstat as in
RFC3550 [ms]
- if RTCP, extracted from the RTCP header [codec timestamps units];
- if TCP, computed using only data packets [ms] 9 45 Jitter Max ms/ts Jitter (max) All - if RTP, computed by Tstat as in RFC3550 [ms]
- if RTCP, extracted from the RTCP header [codec timestamps units]
- if TCP, computed using only data packets [ms] 10 46 Jitter Min ms/ts Jitter (min) All - if RTP, computed by Tstat as in RFC3550 [ms]
- if RTCP, extracted from the RTCP header [codec timestamps units]
- if TCP, computed using only data packets [ms]
Table 5: Typical network log file (Tstat, n.d.) Call detail record
Every time a call is placed on the telecommunications network, descriptive information about the call is saved as Call Detail Record (CDR). The number of call detail records that are generated and stored in an operator’s database is large. For example, AT&T (an American multinational telecommunications corporation) long distance customers alone generate over 300 million CDRs per day (Weiss, 2005).
29
Option Value/Example Description
accountcode 12345 account ID
src 12565551212 The calling party’s caller ID number
dst 102 The destination extension for the call
dcontext PublicExtensions The destination context for the call
clid "Big Bird" <12565551212> The full caller ID, including the name, of the calling party.
channel
SIP/0004F2040808-a1bc23ef
The calling party’s channel
dstchannel
SIP/0004F2046969-9786b0b0
The called party’s channel
lastapp Dial The last dial plan application that was executed
lastdata SIP/0004F2046969,30,tT The arguments passed to the last app
start 26.10.2010 12:00 The start time of the call
answer 26.10.2010 12:00 The answered time of the call
end 26.10.2010 12:03 The end time of the call
duration 195 The number of seconds between the start and end times
for the call
billsec 180 The number of seconds between
the answer and end times for the call disposition ANSWERED An indication of what happened to the call
amaflags DOCUMENTATION The Automatic Message Accounting (AMA) flag
associated with this call userfield PerMinuteCharge:0.02 A general-purpose user field
uniqueid 1288112400.1 The unique ID for the src channel
Table 6: Typical CDR Fields (Madsen, et al., n.d.)
With the emerging smartphone usage, operators have come up with another transaction record naming Extended Data Record (XDRs). XDRs capture other transaction records, e.g. purchase history, download and upload history and recharge or payment history.
Telecom operators also store other business data, such as marketing data, billing data, product and service data.
Typical data sources
According to IBM and Said Business School of University of Oxford research, the big data sources for operators are the i) Transactions, ii) Log data, iii) Phone calls, iv) Events, v) Social media, vi) Geospatial, vii) E-mails, viii) External feeds, ix) Free-from text, and x) Sensors (IBM, 2012).
This study describes the typical data sources for operators as follow.
Subscribers are one data source for telecom operators. Telecom operators typically stores petabytes of subscriber data.
30
Network usage is another data source which generates subscribers’ network usage data, such as CDRs, XDRs, Internet Protocol Detail Record (IPDR) and data from Business Support Systems (BSS) or Operational Support Systems (OSS).
Network Elements are generating network data.
Introduction of IoT and M2M is going to increase the number of connected devices to 24 billion by 2020 and most of them are going to use mobile internet services through mobile operators’ network which means lots of data growth for the operators (Malik, 2011). For example, (Karikoski, 2012) presents example of data collected form users’ mobile devices for research purpose.
Type Details
Phone calls Duration in/out, type (in/out/missed)
SMS, MMS No. of messages sent/received, length
Application Foreground usage, installation, background processes
Browsing HTTP traffic
Bluetooth scan Names, MAC addresses
WiFi scan Names, MAC Addresses
Location MCC, MNC, LAC and cell ID
Network session Bearer, IAP, uploads, downloads
Energy Battery and charging status
Table 7: Data types collected by MobiTrack from handset (Karikoski, 2012)
Products & services. When operators offer some services they also create an opportunity to collect the data about the services to analyze e.g. service performance, subscribers’ behavior and target pattern.
In the era of smartphones, social media is creating large amounts of data for the operators. Subscribers are using the mobile network to browse their Facebook, LinkedIn, Yahoo or Google profiles form where data can be collected by the operators.