Atmos. Chem. Phys., 13, 5137–5150, 2013 www.atmos-chem-phys.net/13/5137/2013/ doi:10.5194/acp-13-5137-2013
© Author(s) 2013. CC Attribution 3.0 License.
EGU Journal Logos (RGB)
Advances in
Geosciences
Open Access
Natural Hazards
and Earth System
Sciences
Open AccessAnnales
Geophysicae
Open AccessNonlinear Processes
in Geophysics
Open AccessAtmospheric
Chemistry
and Physics
Open AccessAtmospheric
Chemistry
and Physics
Open Access DiscussionsAtmospheric
Measurement
Techniques
Open AccessAtmospheric
Measurement
Techniques
Open Access DiscussionsBiogeosciences
Open Access Open Access
Biogeosciences
Discussions
Climate
of the Past
Open Access Open Access
Climate
of the Past
Discussions
Earth System
Dynamics
Open Access Open Access
Earth System
Dynamics
DiscussionsGeoscientific
Instrumentation
Methods and
Data Systems
Open Access
Geoscientific
Instrumentation
Methods and
Data Systems
Open Access DiscussionsGeoscientific
Model Development
Open Access Open Access
Geoscientific
Model Development
DiscussionsHydrology and
Earth System
Sciences
Open AccessHydrology and
Earth System
Sciences
Open Access DiscussionsOcean Science
Open Access Open Access
Ocean Science
DiscussionsSolid Earth
Open Access Open Access
Solid Earth
Discussions
Open Access Open Access
The Cryosphere
Natural Hazards
and Earth System
Sciences
Open Access
Discussions
Automated thunderstorm tracking: utilization of three-dimensional
lightning and radar data
V. K. Meyer1,*, H. H¨oller1, and H. D. Betz2,3
1Deutsches Zentrum f¨ur Luft- und Raumfahrt, Institut f¨ur Physik der Atmosph¨are, Oberpfaffenhofen, 82234 Wessling, Germany
2University of Munich, Department of Physics, 85748 Garching, Germany 3nowcast GmBH, 81377 Munich, Germany
*now at: Zentralanstalt f¨ur Meteorologie und Geodynamik, 1190 Vienna, Austria Correspondence to: V. K. Meyer ([email protected])
Received: 22 September 2012 – Published in Atmos. Chem. Phys. Discuss.: 22 January 2013 Revised: 18 April 2013 – Accepted: 22 April 2013 – Published: 22 May 2013
Abstract. This paper presents a new hybrid method for au-tomated thunderstorm observation by tracking and moni-toring of electrically charged cells (ec-TRAM). The devel-oped algorithm combines information about intense ground precipitation derived from low-level radar-reflectivity scans with three-dimensionally resolved lightning data, which are provided by the European VLF/LF lightning detection net-work LINET. Based on the already existing automated radar tracker rad-TRAM (Kober and Tafferner, 2009), the new method li-TRAM identifies and tracks electrically active re-gions in thunderclouds using lightning data only. The algo-rithm ec-TRAM uses the output of the two autonomously operating routines rad-TRAM and li-TRAM in order to as-sess, track, and monitor a more comprehensive picture of thunderstorms. The main motivation of this work is to assess the benefit of three-dimensionally resolved total lightning (TL) information for thunderstorm tracking and monitoring. The focus is laid on the temporal development whereby TL is characterized by an effective in-cloud (IC) and cloud-to-ground (CG) event discrimination. It is found that the algo-rithms li-TRAM and ec-TRAM are both feasible methods for thunderstorm monitoring with potential for nowcasting. The tracking performance of li-TRAM turns out to be compara-ble to that of rad-TRAM, a result that strongly encourages utilization of lightning data as independent data source for thunderstorm tracking. It is found that lightning data allow an accurate and close monitoring of storm regions with in-tense internal dynamics as soon as convection induces elec-trical activity. A case study shows that the current short-term
storm dynamics are clearly reflected in the amount of strokes, change of stroke rates and IC/CG ratio. The hybrid method ec-TRAM outperforms rad-TRAM and li-TRAM regarding reliability and continuous assessment of storm tracks espe-cially in more complexly developing storms, where the use of discharge information contributes to more detailed infor-mation about storm stage and storm evolution.
1 Introduction
Hazardous impacts of thunderstorm-related phenomena like heavy rain, hail, and lightning strikes render short-term pre-diction (nowcasting) of thunderstorm propagation and evo-lution an important issue for weather-related dangers. Storm monitoring as accurate as possible and a better understanding of the driving processes, together with a well-set monitoring of crucial storm parameters, can contribute to improve the prediction of extreme non-linear developments.
Until recently, radar and satellite data were the common data sources for operational tracking and short-term now-casting of thunderstorms, since they allow the detection and monitoring of storms over time and provide useful local in-formation about the storm structure and development (Soul et al., 2002; Hering et al., 2004; Forster and Tafferner, 2009; Rossi et al., 2010). Lightning information is used primar-ily as an additional data source to obtain a more compre-hensive picture about the development stage of a storm. Es-pecially the onset and magnitude of electrical activity can
be objectively assessed, which otherwise can only be esti-mated from indirect parameters such as certain thresholds in radar reflectivity. In most previous studies, lightning events are considered only within a pre-identified cell volume de-fined by other data sources (Soul et al., 2002; Yeung et al., 2007; Forster and Tafferner, 2009; Sieglaff et al., 2013).
Due to the evolution of more efficient and more accurate lightning detection systems, general use of lightning data in-creases steadily. The data are especially interesting for mon-itoring of severe storms in regions where no or insufficient other high-resolution data are available for observation of deep convection, for example over the Mediterranean Sea (Price et al., 2011; Kohn et al., 2010), in data-sparse areas of the Alps (Bertram and Mayr, 2004), and for tropical cyclones over oceans (Demetriades and Holle, 2006). Because of low detection efficiencies in the areas of interest, these studies are restricted to persistent, long-lived storm types with strong electrical discharges. Some studies exist where lightning data and radar data were both used as independent, complemen-tary data sources for thunderstorm tracking (Steinacker et al., 2000) and nowcasting (Rossi et al., 2010).
Since 2005 the new VLF/LF lightning detection network LINET (Lightning Location Network (Betz et al., 2009)) has provided operational lightning data in real time. LINET al-lows accurate localization with a statistical average error of down to 100 m inside a network, and high detection effi-ciency by reporting weak strokes with range-normalized cur-rents as low as a few kA. By employing an advanced modifi-cation of the commonly used time-of-arrival (TOA) method, LINET calculates the emission height of a discharge source in addition to the two-dimensional location (latitude and lon-gitude). This allows for a consistent discrimination between in-cloud and cloud-to-ground strokes that is independent of stroke parameters (e.g. like peak current and amplitude).
This paper focuses on three aspects: (1) the usefulness and performance of identifying and tracking thunderstorms based on lightning data alone and compared to conventional track-ing ustrack-ing radar data, (2) the further improvement of thun-derstorm nowcasting by a hybrid lightning and radar method (ec-TRAM), and (3) the comprehensive in-cloud and cloud-to-ground event discrimination.
The cell tracking algorithms described in this paper are based on a method that has been introduced with the satellite data-based cloud tracker Cb-TRAM by Zinner et al. (2008) and further applied to radar data (Kober and Tafferner, 2009). The tracking method identifies continuous regions of a spe-cific character (e.g. intensified precipitation) as individual cell objects. A pixel-based displacement vector field is calcu-lated by using the pyramidal image matching method, which has been introduced by Zinner et al. (2008). The cells are then extrapolated and tracked by employing the displacement vector field. Both algorithms have proven to be useful tools for thunderstorm nowcasting, which are capable of identify-ing and trackidentify-ing persistent storm cells over time. Their good performance encourages the application of this method to
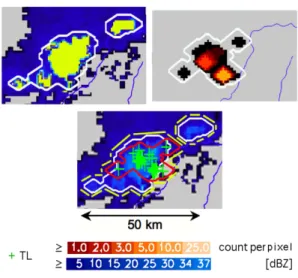
Fig. 1. Illustration of the ec-TRAM cell identification. Upper left: radar cells (white contours) identified by rad-TRAM based on a two-dimensional radar reflectivity field (blue shaded with reflec-tivity values above the detection threshold coloured yellow). Upper right: lightning cells (white contour) identified by li-TRAM based on a two-dimensional lightning frequency map (red shaded). Lower panel: overlay of radar cells and lightning cells with the cell out-lines, identified by ec-TRAM, drawn yellow in dashed line style. The lower ec-TRAM cell consists of a radar cell (white contour) and a lightning cell (red contour). The upper ec-TRAM cell con-sists of a radar cell only. TL events are marked by green crosses.
lightning data. In this paper, the output of all three storm cell trackers is combined and the mutual benefit discussed.
2 Methods and data 2.1 Concept ec-TRAM
Ec-TRAM is designed to identify, track, and monitor thun-derstorms based on convective precipitation and lightning patterns. The algorithm consists of two separately operating basic routines: one for radar-detected precipitation and one for lightning patterns. They independently identify, track, and monitor intense ground precipitation regions and elec-trically active areas. Based on the radar-cell tracking algo-rithm rad-TRAM (tracking and monitoring of radar cells) as described in Kober and Tafferner (2009), intense ground pre-cipitation fields are identified by analysing low-level radar scans. The lightning-cell tracking algorithm li-TRAM (track-ing and monitor(track-ing of lightn(track-ing cells) is used to identify electrically active storm regions by analysing lightning data. In the following, a cell object identified by rad-TRAM is termed radar cell, while a cell object identified by li-TRAM is termed lightning cell. For each time step the ec-TRAM routine combines the information of corresponding radar and lightning cells by searching for spatial overlaps of con-temporary cell objects (Fig. 1). A cell object that is finally
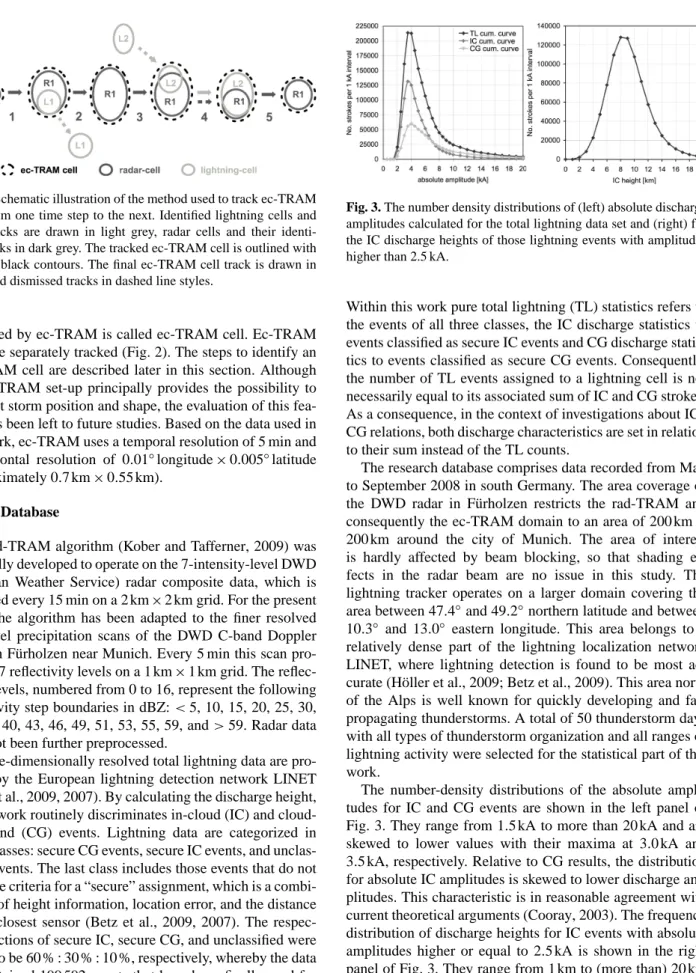
Fig. 2. Schematic illustration of the method used to track ec-TRAM cells from one time step to the next. Identified lightning cells and their tracks are drawn in light grey, radar cells and their identi-fied tracks in dark grey. The tracked ec-TRAM cell is outlined with dashed, black contours. The final ec-TRAM cell track is drawn in a full and dismissed tracks in dashed line styles.
identified by ec-TRAM is called ec-TRAM cell. Ec-TRAM cells are separately tracked (Fig. 2). The steps to identify an ec-TRAM cell are described later in this section. Although the ec-TRAM set-up principally provides the possibility to nowcast storm position and shape, the evaluation of this fea-ture has been left to fufea-ture studies. Based on the data used in this work, ec-TRAM uses a temporal resolution of 5 min and a horizontal resolution of 0.01◦longitude×0.005◦latitude (approximately 0.7 km×0.55 km).
2.1.1 Database
The rad-TRAM algorithm (Kober and Tafferner, 2009) was originally developed to operate on the 7-intensity-level DWD (German Weather Service) radar composite data, which is provided every 15 min on a 2 km×2 km grid. For the present study the algorithm has been adapted to the finer resolved low-level precipitation scans of the DWD C-band Doppler radar in F¨urholzen near Munich. Every 5 min this scan pro-vides 17 reflectivity levels on a 1 km×1 km grid. The reflec-tivity levels, numbered from 0 to 16, represent the following reflectivity step boundaries in dBZ:<5, 10, 15, 20, 25, 30, 34, 37, 40, 43, 46, 49, 51, 53, 55, 59, and>59. Radar data have not been further preprocessed.
Three-dimensionally resolved total lightning data are pro-vided by the European lightning detection network LINET (Betz et al., 2009, 2007). By calculating the discharge height, the network routinely discriminates in-cloud (IC) and cloud-to-ground (CG) events. Lightning data are categorized in three classes: secure CG events, secure IC events, and unclas-sified events. The last class includes those events that do not meet the criteria for a “secure” assignment, which is a combi-nation of height information, location error, and the distance to the closest sensor (Betz et al., 2009, 2007). The respec-tive fractions of secure IC, secure CG, and unclassified were found to be 60 % : 30 % : 10 %, respectively, whereby the data set contained 199 592 events that have been finally used for this study (after the preselection described in the following).
Fig. 3. The number density distributions of (left) absolute discharge amplitudes calculated for the total lightning data set and (right) for the IC discharge heights of those lightning events with amplitudes higher than 2.5 kA.
Within this work pure total lightning (TL) statistics refers to the events of all three classes, the IC discharge statistics to events classified as secure IC events and CG discharge statis-tics to events classified as secure CG events. Consequently, the number of TL events assigned to a lightning cell is not necessarily equal to its associated sum of IC and CG strokes. As a consequence, in the context of investigations about IC– CG relations, both discharge characteristics are set in relation to their sum instead of the TL counts.
The research database comprises data recorded from May to September 2008 in south Germany. The area coverage of the DWD radar in F¨urholzen restricts the rad-TRAM and consequently the ec-TRAM domain to an area of 200 km× 200 km around the city of Munich. The area of interest is hardly affected by beam blocking, so that shading ef-fects in the radar beam are no issue in this study. The lightning tracker operates on a larger domain covering the area between 47.4◦and 49.2◦northern latitude and between 10.3◦ and 13.0◦ eastern longitude. This area belongs to a relatively dense part of the lightning localization network LINET, where lightning detection is found to be most ac-curate (H¨oller et al., 2009; Betz et al., 2009). This area north of the Alps is well known for quickly developing and fast propagating thunderstorms. A total of 50 thunderstorm days with all types of thunderstorm organization and all ranges of lightning activity were selected for the statistical part of this work.
The number-density distributions of the absolute ampli-tudes for IC and CG events are shown in the left panel of Fig. 3. They range from 1.5 kA to more than 20 kA and are skewed to lower values with their maxima at 3.0 kA and 3.5 kA, respectively. Relative to CG results, the distribution for absolute IC amplitudes is skewed to lower discharge am-plitudes. This characteristic is in reasonable agreement with current theoretical arguments (Cooray, 2003). The frequency distribution of discharge heights for IC events with absolute amplitudes higher or equal to 2.5 kA is shown in the right panel of Fig. 3. They range from 1 km to (more than) 20 km with a maximum occurrence between 8 km and 9 km.
Discharge parameters show local sensitivity variations due to non-uniform sensor spacing. This circumstance has an in-fluence on the local detection threshold of stroke currents (decreasing with distance from the sensors) and the mini-mum detectable stroke height (increasing with distance from the sensors). Consequently, as a thunderstorm propagates through the selected domain, the monitored lightning-cell pa-rameters would vary not only because of natural evolution but also because of local variations of detection efficiency. In order to achieve a monitoring that is quite independent of network geometry, the lowest stroke current was searched for that could be detected and reported in the entire area of study. It turned out that this current amounts to 2.5 kA; accordingly, all reported strokes with currents larger than 2.5 kA were in-cluded in the study. About 92 % of the CG and 90 % of the IC events of the total data set meet that criterion. They comprise the data set, which has been used for lightning-cell tracking and analyses. In an analogous procedure, a minimum IC dis-charge height of 5.0 km was introduced. This threshold has only been applied after the cell identification in order to fa-cilitate reliable IC mean height analyses. About 90 % of all IC events with absolute amplitudes larger than 2.5 kA meet this criterion and could be used for IC discharge height anal-yses. Although some unrealistically high altitudes can result for IC strokes in the immediate vicinity of sensor sites, the maximum values of IC discharge heights can be considered sufficiently insensitive to the network constellation, so that no maximum threshold for IC discharge heights is consid-ered to be necessary.
2.1.2 Procedural steps
The tracking routines rad-TRAM and li-TRAM are based on similar working principles first introduced by the thunderstorm-tracking algorithm Cb-TRAM, which relies on satellite data (Zinner et al., 2008). In the following, the pro-cedural steps are outlined and special adjustments and differ-ences are explained. More information can be found in Kober and Tafferner (2009) and Zinner et al. (2008).
Step 1: two-dimensional intensity maps
Two different methods are used for the processing of radar data and lightning data. Principally, a time sequence of two-dimensional intensity patterns is retrieved from the primary data source, which captures the temporal evolution and mo-tion of the tracked features. The value of the original grid is allocated to the nearest pixels on the ec-TRAM grid. Within the lightning-cell tracker li-TRAM, on the other hand, light-ning cells are identified based on spatially and temporally clustered lightning data, which are mapped on lightning-frequency maps. Out of the preprocessed lightning data sam-ple (described in the previous section), every 2.5 min the accumulated lightning data from the preceding 3 min are mapped on the basic ec-TRAM grid. Hereby, each stroke
event is allocated to the nearest grid point. Then the total number of events is determined for each grid point (pixel). To identify and outline electrically active regions, the pixel-wise information is spread to circular shaped spots with 7 pixels (approximately 4.5 km) in diameter. Each pixel within this spot is assigned the value of the centre pixel. To finally gen-erate a lightning intensity map spots with higher values are plotted over spots with lower values, thereby partly covering areas of lower values (see the middle panel of Fig. 1 and the map shown in Fig. 8).
Step 2: displacement vector field
A general displacement vector field is calculated by applying the pyramidal image matching method (Zinner et al., 2008) on two subsequent intensity maps (see step 1). The motion of small-scale features is often superimposed on a large-scale flow. Following a pyramidal scheme the matcher optimizes cost functions in successively refined resolution levels until the full resolution is reached. In this way a pixel based dis-placement vector field is derived, which includes large-scale as well as small-scale motions. The highest pyramidal level has been set to 2, so that by applying a search radius of 2N+2 a square box of 16 pixels is searched for matching patterns. This setting works for cell motions up to 140 km h−1. The Gaussian kernel, which is used to smooth the pattern field before the pattern matching, has a diameter of 7 pixels. Step 3: fields of interest
The fields of interest, e.g. areas of strong precipitation or with electrical activity, are identified and individually marked as cell objects. To identify regions of intense precipitation, the reflectivity levels are replaced by the respective radar reflec-tivity; thus the radar-intensity map of step 1 is transformed to a radar-reflectivity map. Patterns are smoothed by convolv-ing with a 5 pixels×5 pixels (approximately 3.5 km×3.5 km), normalized and rotationally symmetric Gaussian filter. Based on the smoothed radar-reflectivity map, coherent reflectivity areas of four or more pixels, which exceed a threshold of 33 dBZ, are identified as radar cells (see left panel of Fig. 1). Coherent areas on the lightning-frequency map with min-imum discharge activity of 1 event(3 min)−1 are identified and outlined. Initially, every single event is a priori recorded as lightning cell in order not to miss the onset of electrical ac-tivity. However, appropriate selection criteria have been ap-plied later in accordance with the needs of the considered analysis problem. According to step 1 the effective search ra-dius to cluster discharge events to cells is 7 pixels or approx-imately 4.5 km (see middle panel of Fig. 1). The cell outlines are defined as the identified area, extended by 3 pixels (ap-proximately 2.0 km), so that close cells, which most likely do not develop independently, are combined. It can be seen in Fig. 1 (left and middle panel) that the identified regions are generously outlined and also include values below the
identification thresholds. This extension is reasonable con-sidering the underlying aspect of warning for hazardous po-tential. Based on these cell objects, cell parameters are finally calculated.
Step 4: cell linking
The tracking and monitoring procedure (TRAM) links de-tected cell objects from different time steps and stores the cell patterns in individual cell log files. In order to pursue radar cells from one time step to the next, the radar displacement vector field is applied to radar cells identified in the previous time step. In this way it becomes possible to calculate a first-guess of the cell positions for the next time step. Cells of two subsequent time steps are linked by identifying overlapping areas between first-guess and newly identified radar cells. Lightning cells are tracked over time by simply identifying spatial overlaps between previously and currently identified cell objects. Since every 2.5 min discharge events of the last 3 min are used to cluster lightning cells, a time overlap exists in the lightning data, which is used to identify lightning cells in two consecutive time steps. A persistent and active light-ning cell would be identified by some identical events in two consecutive time steps, which ensure a spatial overlap. The time step of 2.5 min is half of the radar and ec-TRAM time step, so that it allows a comparison of time-coincident radar and lightning cells in each ec-TRAM time step.
Step 5: spatial cell prognoses
Nowcasting of cell position and shape of current cells for future time steps can be calculated by repeated application of the displacement vector field on the currently identified cells.
2.1.3 Tracking method ec-TRAM
The TRAM routine creates separate log files for ec-TRAM cells which link the respective radar- and lightning-cell log files, generated in step 3, so that the original lightning-cell information remains always accessible. A relational 1:n:m database concept has been introduced to facilitate the imple-mentation. In the ec-TRAM log files, additional ec-TRAM cell features are recorded. To track one ec-TRAM cell from one time step to the next, first already identified tracks of lightning cells and radar cells are looked for, which are part of the current ec-TRAM cell complex. If such a track ex-ists, the current ec-TRAM cell complex is connected to the previous ec-TRAM cell complex, from which this cell track originates. If no track can be found to connect the current ec-TRAM cell to an ec-TRAM cell of the previous time step, the cell is considered as newly and independently grown, and a new cell number with a new cell log file is assigned. If no track can be found to pursue an ec-TRAM cell of the previ-ous time step to a current ec-TRAM cell, the cell is consid-ered as dissipated and the respective log file is closed. If more
than one possible cell track is found, the cell with the largest area is chosen to pass over the ec-TRAM cell number. Cell splitting and merging processes in ec-TRAM are handled in the same way as in rad-TRAM and li-TRAM. The scheme in Fig. 2 illustrates this method. The exemplary ec-TRAM cell track starts with the first detection of radar cellR1. The track of radar cellR1 determines the ec-TRAM track at link 1, 2, 3, and 5. At link 2, 3, and 4 more than one possible cell link-age exist. In all cases the track of the cell with the largest area determines the ec-TRAM cell track. At link 2 (cell splitting) and 3 (cell merging), the cell track of the smaller lightning cellL1 (dashed light grey arrow) is dismissed. At link 4 the cell track of the bigger lightning cellL2 determines the ec-TRAM cell track (indicated by the fully drawn light grey ar-row) and not the track of the radar cellR1 (dashed dark grey arrow).
The possibility of spatial cell nowcasting of ec-TRAM cells has not been considered here, because it is not within the scope of the present study.
2.2 Additional data sources
In order to evaluate the information content of cell param-eters assessed by the ec-TRAM method and to exploit the benefit of a combined usage of radar, lightning and satel-lite data, time series of selected thunderstorms were com-plemented with additional information derived from three-dimensional polarimetric radar and satellite data. Volumet-ric radar data have been provided by the German Aerospace Center (DLR) C-band radar POLDIRAD (polarization diver-sity Doppler radar; Schroth et al., 1988). Selected horizontal PPI (plan position indicator) and vertical RHI (range height indicator) scans, and information about the hydrometeor dis-tribution, derived by using the hydrometeor scheme devel-oped by H¨oller et al. (1994), were used to assess the three-dimensional storm dynamics and the microphysical storm development. Special focus is laid on reliable graupel and hail information in the mixed-phase layer and at the ground. Derived from satellite data, the three cell stages, convection initiation (or strong local development), rapid development (or rapid cooling), and mature thunderstorm in which cell objects are routinely classified by Cb-TRAM, are included in the comparison. A detailed description of the exact detec-tion and classificadetec-tion criteria can be found in Zinner et al. (2008). The respective Cb-TRAM cell tracks were manually selected.
3 Results
3.1 Cell identification and tracking performance of ec-TRAM
The principal approach of ec-TRAM is to correlate the two-dimensional part of the three-two-dimensionally distributed light-ning clusters with two-dimensional precipitation features
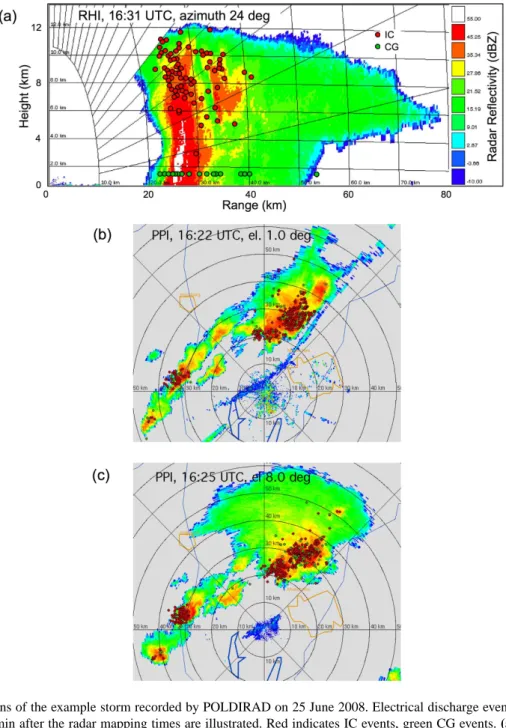
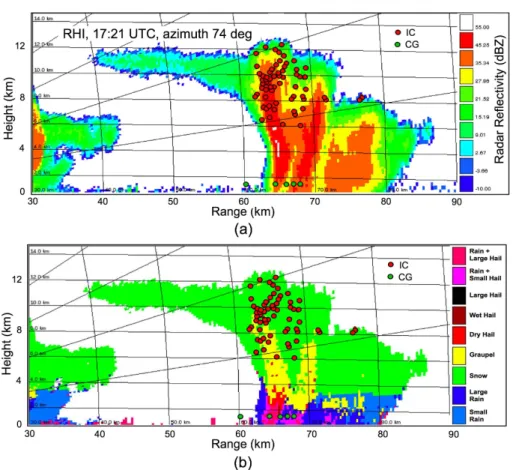
Fig. 4. Reflectivity scans of the example storm recorded by POLDIRAD on 25 June 2008. Electrical discharge events recorded by LINET from 2 min prior to 2 min after the radar mapping times are illustrated. Red indicates IC events, green CG events. (a) RHI scan. To better visualize distant CG events, the LINET ground strike points are plotted at 1.5 km height. (b) PPI scan recorded with an elevation angle of 1◦. (c) PPI scan recorded with an elevation angle of 8◦.
near the ground via spatial overlap of two-dimensional light-ning and radar cells. To verify the ec-TRAM approach in a first step, the structures of radar reflectivity in some selected thunderstorms at different development stages and at differ-ent synoptic conditions have been overlaid with their electri-cal activity represented by discharge events from 2 min prior to 2 min after the radar scanning time. The example shown in Fig. 4 illustrates the possibility of correlating lightning and precipitation cells with the ec-TRAM method. The case refers to a thunderstorm that developed on 25 June 2008 in an
environment characterized by high wind speeds and strong non-directional wind shear. It can be seen in the cross-section scan presented in Fig. 4a that IC discharges were recorded in regions of moderate reflectivity, associated with the storm cores, and preferentially in areas where reflectivity changes from moderate to high values. The vertical section given in Fig. 4a and the low-level scan given in Fig. 4b show that CG events appear in close vicinity of the high reflectivity ground pattern. Both PPI radar scans recorded at elevation angles of 1◦(Fig. 4b) and 8◦(Fig. 4c) illustrate clearly that TL activity
is found mostly in regions of high reflectivities and, there-fore, can indeed be associated with high reflectivity ground pattern of the same thunderstorm via spatial overlap. In con-trast to lightning data, which are accumulated over a longer time span, radar data capture rather one moment in the storm evolution. The slight displacement between the lightning ac-tive regions and the high reflectivity regions, as observed in the PPI scans, is due to the evolution (including tilting) the storm experiences during the accumulation time of the light-ning data. This example illustrates that even for a high-shear environment the TL pattern and the ground precipitation field have sufficient overlap so that the ec-TRAM approach works properly.
In order to achieve proper cell definitions for radar and lightning cells, three aspects have to be considered. Firstly, efficient cell assignment must be achieved, which means that as many cells as possible are to be attributed to cells of the complementary cell type. Secondly, cell overlap for both cell types must be maximized to ensure a good cell assign-ment efficiency with simultaneous preservation of reasonable cell sizes. Thirdly, reliable storm detection with a physically plausible appearance of all three cell types (lightning cells, radar cells, and ec-TRAM cells) and a satisfying tracking performance of ec-TRAM must be achieved. These rather broadly defined aspects have been verified visually in several case studies.
By fulfillment of the first two aspects and consideration of the third aspect, it was found adequate to employ a fixed reflectivity threshold for identification of radar cells, namely 33 dBZ. This threshold is supposed to be low enough to de-tect the rain fields of thunderstorms at quite an early stage, and to be high enough to distinguish separate precipitation cores in stratiform rain regions. Lightning cells are clustered by using lightning data of 3 min and applying a search ra-dius of 6 km. This set-up might occasionally miss outliers, but electrically active cores are identified well and enveloped by reasonably large contours. Finally, the best accumulation time interval has been found to end with the corresponding radar mapping time. With this cell identification set-up, 82 % of all lightning cells could be assigned to time-correlated radar cells, and 52 % of all radar cells could be assigned to time-correlated lightning cells for the 25 June 2008 cases. Likewise, 60 % (35 %) of the cell area of all those lightning cells (radar cells), which could be assigned to radar cells (lightning cells), overlapped with the area defined for radar cell (lightning cell), respectively.
A thunderstorm can experience a complex development. It may consist of more than one updraft core, where old cores dissipate while new cores develop nearby (multi-cell storms). Since cell identification criteria are more or less arbitrary, it is a challenge for each algorithm to track such a storm con-sistently. The purpose of ec-TRAM is to identify the overall storm features with the emphasis to track these entities as successful as possible during their entire development stages while recording their temporal evolution.
(a)
(b)
(c)
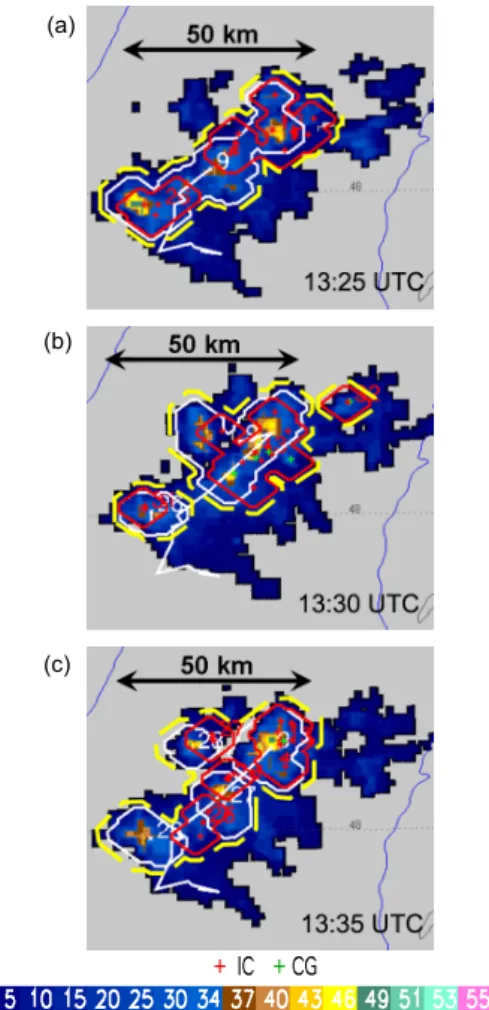
Fig. 5. Ec-TRAM snapshots showing a time sequence of the ex-ample storm recorded on 15 May 2008. Cell contours, cell centres, cell numbers, and the ec-TRAM cell tracks are shown. Lightning-cell parameters are red, radar-Lightning-cell parameters white coloured. The cells identified and tracked by ec-TRAM are highlighted by yel-low dashed contours. The real outlines folyel-low exactly the and lightning-cell outlines. In this sequence, the identified radar-cell tracks determine the tracks recorded by ec-TRAM and therefore are drawn white. Electrical discharge events of 3 min are indicated, CG events by green, IC events by red crosses. This storm undergoes an exceptionally complicated evolution, including multi-component cell structures (b) and several simultaneous cell splitting (a to b) and merging processes (b to c).
The time sequence shown in Fig. 5 is selected to demon-strate the performance of ec-TRAM based on a storm which was tracked on 15 May 2008 from 12:35 UTC to 15:55 UTC. It can be seen from the cell conglomerates shown in Fig. 5 that one ec-TRAM cell can include more than one internal intensity core. The entire time sequence shows that single lightning and precipitation cells split and merge due to their identification criteria. Although smaller cell constituents are sometimes missed, it can be inferred in the whole time loop of the storm (not shown) that ec-TRAM succeeds in moni-toring a coherent and reasonable storm track. The ec-TRAM
maps show that the cell constituents behave as a combined entity. Looking into detail it can be inferred that rad-TRAM would have lost the storm track once, li-TRAM twice. This case study shows that cell objects, as assessed by ec-TRAM, comprise physically reasonable active discharge and precipi-tation regions of a thunderstorm.
The example storm from 15 May 2008 shows an unusual and unsteady cell evolution. It has been selected because it allows the discussion of the strengths as well as the weak-nesses of ec-TRAM. It has to be pointed out that the major-ity of storm life cycles recorded by ec-TRAM have a simpler cell structure and undergo a much less complex cell devel-opment, making it easier for ec-TRAM to achieve a com-plete picture of the storm evolution. For the total data set recorded during summer 2008, it was found that the vast ma-jority of ec-TRAM cells (73 %), which comprise both radar-cell and lightning-radar-cell components, consists of exactly one radar and one lightning cell. A total of 16 % consists of one radar cell and two or more lightning cells with, on average, 2.4 lightning cells per radar cell, while 5 % consist of one lightning cell and two or more radar cells with, on average, 2.1 radar cells. Only the residual 6 % consist of a conglomer-ate of two or more lightning cells and two or more radar cells. In comparison, out of the 25 cell entries which are recorded as mixed cell type in the example storm, only 50 % consist of one radar and one lightning cell, whereas 16 % consist of one radar and two or more lightning cells, and 32 % consist of two or more radar and two or more lightning cells, a picture which is highlighted in Fig. 5b.
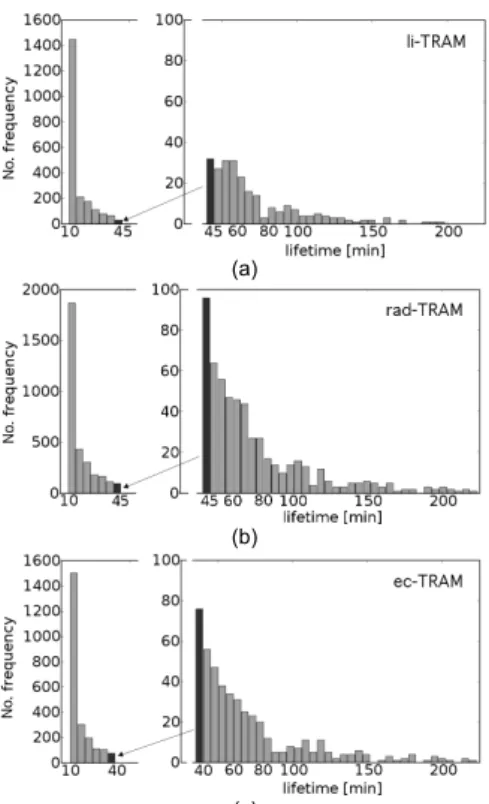
The storm track from 15 May 2008 shows a typical exam-ple of the observation that the ec-TRAM approach achieves a more coherent and reasonable cell tracking than it would have been achieved with rad-TRAM, based on radar data alone, or li-TRAM, based solely on lightning data. To illus-trate this statement, the lifetime distributions are compared for all cell tracks recorded during the convective season in 2008 by the three tracking routines li-TRAM, rad-TRAM, and ec-TRAM. The full lifetime frequency distributions are shown in Fig. 6. This study considers only completely as-sessed life cycles. Incomplete cell tracks, which pass the do-main boundaries, as well as cell tracks which emerge from a cell splitting process or disappear in a cell merging pro-cess are excluded from the analysis. In general, all three life-time distributions of Fig. 6 follow a strongly declining ex-ponential function. While short-lived cells generally consti-tute a large fraction, some small fraction of short-lived cell tracks might be explained by shortcomings of the tracking algorithm, e.g. track artefacts, outliers, dissipating large cells with decreasing reflectivity values which eventually fall be-low the cell identification threshold splitting into two or more distinct subcells, or by yet unrecognised insufficiencies of the algorithm. To facilitate an analysis of the more important long-lived cells, the distribution functions are also illustrated as box-and-whisker plots complemented by the mean life-times in Fig. 7. Hereby, a threshold of a minimum lifetime of
(a)
(b)
(c)
Fig. 6. Cell lifetime frequency distribution of completely assessed cell tracks for (a) lightning cells recorded by li-TRAM, (b) radar cells recorded by rad-TRAM, and (c) cells recorded by ec-TRAM. The number of solitude cell entries is for li-TRAM 6080, rad-TRAM 4565, and ec-rad-TRAM 3480. In all three distributions the number of cells with lifetimes up to 55 min is shown on separate scales.
35 min was set; we note that this condition excludes most of the small and weak cells that are not of primary interest here. Figure 7a illustrates the lifetime distributions for completely recorded cell tracks. It can be seen that the lifetime distri-bution of lightning-cell tracks is shifted to slightly smaller values compared to the lifetimes of radar and ec-TRAM cell tracks, which have almost similar characteristics. With a side length of 200 km (the diagonal is 283 km), fast propagating storms with velocities around 80 km h−1would need 150 min to 240 min to cross the domain. Since long-lived storms are most likely fast propagating, they are under-represented in the statistics (also compare Fig. 6). This is why lifetime dis-tributions which consider all cell tracks, with the inclusion of incompletely recorded ones, are presented in Fig. 7b. It can be seen that the statistical means and medians are still domi-nated by the occurrence of short-lived storms. But while for lightning-cell and radar-cell tracks, the lifetime distributions hardly change in comparison to the corresponding cases in Fig. 7a, the lifetime distribution for tracks assessed by ec-TRAM is shifted to somewhat, yet not significantly, higher values. Still, this might be an indication that the research do-main is large enough to assess complete tracks for radar and
(a) (b)
Fig. 7. Comparison between lifetime frequency distributions for cell tracks recorded by li-TRAM, rad-TRAM, and ec-TRAM. The min-imum duration is set to 35 min (see text). The median, 25th, and 75th quantile are plotted as red-blue box-and-whisker plots com-plemented by the mean values marked as green diamonds. Distri-butions are shown for (a) completely assessed cell tracks and (b) all recorded cell tracks comprising complete and incomplete tracks. Total number of tracks used for the calculation is written below the respective labelling.
lightning cells, but too small to assess complete tracks gener-ated by ec-TRAM, which restricts the sample of completely assessed tracks to shorter values. Investigating the cell position of a total of 4427 cell records, which belong to com-pletely assessed life cycles recorded by ec-TRAM with life-times longer than 35 min, 52 % of the single entries are mixed cells which consist of both cell types. A total of 46 % con-sists of only one radar cell and 2 % of only one lightning cell. While 10 % (4 %, 0 %) of all lightning-cell tracks which were tracked for at least 10 min (15 min, 20 min) are not correlated with any contemporary radar cell, a noticeable fraction of 57 % (52 %, 39 %, 31 %, 0 %) of all radar-cell tracks which were tracked for 10 min and longer (15 min, 25 min, 35 min, 70 min) could not be related to any contemporary lightning cell.
Investigating the character of cell type changes within ec-TRAM cell tracks, it is found for 383 cell tracks with life-times of 35 min and longer that 72 % start as pure radar cell and change later to a mixed cell, while 24 % start as a mixed cell, where 20 % subsequently change to a pure radar cell and 4 % to a pure lightning cell. Remarkably, as many as 4 % start as pure lightning cell without giving rise to low-level radar reflectivity above 33 dBZ, and change in the following to a mixed cell. Regarding the last cell type change recorded be-fore the cell dissipates, it is found that, in 392 cell tracks with lifetimes of 35 min and longer, 68 % change from a mixed cell to a radar cell before they dissipate. Out of the 20 %, which end as mixed cells, 17 % change from a pure radar cell and 3 % change from a pure lightning cell to a mixed cell. Finally, 12 % change from a mixed cell to a pure lightning cell.
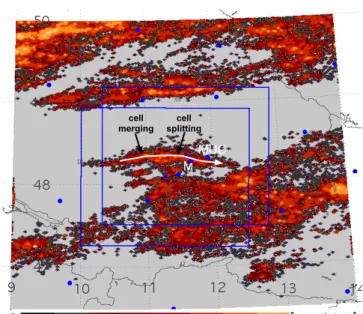
cell
merging splittingcell
Fig. 8. Accumulated lightning intensity map for the example day 25 June 2008. The lightning frequencies per pixel of 3 min accu-mulated lightning data for every 2.5 min time step as described in Sect. 2.1.2 are shown in red shades. The coverage of the radar in F¨urholzen is marked by the upper right rectangle. Blue dots indicate LINET sensor locations. The cell track of the supercell discussed in the text is highlighted.
3.2 Case study of 25 June 2008
25 June 2008 is characterized by several heavy thunder-storms. The case study discussed in the following concerns a supercell which propagated north of Munich in eastern di-rection. Figure 8 illustrates the stroke activity of that day in the area of interest showing always the maximum stroke rate. The storm track of the example storm is plotted atop. The thunderstorm activity starts in southern Germany in the midafternoon. The DWD surface analysis and the Munich sounding (not shown) indicate that a prevailing zonal flow moves over a warm surface air mass, which induces high CAPE values of about 1000 J kg−1. Strong, unidirectional 0– 6 km bulk shear winds of more than 20 m s−1favour the de-velopment of well-organized storms.
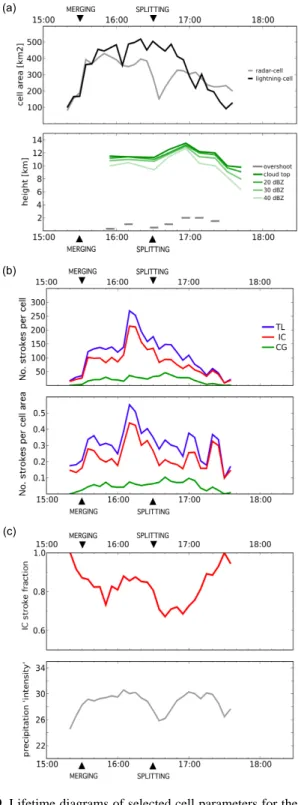
Time series of selected cell parameters, which are recorded by the ec-TRAM algorithm, are complemented by three-dimensional polarimetric radar data and by satellite-data-based cell information provided by the cell tracker Cb-TRAM. Figure 9 shows from top to bottom the temporal evo-lutions of the following parameters: (a) the total cell areas of radar cells and lightning cells (a, top) and selected iso-reflectivity heights and overshooting cloud top derived from three-dimensional radar data (a, bottom). The overshooting top height is defined as the difference between the maximum and the mean anvil top height. The TL, IC, and CG stroke rates per time step which are – in accordance with the cell
(a)
(b)
(c)
Fig. 9. Lifetime diagrams of selected cell parameters for the thun-derstorm case study from 25 June 2008. (a) Radar- and lightning-cell areas (top) and iso-reflectivity heights a.g.l. (green) and over-shooting top height relative to the mean anvil top height estimated from POLDIRAD radar data (grey bars) (bottom, shared axis). (b) 3 min TL stroke rates per cell (top) and per respective lightning-cell area (bottom). (c) IC fraction to TL stroke rate (top) and precip-itation “intensity” per radar-cell area as described in text (bottom).
identification criteria – the total numbers of strokes recorded during the preceding 3 min (b, top), the respective discharge densities per cell (b, bottom), (c) the relative fraction of IC events to TL amount (c, top), and the precipitation intensity related to the radar cells (c, bottom). The so-called precipita-tion intensity, given as precipitaprecipita-tion amount per time interval and cell area in Fig. 9c, is introduced to estimate thunder-storm rainfall per area and time on the basis of radar reflec-tivity cells (Jones, 1956). This value is only interpreted in qualitative terms and is not to be taken as a reliable quan-titative measure. The first reflectivity core with a maximum reflectivity of 33 dBZ is detected at 15:04 UTC in the volu-metric radar scan at 4 km height (not shown in the time di-agrams). It is likely that the cell has been triggered by the outflow boundary of an older cell with which it merged at around 15:30 UTC. The cell merging is reflected in a sudden increase of all extensive cell parameters and, interestingly, in discharge density, too. The next volumetric radar scan at 15:15 UTC shows a maximum reflectivity of 50 dBZ at 5 km above ground (not shown in the time diagrams). Five min-utes later, at 15:20 UTC, the cell appears for the first time in the ec-TRAM data as the radar reflectivity field at the ground exceeds the threshold of 33 dBZ and lightning activity starts at the same time. Graupel and hail are detected in the mixed-phase layer at a height around 4 km 5 min. prior to the first electrical discharge. The electrical activity of the storm starts with IC events during an enhanced cell growth. The first CG event is recorded 5 min after the first IC event. The ratio of IC to CG discharge activity ranges widely between 2 and 40 during the whole life cycle. At 15:25 UTC hail is observed near the ground. At 16:30 UTC a cell splitting is observed in the ground precipitation patterns and confirmed by the volu-metric radar data. An overshooting top is built at that time. At 15 min prior to the cell splitting, both TL discharge frequency and density increase significantly by a factor of two, mostly due to an enhanced IC discharge activity. After the cell split-ting the main electrical activity shifts to the right moving cell and then diminishes while the precipitation intensity of the radar cell increases again until it reaches earlier values. At 16:35 UTC hail at the ground changes to heavy rain. Light-ning activity finally stops after 140 min. Continuously weak-ening, the radar cell persists until it merges at 16:45 UTC.
The synoptic condition with high CAPE and low direc-tional but high absolute wind shear is considered to enhance cell-splitting processes (Klemp, 1987). According to the the-ory of cell splitting processes, the increase of discharge fre-quency and density, which is observed just before the cell splits, can be attributed to an updraft intensification which is supposed to intensify the charge separation in the updraft core (Williams et al., 1987; Carey and Rutledge, 1996; Mot-ley et al., 2006). The observed time-coincident increase of the IC fraction is also found to be in excellent agreement with other studies (Williams et al., 1987; Carey and Rutledge, 1996; Williams et al., 1999) and with the reasonable expecta-tion that an intensified updraft enforces charge separaexpecta-tion in
Fig. 10. POLDIRAD RHI scan of the example storm from 25 June 2008 at the time of updraft intensification at 17:20 UTC with (a) the reflectivity map and (b) the respective hydrometeor classification after H¨oller et al. (1994).
the cloud, provided hail and graupel formation in the mixed-phase layer is sufficient to induce the non-inductive charging mechanism (Dash et al., 2001; Saunders, 2008). The hereby elevated core suggests an increase mainly in in-cloud activ-ity. As the cell splits, the downdraft is supposed to increase. A more significant intensification in precipitation intensity at ground level might be expected (Williams et al., 1987) but is not observed in the precipitation intensity referred to the radar-cell outlines. Although the storm splitting interrupts all parameter trends observed in the time series of Fig. 9, the rain intensity per radar cell shows the tendency to increase dur-ing the mature stage. It is noted that the CG contribution to TL activity seems to mirror those patterns as the CG fraction steadily increases during the mature stage. The sudden in-crease in in-cloud activity, which precedes the process of cell splitting, interrupts this trend. After the cell splitting the CG fraction reaches its maximum. This suggests a correlation be-tween convective precipitation intensity and hail occurrence at the ground and CG flash rates as it can be expected with a correlated descent of the lower charge region (Williams et al., 1987; Rutledge and MacGorman, 1988; Carey and Rut-ledge, 1996; Lopez and Aubagnac, 1997). It has been found earlier that sudden appearance of high flash rates, a “light-ning jump”, precedes so-called “severe” weather events at
the ground, such as large hail and strong downdraft winds (Williams et al., 1999; Schultz et al., 2009; Gatlin and Good-man, 2010).
After the cell splitting, when the storm already decays, two significant peaks in TL and IC discharge density are observed at 17:00 UTC and 17:20 UTC. The peaks are not significant in terms of discharge frequency. But at the same time a new development of an overshooting top as well as a spontaneous increasing in iso-reflectivity heights is observed in the vertical reflectivity patterns, shown as grey bars and green lines in Fig. 9a. This indicates that, at the times of discharge intensification, the storm experiences a short ver-tical cell growth, while the cell base continuously shrinks. Figure 10 shows a storm cross section during the last up-draft intensification at 17:20 UTC. This cross section can be compared with Fig. 4, which shows storm scans of the same storm between 16:22 UTC and 16:28 UTC, which is right be-fore the time ec-TRAM records cell splitting in the ground precipitation field. Right before the cell splitting, the storm has a high reflectivity core with a broad precipitation area and lightning incidents are widely spread. At 17:20 UTC the storm exhibits a high reaching reflectivity core and a sig-nificant overshooting top, but a narrow storm structure and
lightning events occur compacted in the upper updraft region, well above the graupel region.
The satellite-data-based algorithm Cb-TRAM records the cell as rapidly developing for the first time at 14:35 UTC, which is 45 min prior to the ec-TRAM algorithm. At 15:15 UTC the Cb-TRAM algorithm classifies the cell stage as mature thunderstorm, well in accordance with the onset of lightning activity (note that lightning data are not used in the Cb-TRAM algorithm). Thereafter, the Cb-TRAM sever-ity parameters remain stable during the rest of the cell life-time until the Cb-TRAM cell merges with another cell at 17:30 UTC. A detailed quantitative comparison between Cb-TRAM contours and ec-Cb-TRAM contours has not been done in the present study.
4 Conclusions
The new hybrid thunderstorm tracking algorithm ec-TRAM is found to be a fast, reliable, and applicable two-dimensional storm tracking method. The approach proved to be use-ful by identifying radar- and lightning-data-based cells in two independently operating procedural steps and to merge both tracking information every time step anew in a sepa-rate subsequent step. The developed method guarantees that the tracking information of both algorithms always comple-ments each other. For example, a comparison of storm track duration (Fig. 6) shows that rad-TRAM and li-TRAM have equal tracking performances, but both tend to be outper-formed by ec-TRAM. The limited domain margins constrain the comparison. An illustration for the ec-TRAM tracking performance is given by the evolution of a thunderstorm with a rather complex evolution (Fig. 5). Both rad-TRAM and li-TRAM would have lost the storm track, while ec-TRAM achieved a coherent, accurate, and physically reasonable cell track due to the chosen approach to process radar cells and lightning cells simultaneously. This example also illustrates that ec-TRAM improves the information content about storm structure and development by considering a combination of both storm features, intense precipitation and electrically ac-tive regions, to more informaac-tive cell complexes. Hereby, it can be seen that the chosen cell identification definitions were sufficiently well optimized since they assess and con-tour most storm cells, which are found spatially close enough to be considered as part of the same storm complex.
The interaction of lightning and radar signatures with re-gard to the temporal storm development has been exploited statistically by employing ec-TRAM for an observation pe-riod lasting from May 2008 to September 2008. The com-plete ec-TRAM data sample comprises 518 comcom-pletely and 797 incompletely assessed thunderstorm tracks with a min-imum lifetime of 35 min. This provides a solid background for the following statistical conclusions. A large fraction of ec-TRAM low-reflectivity radar cells (46 % of ec-TRAM cell entries) are not accompanied by a lightning cell. This
can be explained by the rather low detection threshold of 33 dBZ. On the one hand intensified precipitation is gener-ally detected before lightning activity starts (in 72 % of the ec-TRAM cell tracks) and after lightning activity ends (in 68 % of the ec-TRAM cell tracks), and on the other hand precipitation cells are monitored which do not generate any electrical discharge (31 % of radar-cell tracks with lifetimes of 35 min and longer are recorded without any contemporary lightning cell). The negligible amount of pure lightning cells (2 % of ec-TRAM cell entries) indicates that electrical dis-charge activity generally goes along with intensified ground precipitation and rarely precedes (4 % of the ec-TRAM cell tracks) or lasts longer (12 % of the ec-TRAM cell tracks) than intensified ground precipitation. While discharge activ-ity, which can be tracked longer than 15 min, is always ac-companied by intense ground precipitation, a considerable fraction of about 50 % shows intense precipitation cells with lifetimes between 10 and 70 min that are recorded without any discharge activity. Yet, more persistent precipitation cells with lifetimes longer than 70 min are always accompanied by lightning. The reason for this observation might be that long-lived storms most likely belong to another category of storms than short-lived storms. The former ones rather com-prise supercells and multi-cells, which are characterized by more complex storm structures and vigorous internal dynam-ics generally producing heavy precipitation and lightning.
The acquirements, interpreted in terms of a thunderstorm life cycle, contribute to a better understanding of the general picture of the conceptual storm model. The presented results also imply that in the ec-TRAM approach radar cells can be well used as early warning for the onset of lightning activ-ity; of course, the false alarm rate must be evaluated more carefully.
The temporal evolution of a supercell, which has been monitored on 25 June 2008, gives an example of an inter-esting storm life cycle. A detailed study where ec-TRAM cell parameters were complemented with three-dimensional polarimetric radar data found both temporal evolution and parameter correlations of the storm in general good agree-ment with conceptual storm models. Especially the discharge frequency and density, their temporal evolution, and the IC fraction clearly reflect the actual storm dynamics, where a clear proportional relation is found with updraft intensi-fication and decease. Although an interruption, which can be attributed to a storm splitting, is reflected in the lifetime di-agrams, the rain intensity per radar cell shows the general trend to increase during the mature stage. It is noted that the CG contribution to TL activity mirrors these patterns as the CG fraction steadily increases during the mature stage. The satellite-data-based algorithm Cb-TRAM assesses the convective initiation of the thunderstorm 45 min prior to the first electrical discharges. However, no information is given about further internal cell evolution once the cloud top has reached the tropopause. Extensive vertical cell growth and hail and graupel occurrence in the mixed-phase layer of the
cloud, detected in the polarimetric radar data, precede the onset of significant lightning activity by 15 min and 5 min, respectively. Similar lead times were reported in other stud-ies where they were found between 5 and 20 min (Bringi et al., 1997; Altaratz et al., 2001; Motley et al., 2006). From this study it can be concluded that ec-TRAM is a feasible method to identify and track thunderstorms in high spatial and temporal resolution. The detection of radar cells can be used as pre-warning for the onset of electrical activity, but a false alarm rate must be considered, which starts with about 60 % for newly identified radar cells and decreases to 52, 39, 31, and 0 % with increasing cell lifetimes of 15, 25, 35, and 70 min, respectively. A higher reflectivity threshold used to identify the radar cells could quite possibly reduce the false alarm rate.
Ec-TRAM provides the basis to investigate thunderstorm life cycles in detail in case studies or by statistical means. The relationships found between lightning flash characteris-tics and radar features are promising, especially when con-sidering the fact that previous studies mainly focussed on in-dividual case studies of severe weather events and then often relied only on parts of the storm evolution (Dotzek et al., 2001; Fehr et al., 2005; Carey et al., 2005; Steiger et al., 2007a,b). Future studies will be required to investigate the predictability and reliability of cell displacement and evolu-tionary trends.
The new tracking routine li-TRAM identifies the storm po-sition, extension, and motion. Furthermore, it assesses the storm intensity and actual dynamics of an electrically active storm in high spatial and temporal resolution. The success-ful performance encourages the usage of high-quality light-ning data for thunderstorm nowcasting as an independent data source. In this study LINET data proved to be highly qualified for that purpose. The high amount of data (detec-tion efficiency) and the compact appearance of recorded dis-charge sources (location accuracy) allow a narrow accumu-lation time interval of 3 min for cell clustering. In compar-ison, other lightning-cell trackers are obliged to use accu-mulation times of 10 min, 15 min and more (Bertram and Mayr, 2004; Bonelli and Marcacci, 2008; Rossi et al., 2010). Because of the short accumulation time, rapid changes in discharge characteristics can be resolved by li-TRAM. Es-pecially, the knowledge about the actual dynamics has the potential to predict the near-future storm development. Due to the IC height information provided by LINET lightning data, three-dimensional thunderstorm properties that do not need to be tracked separately could be retrieved in a two-dimensional storm tracking. A reliable investigation about the information content of total lightning data and IC height information with statistical background is left to other stud-ies. The fixed thresholds set for cell identification could be complemented by a multiple or adaptive threshold scheme, like it is used in other tracking routines (Hering et al., 2004; Handwerker, 2002; Dixon and Wiener, 1993), to obtain more detailed information about the internal storm structure by
re-solving internal intensity cores. A data fusion with innovative radar data and satellite data can further improve the knowl-edge about actual storm stage and development, including the identification of convection initiation, the onset of cloud elec-trification, intermediate vertical developments and finally the storm dissipation.
Acknowledgements. This work was funded by the German Min-istry for Education and Research BMBF under contract 01LS05125 in the project RegioExAKT (Regionales Risiko konvektiver Extremwetterereignisse: Anwenderorientierte Konzepte zur Trend-bewertung und -anpassung, Regional risk of convective extreme weather events: user-oriented concepts for trend assessment and adaptation).
The service charges for this open access publication have been covered by a Research Centre of the Helmholtz Association.
Edited by: M. Dameris
References
Altaratz, O., Levin, Z., and Yair, Y.: Winter thunderstorms in Israel: A study with lightning location systems and weather radar, Mon. Weather Rev., 129, 1259–1266, 2001.
Bertram, I. and Mayr, G. J.: Lightning in the eastern Alps 1993– 1999, part I: Thunderstorm tracks, Nat. Hazards Earth Syst. Sci., 4, 501–511, doi:10.5194/nhess-4-501-2004, 2004.
Betz, H. D., Schmidt, K., Fuchs, B., Oettinger, W. P., and H¨oller, H.: Cloud lightning: detection and utilization for total lightning measured in the VLF/LF regime, J. Light. Res., 2, 1–17, 2007. Betz, H. D., Schmidt, K., Laroche, P., Blanchet, P., Oettinger, W. P.,
Defer, E., Dziewit, Z., and Konarski, J.: LINET: An international lightning detection network in Europe, Atmos. Res., 91, 564– 573, 2009.
Bonelli, P. and Marcacci, P.: Thunderstorm nowcasting by means of lightning and radar data: algorithms and applications in northern Italy, Nat. Hazards Earth Syst. Sci., 8, 1187–1198, doi:10.5194/nhess-8-1187-2008, 2008.
Bringi, V. N., Knupp, K., Detwiler, A., Liu, L., Caylor, I. J., and Black, R. A.: Evolution of a Florida thunderstorm during the Convection and Precipitation/Electrification Experiment: The case of 9 August 1991, Mon. Weather Rev., 125, 2131–2160, 1997.
Carey, L. D. and Rutledge, S. A.: A multiparameter radar case study of the microphysical and kinematic evolution of a light-ning producing storm, Meteorol. Atmos. Phys., 59, 33–64, doi:10.1007/BF01032000, 1996.
Carey, L. D., Murphy, M. J., McCormick, T. L., and Demetriades, N. W. S.: Lightning location relative to storm structure in a leading-line, trailing-stratiform mesoscale convective system, J. Geophys. Res., 110, D03105, doi:10.1029/2003JD004371, 2005. Cooray, V. (ed.): The lightning flash, IEE Power and Energy Series,
34, London, UK, 127–239, 2003.
Dash, J. G., Mason, B. L., and Wettlaufer, J. S.: Theory of charge and mass transfer in ice-ice collisions, J. Geophys. Res., 106, 20395–20402, 2001.
Demetriades, N. W. S. and Holle, R. L.: Long range lightning now-casting applications for tropical cyclones, in: Proceedings of 2nd Conference on the Meteorology Application of Lightning Data, Atlanta, USA, 29 January–2 February 2006.
Dixon, M. and Wiener, G.: TITAN: Thunderstorm identification, tracking, analysis, and nowcasting—A radar-based methodology, J. Atmos. Ocean. Technol., 10, 785–797, 1993.
Dotzek, N., H¨oller, H., Th´ery, C., and Fehr, T.: Lightning evolution related to radar-derived microphysics in the 21 July 1998 EULI-NOX supercell storm, Atmos. Res., 56, 335–354, 2001. Fehr, T., Dotzek, N., and H¨oller, H.: Comparison of lightning
ac-tivity and radar-retrieved microphysical properties in EULINOX storms, Atmos. Res., 76, 167–189, 2005.
Forster, C. and Tafferner, A.: Nowcasting and forecasting thunder-storms for air traffic with an integrated forecast system based on observations and model data, in: Proceedings of WMO Sym-posium on Nowcasting, edited by: Whistler, B. C., Canada, 30 August–4 September 2009.
Gatlin, P. N. and Goodman, S. J.: A total lightning trending algo-rithm to identify severe thunderstorms, J. Atmos. Ocean. Tech-nol., 27, 3–22, 2010.
Handwerker, J.: Cell tracking with TRACE3D – a new algorithm, Atmos. Res., 61, 15–34, 2002.
Hering, A. M., Morel, C., Galli, G., S´en´esi, S., Ambrosetti, P., and Boscacci, M.: Nowcasting thunderstorms in the Alpine region using a radar based adaptive thresholding scheme, in: Proceedings of 3rd European Conference on Radar Meteorology (ERAD), Visby, Island of Gotland, Sweden, September 6-10, 1–6, available at: http://www.meteoschweiz.admin.ch/web/en/ research/completed projects/trt.Related.0002.DownloadFile. tmp/erad04p00039trt.pdf 2004.
H¨oller, H., Hagen, M., Meischner, P. F., Bringi, V. N., and Hubbert, J.: Life cycle and precipitation formation in a hybrid-type hail-storm revealed by polarimetric and Doppler radar measurements, J. Atmos. Sci., 51, 2500–2522, 1994.
H¨oller, H., Betz, H. D., Schmidt, K., Calheiros, R. V., May, P., Houngninou, E., and Scialom, G.: Lightning characteristics ob-served by a VLF/LF lightning detection network (LINET) in Brazil, Australia, Africa and Germany, Atmos. Chem. Phys., 9, 7795–7824, doi:10.5194/acp-9-7795-2009, 2009.
Jones, D. M. A.: Rainfall drop size-distribution and radar reflectiv-ity, Tech. rep., Illinois State Water Survey, Meteorologic Labora-tory, University of Illinois, USA, 1956.
Klemp, J. B.: Dynamics of tornadic thunderstorms, Ann. Rev. Fluid Mech., 19, 369–402, 1987.
Kober, K. and Tafferner, A.: Tracking and nowcasting of convective cells using remote sensing data from radar and satellite, Meteo-rol. Zeitschr., 18, 75–84, 2009.
Kohn, M., Galanti, E., Price, C., Lagouvardos, K., and Kotroni, V.: Now-casting thunderstorms in the Mediterranean region using lightning data, Atmos. Res., 100, 489–502, 2010.
Lopez, R. E. and Aubagnac, J. P.: The lightning activity of a hail-storm as a function of changes in its microphysical characteristics inferred from polarimetric radar observations, J. Geophys. Res., 102, 16799–16813, 1997.
Motley, S. M., Carey, L. D., and Murphy, M. J.: Total lightning char-acteristics of ordinary convection, in: Proceedings of 19th Inter-national lightning Detection Conference, Tucson, Arizona, USA, 24–25 April, 2006.
Price, C., Yair, Y., Mugnai, A., Lagouvardos, K., Llasat, M., Michaelides, S., Dayan, U., Dietrich, S., Galanti, E., and Garrote, L.: The FLASH Project: using lightning data to better understand and predict flash floods, Environ. Sci. Pol., 14, 898–911, 2011. Rossi, P., M¨akel¨a, A., Halmevaara, K., Koistinen, J., and Hasu,
V.: Radar and lightning data based classification scheme for the severity of convective cells, in: Proceedings of the 6th European Conference on Radar Meteorology (ERAD), Sibiu, Romania, 6– 10 September, 6–10, 2010.
Rutledge, S. A. and MacGorman, D. R.: Cloud-to-Ground Light-ning Activity in the 10–11 June 1985 Mesoscale Convective System Observed during the Oklahoma-Kansas PRE-STORM Project, Mon. Weather Rev., 116, 1393–1408, 1988.
Saunders, C.: Charge separation mechanisms in clouds, Space Sci. Rev., 137, 335–353, 2008.
Schroth, A. C., Chandra, M. S., and Meischner, P. F.: A C-band coherent polarimetric radar for propagation and cloud physics research, J. Atmos. Ocean. Technol., 4, 804–822, 1988. Schultz, C. J., Petersen, W. A., and Carey, L. D.: Preliminary
de-velopment and evaluation of lightning jump algorithms for the real-time detection of severe weather, Journal of Applied Meteo-rology and Climatology, 48, 2543–2563, 2009.
Sieglaff, J. M., Hartung, D. C., Feltz, W. F., Cronce, L. M., and Lak-shmanan, V.: A Satellite-Based Convective Cloud Object Track-ing and Multipurpose Data Fusion Tool with Application to De-veloping Convection, J. Atmos. Ocean. Technol., 30, 510–525, 2013.
Soul, K. M., Archibald, E. J., Hardaker, P. J., and Hounsell, A.: Using the GANDOLF system as a tool to aid the forecasting of lightning strikes, Meteorol. Appl., 9, 229–238, 2002.
Steiger, S. M., Orville, R. E., and Carey, L. D.: Total lightning sig-natures of thunderstorm intensity over north Texas. Part I: Super-cells, Mon. Weather Rev., 135, 3281–3302, 2007a.
Steiger, S. M., Orville, R. E., and Carey, L. D.: Total lightning signatures of thunderstorm intensity over north Texas. Part II: Mesoscale convective systems, Mon. Weather Rev., 135, 3303– 3324, 2007b.
Steinacker, R., Dorninger, M., W¨olfelmaier, F., and Krennert, T.: Automatic tracking of convective cells and cell complexes from lightning and radar data, Meteorol. Atmos. Phys., 72, 101–110, 2000.
Williams, E., Boldi, B., Matlin, A., Weber, M., Hodanish, S., Sharp, D., Goodman, S., Raghavan, R., and Buechler, D.: The behavior of total lightning activity in severe Florida thunderstorms, At-mos. Res., 51, 245–265, 1999.
Williams, E. R., Weber, M. E., and Orville, R. E.: The re-lationship between lightning type and convective state of thunderclouds, J. Geophys. Res., 94, 13213–13220, doi:10.1029/JD094iD11p13213, 1987.
Yeung, L. H. Y., Lai, E. S. T., and Chiu, S. K. S.: Lightning Ini-tiation and Intensity Nowcasting Based on Isothermal Radar Reflectivity-A Conceptual Model, in: Proceedings of the 33rd In-ternational Conference on Radar Meteorology, Cairns, Queens-land, Australia, 6–10 August, 6–10, 2007.
Zinner, T., Mannstein, H., and Tafferner, A.: Cb-TRAM: Tracking and monitoring severe convection from onset over rapid devel-opment to mature phase using multi-channel Meteosat-8 SEVIRI data, Meteorol. Atmos. Phys., 101, 191–210, 2008.