Fibrosis in Hepatitis C: New Algorithms Are More
Precise and Entirely Noninvasive
Je´roˆme Boursier,1,2Victor de Ledinghen,3,4Jean-Pierre Zarski,5,6 Isabelle Fouchard-Hubert,1,2 Yves Gallois,2,7Fre´de´ric Oberti,1,2 Paul Cale`s1,2 and multicentric groups from SNIFF 32, VINDIAG 7, and
ANRS/HC/EP23 FIBROSTAR studies
The sequential algorithm for fibrosis evaluation (SAFE) and the Bordeaux algorithm (BA), which cross-check FibroTest with the aspartate aminotransferase-to-platelet ratio index (APRI) or FibroScan, are very accurate but provide only a binary diagnosis of significant fi-brosis (SAFE or BA for Metavir F2) or cirrhosis (SAFE or BA for F4). Therefore, in clini-cal practice, physicians have to apply the algorithm for F2, and then, when needed, the algorithm for F4 (‘‘successive algorithms’’). We aimed to evaluate successive SAFE, successive BA, and a new, noninvasive, detailed classification of fibrosis. The study included 1785 patients with chronic hepatitis C, liver biopsy, blood fibrosis tests, and FibroScan (the latter in 729 patients). The most accurate synchronous combination of FibroScan with a blood test (FibroMeter) provided a new detailed (six classes) classification (FM1FS). Successive SAFE had a significantly (P<1023) lower diagnostic accuracy (87.3%) than individual SAFE for F
2 (94.6%) or SAFE for F4 (89.5%), and required significantly more biopsies (70.8% versus 64.0% or 6.4%, respectively,P<1023). Similarly, successive BA had significantly (P1023) lower diagnostic accuracy (84.7%) than individual BA for F 2 (88.3%) or BA for F4 (94.2%), and required significantly more biopsies (49.8% versus 34.6% or 24.6%, respec-tively,P<1023). The diagnostic accuracy of the FM1FS classification (86.7%) was not sig-nificantly different from those of successive SAFE or BA. However, this new classification required no biopsy. Conclusion: SAFE and BA for significant fibrosis or cirrhosis are very accurate. However, their successive use induces a significant decrease in diagnostic accuracy and a significant increase in required liver biopsy. A new fibrosis classification that synchro-nously combines two fibrosis tests was as accurate as successive SAFE or BA, while providing an entirely noninvasive (0% liver biopsy) and more precise (six versus two or three fibrosis classes) fibrosis diagnosis.(HEPATOLOGY2012;55:58-67)
S
everal fibrosis algorithms combining different fibrosis tests have been proposed to improve the accuracy of the noninvasive diagnosis of liver fi-brosis in chronic hepatitis C.1-5These decision-making algorithms were developed to provide an accurate diag-nosis of liver fibrosis and limit liver biopsy to indeter-minate cases. They use either two blood tests in a se-quential procedure, as in the sese-quential algorithm forfibrosis evaluation (SAFE),6 or are based on agreement between a blood test and FibroScan (Echosens, Paris, France) results, as in the Bordeaux algorithm (BA).1
Although the accuracy of SAFE and BA has been shown to be excellent for the diagnosis of significant fi-brosis or cirrhosis,1,2,6-8 they have some limitations in clinical practice. First, SAFE uses the aspartate amino-transferase-to-platelet ratio index (APRI) as a first-line
Abbreviations:: BA, Bordeaux algorithm; SAFE, sequential algorithm for fibrosis evaluation.
From the1Department of Hepatogastroenterology, University Hospital, Angers, France;2HIFIH Laboratory, UPRES 3859, Institut Fe´de´ratif de Recherche (IFR) 132, University of Angers, Poˆle de Recherche et d’Enseignement Supe´rieur Universite´ Nantes Angers Le Mans (PRES UNAM), France; 3Department of Hepatogastroenterology, Haut-Le´veˆque University Hospital, Pessac, France;4Institut National de la Sante´ et de la Recherche Me´dicale (INSERM) U889, Victor Segalen University, Bordeaux, France;5Department of Liver-Gastroenterology, University Hospital, Grenoble, France;6Institut National de la Sante´ et de la Recherche Me´dicale (INSERM)/UJF U823, IAPC, IAB, Grenoble, France; and7Department of Biochemistry, University Hospital, Angers, France.
Received February 21, 2011; accepted August 23, 2011.
Supported by the Program Hospitalier de Recherche Clinique (PHRC) of the French Department of Health in 1994 and 2002 for SNIFF 32 and the Agence National de Recherche sur le Sida et les He´patites (ANRS) for FIBROSTAR HC/EP23.
fibrosis test, then FibroTest as a second-line test, and, if necessary, liver biopsy when the diagnosis remains undetermined. This implies several diagnostic steps.9 Second, the rate of required liver biopsy in SAFE and BA ranges from 30% to 50% for the diagnosis of signif-icant fibrosis and from 20%-30% for cirrhosis.6,7These rates seem inconsistent with a ‘‘noninvasive’’ diagnostic procedure for liver fibrosis screening. Third, SAFE was developed for a binary diagnosis of significant fibrosis or cirrhosis, which is insufficient for patient manage-ment in clinical practice. Indeed, a noninvasive diagno-sis of significant fibrodiagno-sis could indicate either moderate/ severe fibrosis or cirrhosis. Thus, to achieve an accurate diagnosis, physicians have to use the SAFE for signifi-cant fibrosis first, and then, if signifisignifi-cant fibrosis is diag-nosed, the SAFE for cirrhosis. This adds a diagnostic step and increases the rate of misclassified patients and the rate of required liver biopsy. Finally, the BA was presented in the pivotal study as a three-diagnostic-class algorithm,1 but further evaluation focused only on the binary diagnosis of significant fibrosis or cirrhosis.7
We have developed several statistical techniques to improve the noninvasive diagnosis of liver fibrosis. These include blood tests adapted to a diagnostic target,10 syn-chronous combinations of fibrosis tests8,11 to improve diagnostic accuracy, and reliable diagnosis intervals for fi-brosis tests to improve diagnostic precision.12,13Finally, a synchronous combination of FibroScan and FibroMeter using these methods in a one-step procedure resulted in an accurate noninvasive classification of fibrosis.14 This classification provided a precise diagnosis (six diagnostic classes), with robust and high diagnostic accuracy, and eliminated the need for liver biopsy.
The aim of the present study was to evaluate the ac-curacy of SAFE and BA for the noninvasive diagnosis of liver fibrosis in clinical practice and compare them with our new noninvasive classification of fibrosis, which synchronously combines fibrosis tests.
Patients and Methods
Patients. We pooled the populations of three pub-lished studies, SNIFF 32,13 VINDIAG 7,14 and
FIBROSTAR ANRS/HC/EP23,15all of which had very similar inclusion and exclusion criteria. Patients were included if they had chronic hepatitis C, defined as both positive anti-hepatitis C virus antibodies and hepatitis C virus RNA in serum. Exclusion criteria were other causes of chronic hepatitis (hepatitis B or HIV coinfection, alco-hol consumption >30 g/day in men or >20 g/day in women in the 5 years before inclusion, hemochromato-sis, or autoimmune hepatitis), cirrhosis complications (ascites, variceal bleeding, systemic infection, hepatocel-lular carcinoma), and antifibrotic treatment in the pre-ceding 6 months. Patients were included from nine cen-ters for SNIFF 32, three cencen-ters for VINDIAG 7, and 19 centers for FIBROSTAR, all located in France. Patients included in both VINDIAG 7 and FIBROSTAR were excluded from the FIBROSTAR population for the sta-tistical analysis of the present study. All patients gave informed consent. Study protocols conformed to the eth-ical guidelines of the current Declaration of Helsinki and received approval from local ethics committees.
Liver Biopsy. Liver fibrosis was evaluated according to Metavir fibrosis (F) staging. Significant fibrosis was defined as Metavir F2, severe fibrosis as Metavir F 3, and cirrhosis as Metavir F4. Histological liver fibrosis evaluation was performed by blinded senior pathologists in each center. In the FIBROSTAR study, liver fibrosis was centrally evaluated by two senior experts with a con-sensus reading in cases of discordance. All pathologists involved in the three studies were hepatology specialists. Histological results were used as reference for the evalua-tion of noninvasive tests.
Blood Fibrosis Tests. Fasting blood samples were collected immediately before or no more than 3 months after liver biopsy. Blood samples were proc-essed independently in each center, except for hyal-uronic acid,a2-macroglobulin, haptoglobin, and apoli-poprotein A1, which were tested centrally in the FIBROSTAR study. Fibrotest,1 FibroMeter2G,16 and APRI17 were calculated according to published or patented formulas. We have demonstrated the excellent interlaboratory reproducibility of these tests.18
Liver Stiffness Evaluation. FibroScan was available in the VINDIAG 7 and FIBROSTAR studies.
Address reprint requests to: Je´roˆme Boursier, M.D., Service d’He´pato-Gastroente´rologie, CHU, 49933 Angers Cedex 09, France. E-mail: JeBoursier@chu-angers. fr; fax: (33) 2 41 35 41 19.
CopyrightVC2011 by the American Association for the Study of Liver Diseases.
View this article online at wileyonlinelibrary.com. DOI 10.1002/hep.24654
Potential conflict of interest: Dr. Cale`s owns stock in and consults for Biolivescale.
Dr. Zarski consults for and is on the speakers’ bureau of Roche, Merck, Bristol-Myers Squibb, Gilead, Janssen, and Novartis. Drs. Oberti and Fouchard-Hubert own stock in Biolivescale.
FibroScan examinations were performed under fasting conditions by an experienced observer (>50 examina-tions before the study), blinded for patient data. Examination conditions were those recommended by the manufacturer.19 FibroScan examinations were stopped when 10 valid measurements were recorded. Results (in kilopascals) were expressed as the median of all valid measurements. A FibroScan result was con-sidered reliable when the interquartile range (IQR)/ median ratio (IQR/M) was<0.21.20
Fibrosis Algorithms
Characteristics of the eight fibrosis algorithms eval-uated in the present study are detailed in the glossary and summarized in Supporting Table 1 in the Sup-porting Material.
Decision-Making Algorithms. SAFE. SAFE for the diagnosis of significant fibrosis (SAFE for F 2; Fig. 1A), SAFE for the diagnosis of cirrhosis (SAFE for F4; Fig. 1B), and SAFE for the simultaneous diagnosis of significant fibrosis and cirrhosis (SAFE for F 2 and F4. Supporting Fig. 3) were determined according to data published by Sebastiani et al.6
Bordeaux Algorithm. BA for the diagnosis of signifi-cant fibrosis (BA for F 2; Fig. 2A) and BA for the diagnosis of cirrhosis (BA for F4; Fig. 2B) were
determined according to data published by Castera et al.7
Successive Algorithms An algorithm constructed for a binary diagnosis of liver fibrosis, such as SAFE or BA, provides only limited data for the management of patients in clinical practice. Indeed, when the noninva-sive diagnosis provided by the algorithm specific to significant fibrosis is F 2, the physician has to apply the cirrhosis-specific algorithm in a second step to determine whether the patient has cirrhosis. We used the term ‘‘successive algorithms’’ to describe this con-secutive use of algorithms in clinical practice. In the present study, we evaluated: Successive SAFE, which corresponds to the use of SAFE for F 2 followed by SAFE for F4 when necessary (Fig. 1C); and Successive Bordeaux algorithms (Successive BA), which corre-sponds to the use of BA for F 2 followed by BA for F4 when necessary. Successive BA presents as a three-diagnostic-class algorithm (Fig. 2C).
New Noninvasive Classification of Fibrosis
The new noninvasive classification of fibrosis was derived from the synchronous combination of FibroM-eter and FibroScan results as described.14 The method is detailed in the glossary in the Supporting Informa-tion and summarized in Supporting Fig. 4. Briefly, Table 1. Main Characteristics of Study Populations
Populations* All #1 #2 PValue† Patients (n) 1785 1056 729 — Age, years 48.0612.4 45.6612.5 51.7611.2 <103 Male sex (%) 60.2 59.5 61.3 0.426 Biopsy length (mm) 2369 2168 2569 <103 Biopsy length15 mm (%) 79.0 75.3 84.3 <103 Metavir F (%) 0.016 0 4.2 4.4 4.0 1 41.1 43.5 37.7 2 26.5 27.0 25.8 3 15.5 14.0 17.6 4 12.7 11.2 15.0 Metavir A (%) 0.436 0 2.0 1.6 2.3 1 41.3 42.8 39.7 2 45.7 44.3 47.1 3 11.1 11.3 10.9
FibroScan result (kPa) — — 10.067.9 —
IQR/median ratio — — 0.2160.19 —
IQR median ratio<0.21 (%) — — 67.8 —
Prothrombin index (%) 93610 93610 9469 0.005
Platelets (G/L) 212668 212670 211666 0.943
AST (IU/L) 62650 60650 66651 0.008
ALT (IU/L) 94687 94690 94682 0.928
Bilirubin (lmol/L) 12614 11612 13616 0.028
*Population #1 corresponds to SNIFF 32 cohort (n¼1056) with liver biopsy and blood fibrosis tests available. Population #2 corresponds to pooled VINDIAG 7 (n¼349) and FIBROSTAR (n¼380) cohorts with liver biopsy, blood fibrosis tests, and FibroScan available.
two fibrosis indexes combining FibroMeter and Fibro-Scan are derived by binary logistic regression: the clini-cally significant fibrosis (CSF) index (diagnostic target: Metavir F 2) and the severe fibrosis (SF) index (diagnostic target: Metavir F 3). The reliable diag-nosis intervals (see the glossary in the Supporting In-formation for a precise definition) of these two indexes are then determined according to a method that has been described.13 Finally, the association of the reliable diagnoses from the CSF index and SF index deter-mines the FMþFS classification, which includes six diagnostic classes of fibrosis stages (F0/1, F1/2, F261,
F2/3, F361, and F4) and eliminates the need for required liver biopsy.
Statistical Analysis
All FibroScan examinations, reliable or not, were included in the initial statistical analysis. Then sensitiv-ity analysis was performed in patients with reliable FibroScan results.
SAFE was evaluated in the SNIFF32 (called popula-tion #1 in the present study), VINDIAG 7 (popula-tion #2a), and FIBROSTAR (popula(popula-tion #2b) cohorts. Because FibroScan was not available in the SNIFF32
Fig. 1. Sequential algorithm for fibrosis evaluation (SAFE). (A) Published SAFE for the binary diagnosis of Metavir F2 (SAFE for F
2). (B) Published SAFE for the binary diag-nosis of cirrhosis (SAFE for F4). (C) Succes-sive SAFE. In clinical practice, physicians have to perform SAFE for F 2 first, and then, if significant fibrosis is diagnosed, SAFE for F4.
Fig. 2. Bordeaux algorithm (BA). (A) Pub-lished BA for the binary diagnosis of Metavir F
2 (BA for F2). (B) Published BA for the binary diagnosis of cirrhosis (BA for F4). (C) Successive BA, corresponding to the succes-sive use of BA for F2 and then BA for F4 in clinical practice. Successive BA presents as a three-diagnostic-class algorithm.
study, BA was evaluated only in the VINDIAG 7 and FIBROSTAR populations (i.e., population #2). The VINDIAG 7 study provided the exploratory popula-tion of the FMþFS classification,14 which was then validated in the FIBROSTAR population.
Performance for the evaluated fibrosis algorithms was expressed as the rate of correctly classified patients according to liver biopsy results, the rate of required liver biopsy, and the performance profile as described21; comparisons were done with the paired McNemar test. Statistical software was SPSS, version 11.5 (SPSS Inc., Chicago, IL).
Results
Patients
The characteristics of the patients included in the three populations have been described13-15 and are summarized in Table 1. More detailed characteristics are presented in Supporting Table 2. The prevalence of significant fibrosis (Metavir F 2) was 52.2% in population #1, 67.8% in population #2a, and 49.4% in population #2b (P < 103). The prevalence of Metavir F stages over the entire population of 1785 patients was: F0: 4.2%, F1: 41.1%, F2: 26.5%, F3: 15.5%, and F4: 12.7%.
Decision-Making Algorithms
Binary Diagnosis of Significant Fibrosis. In the entire population, SAFE for F 2 provided 94.6% diagnostic accuracy but required liver biopsy in 64.0% of patients (Table 2) . Because FibroScan was not available in population #1, SAFE and BA were
com-pared in population #2: BA for F 2 provided signif-icantly lower diagnostic accuracy than SAFE for F 2 (88.3% versus 92.5%, P ¼ 0.010) but required a sig-nificantly lower rate of liver biopsy (34.6% versus 57.0%,P <103).
Binary Diagnosis of Cirrhosis. In the entire popu-lation, SAFE for F4 provided 89.5% diagnostic accu-racy and required liver biopsy in 6.4% of patients (Table 2). In population #2, BA for F4 provided sig-nificantly higher diagnostic accuracy than SAFE for F4 (94.2% versus 87.6%, P < 103) but required a sig-nificantly higher rate of liver biopsy (24.6% versus 6.7%,P <103).
SAFE for F 2 and F4. The SAFE for F 2 and F4 published by Sebastiani et al.6 provided excellent diagnostic accuracy (97.0%) but required a very high rate of liver biopsy (85.2%) (Table 3).
Successive Algorithms
Successive SAFE. In the entire population, Succes-sive SAFE provided significantly lower diagnostic accu-racy (87.3%) than individual SAFE for F 2 (94.6%,
P <103) or SAFE for F4 (89.5%, P < 103) (Table 3). Moreover, Successive SAFE required a significantly higher rate of liver biopsy (70.8%) than SAFE for F 2 (64.0%, P < 103) or SAFE for F4 (6.4%, P <
103). The use of FibroTest was required in 49.2% of patients with Successive SAFE versus 35.8% with SAFE for F 2 (P <103) or 22.2% with SAFE for F4 (P < 103). Finally, the accuracy of the noninva-sive diagnosis (i.e., the rate of correctly classified patients by noninvasive tests in the subgroup of Table 2. Accuracy of SAFE and Bordeaux Algorithm (BA) Constructed for the Binary Diagnosis of Significant Fibrosis
(Metavir F2) or Cirrhosis (Metavir F4) as a Function of Study Population
Diagnostic Target F2 F4
Algorithm SAFE BA SAFE BA Population All #1 #2 #2 All #1 #2 #2
DA (%) 94.6 96.0 92.5 88.3* 89.5 90.7 87.6 94.2† Sensitivity (%) 100.0 100.0 100.0 88.0 61.5 60.7 62.3 86.5 Specificity (%) 88.2 91.8 82.1 88.7 93.4 94.2 92.1 95.4 NPV (%) 100.0 100.0 100.0 84.5 94.6 95.4 93.3 97.7 PPV (%) 91.0 92.9 88.7 91.4 56.2 54.6 57.9 76.1 þLR 8.46 12.17 5.58 7.78 9.25 10.44 7.86 18.99 LR 0.0 0.0 0.0 0.14 0.41 0.42 0.41 0.14 OR NA NA NA 57.6 22.4 25.0 19.2 133.8 LB (%) 64.0 68.8 57.0 34.6† 6.4 6.2 6.7 24.6† DA without LB (%) 85.1 87.3 82.7 82.1 88.7 90.1 86.7 92.2
Abbreviations: DA, diagnostic accuracy (rate of correctly classified patients); NPV, negative predictive value; PPV, positive predictive value;þLR, positive likelihood ratio;LR, negative likelihood ratio; OR, odds ratio; NA, not available (nullLR); LB, rate of liver biopsy required by the algorithm; DA without LB, rate of correctly classified patients by noninvasive tests in the subgroup of patients for whom liver biopsy was not required.
*P¼0.010 versus SAFE in population #2. †P<103versus SAFE in population #2.
patients without liver biopsy) was 56.5% with Succes-sive SAFE whereas it was 85.1% and 88.7% with SAFE for F 2 and SAFE for F4, respectively.
Successive BA. In population #2, Successive BA had significantly lower diagnostic accuracy (84.7%) than individual BA for F 2 (88.3%, P ¼ 103) or BA for F4 (94.2%, P < 103) (Table 3). Also, Successive BA required a significantly higher rate of liver biopsy (49.8%) than BA for F 2 (34.6%, P < 103) or BA for F4 (24.6%,P <103). Finally, the accuracy of the noninvasive diagnosis was 69.6% with Successive BA compared with 82.1% and 92.2% with, respec-tively, BA for F2 and BA for F4.
New Noninvasive Classifications of Fibrosis
There was no discrepancy between the reliable diag-noses of the CSF index and SF index (Supporting Fig. 4), with thus a required liver biopsy rate of 0%. The diagnostic accuracy of the FMþFS classification was not significantly different between populations #2a
(derivation) and #2b (validation): 87.7% and 85.8%, respectively (P ¼ 0.461). Despite the absence of required liver biopsy, the FMþFS classification pro-vided high diagnostic accuracy (86.7%), with no sig-nificant difference from that of Successive SAFE or Successive BA (Table 3). The FMþFS classification provided a lower rate of large discrepancies (2 F stages: 1.2%; Table 4) compared with Successive SAFE (3.1%, P ¼ 0.015) or Successive BA (2.4%, P ¼
0.115). The rate of correctly classified patients was
>85% in all diagnostic classes of the FMþFS classifi-cation (except for the F2/3 class: 74.2%), whereas it was <73% in all diagnostic classes of Successive SAFE or Successive BA (Supporting Fig. 5). The FMþFS classification provided the best performance profile,21 especially in F 2 stages: the rate of correctly classi-fied patients was the highest (>80%) and the most ho-mogeneous over the fibrosis stages, compared with the other algorithms (Fig. 3).
Sensitivity Analysis
We evaluated the influence of age, sex, biopsy length, Metavir F, and alanine aminotransferase (ALT) level on the diagnostic accuracy of successive algo-rithms and FMþFS classification. The influence of FibroScan examination characteristics (success rate, IQR/M) was also evaluated for Successive BA and FMþFS classification.
Successive SAFE. By stepwise forward binary logis-tic regression, the rate of well-classified patients by Successive SAFE was independently associated with ALT (first step), age (second step), Metavir F (third step), and sex (fourth step; Supporting Table 3). The diagnostic accuracy of Successive SAFE as a function Table 3. Comparison of Diagnostic Accuracies (%) and Rates of Required Liver Biopsy (LB, %) Between Decision-Making Algorithms Constructed for a Binary Diagnosis of Liver Fibrosis (Bold Values) and Either Successive Algorithms or the New
FM1FS Classification, as a Function of Study Population
Population
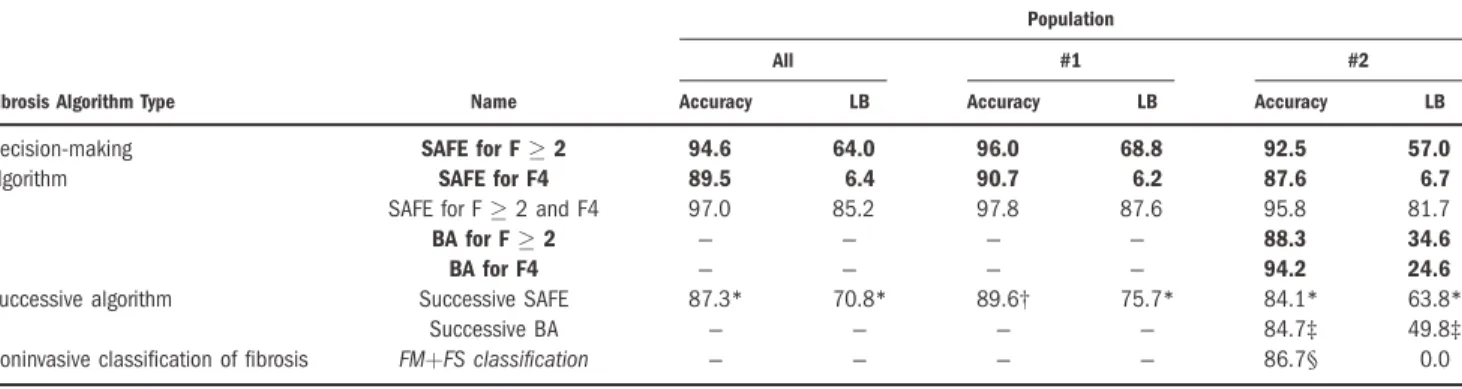
All #1 #2
Fibrosis Algorithm Type Name Accuracy LB Accuracy LB Accuracy LB
Decision-making SAFE for F2 94.6 64.0 96.0 68.8 92.5 57.0
algorithm SAFE for F4 89.5 6.4 90.7 6.2 87.6 6.7
SAFE for F2 and F4 97.0 85.2 97.8 87.6 95.8 81.7
BA for F2 — — — — 88.3 34.6
BA for F4 — — — — 94.2 24.6
Successive algorithm Successive SAFE 87.3* 70.8* 89.6† 75.7* 84.1* 63.8*
Successive BA — — — — 84.7‡ 49.8‡
Noninvasive classification of fibrosis FMþFS classification — — — — 86.7§ 0.0
*P103versus SAFE for F2 or SAFE for F4.
†P<103versus SAFE for F2 andP¼0.059 versus SAFE for F4. ‡P103versus BA for F2 or BA for F4.
§P>0.118 versus Successive SAFE or Successive BA.
Table 4. Rates (%) of Fibrosis Stage Discrepancy*
Stage Discrepancy Fibrosis Algorithm Population 0 1 2 3 2
Successive SAFE All 87.3 10.2 1.8 0.6 2.5
#1 89.6 8.4 1.5 0.6 2.1
#2 84.1 12.8 2.4 0.7 3.1
Successive BA #2 84.7 12.9 2.4 0.0 2.4
FMþFS classification #2 86.7 12.1 1.2 0.0 1.2†
*The difference in fibrosis stages between liver biopsy and fibrosis algorithm results, as a function of study population.
†P¼0.015 versus Successive SAFE andP¼0.115 versus Successive BA in population #2.
of each of these influencing factors is detailed in Sup-porting Table 4. The combination of age, sex, and ALT level showed that diagnostic accuracy of Succes-sive SAFE decreased in patients with high ALT level especially in the subgroup of men 50 years old, in which only 64.6% were well classified (Fig. 4A).
Successive BA. The rate of well-classified patients by Successive BA was only independently associated with Metavir F (Supporting Table 3). The diagnostic accuracy of Successive BA was significantly lower in Metavir F2 or F3 stages compared with F0/1 or F4 (Supporting Table 4).
FM1FS Classification. The rate of well-classified patients by FMþFS classification was independently associated with Metavir F (first step), IQR/M (second step), ALT (third step), and age (fourth step, Support-ing Table 3). Diagnostic accuracy of FMþFS
Fig. 3. Performance profile. Rate of correctly classified patients by successive algorithms and the new FMþFS classification as a function of Metavir fibrosis stage in population #2. Because of the low preva-lence of F0 patients, F0 and F1 stages were pooled.
Fig. 4. Accuracy (% well-classified patients) of fibrosis algorithms as a function of combined influencing factors. (A) Accuracy of Successive SAFE as a function of combined age, sex, and ALT level. (B) Accuracy of FMþFS classification as a function of combined age, IQR/median ratio (IQR/M), and ALT level.
classification as a function of each of these influencing factors is detailed in Supporting Table 4. Diagnostic accuracy of FMþFS classification was always higher than 80%, whatever the combination of age, ALT, and IQR/M (Fig. 4B).
Discussion
This study evaluated the accuracy of two published fibrosis algorithms, the SAFE and the BA, in a large cohort of chronic hepatitis C patients. Castera et al. recently compared SAFE and BA constructed for the binary diagnoses of significant fibrosis or cirrhosis.7 However, their work had two limitations: first, it included a relatively small subset of 302 patients from two centers, and second, the prevalence of significant fibrosis or cirrhosis in the population studied (76% and 24%, respectively) was higher than observed in a reference population (48% and 12%, respectively) including more than 33,000 patients with chronic hep-atitis C.22 This epidemiological limit induced a mise-valuation of the overall accuracy, the predictive values, and probably the sensitivity and specificity of the algo-rithms studied.
Our study has several noteworthy points. First, we performed a direct and independent comparison of SAFE and BA in a large cohort of 729 patients with chronic hepatitis C. Second, our study had a multicen-ter design.13-15 Third, the prevalence of fibrosis stages in our population was very close to that of the refer-ence population22 described above. In this setting, compared with the study by Castera et al.,7 we found a higher negative predictive value for BA for F 2 and lower positive predictive values for SAFE for F4 and BA for F4. Our results are probably more repre-sentative of the real accuracy of SAFE and BA in clini-cal practice.
All the studies that have evaluated SAFE and BA have demonstrated their excellent accuracy for the di-agnosis of significant fibrosis or cirrhosis.2,6-8 Two cav-eats should, however, be kept in mind. First, SAFE for F 2 was impaired in all these studies by a very high rate of required liver biopsy (>50%). Indeed, because it considers negative predictive values of APRI and FibroTest as insufficient, SAFE for F 2 recommends the use of liver biopsy when the blood fibrosis tests suggest no/mild fibrosis.2 It should be noted that this implies to perform of liver biopsy in the subgroup of patients with a good prognosis.
Second, fibrosis algorithms intended for a simple bi-nary diagnosis of fibrosis do not provide sufficient in-formation for the management of patients in clinical
practice. Indeed, physicians have to answer two ques-tions: (1) whether the patient needs antiviral therapy (i.e., is there any significant fibrosis in genotype 1 chronic hepatitis C); and (2) whether the patient needs screening for hepatocellular carcinoma and esophageal varices (i.e., is there any cirrhosis). Thus, physicians first have to apply the algorithm for the di-agnosis of significant fibrosis and then, if the noninva-sive diagnosis is F 2, apply the algorithm for the di-agnosis of cirrhosis. This successive use of algorithms for binary diagnosis leads to greater rates of misclassi-fied patients and of liver biopsy. In this setting, our results clearly demonstrated that Successive SAFE (Fig. 1C) and Successive BA (Fig. 2C) had significantly lower diagnostic accuracies and required significantly higher rates of liver biopsy than single algorithms (respectively SAFE for F 2 or SAFE for F4, and BA for F 2 or BA for F4) (Table 3). Moreover, Succes-sive SAFE required a significantly higher rate of FibroTest use, compared with SAFE for F 2 or SAFE for F4. It is also of note that the results for Suc-cessive SAFE or SucSuc-cessive BA were the same when the algorithm for the binary diagnosis of cirrhosis was performed first, and then followed, if necessary, by the algorithm for the binary diagnosis of significant fibro-sis (data not shown). Taken together, these results show that the accuracy of SAFE and BA for the diag-nosis of fibrosis in clinical practice has been overesti-mated in published studies.
Also, Sebastiani et al. proposed an algorithm for the simultaneous detection of significant fibrosis and cir-rhosis (Supporting Fig. 3).6 Despite very high diagnos-tic accuracy (97.0%), this algorithm required liver bi-opsy in almost all patients (85.2%), thus greatly limiting its interest for the noninvasive diagnosis of fibrosis.
The association of FibroMeter and FibroScan, which was shown to be the best combination among six non-invasive fibrosis tests,14 serves as the foundation of the FMþFS classification (Supporting Fig. 4). This new noninvasive classification of fibrosis had several advan-tages compared with SAFE and BA. First, the FMþFS classification required no liver biopsy. Second, the FMþFS classification provided a more precise diagno-sis (six diagnostic classes) than Successive SAFE (two classes) or Successive BA (three classes) (Supporting Table 1). Third, despite the absence of liver biopsy requirement, the diagnostic accuracy of the FMþFS classification was not significantly different from those of Successive SAFE or Successive BA. Finally, the FMþFS classification provided the best performance profile compared with Successive SAFE or Successive
BA (Fig. 3). It should be noted that the reference for liver fibrosis in our study was liver biopsy, which should be considered as a ‘‘best standard’’ but not a ‘‘gold standard.’’23 Thus, the diagnostic accuracy of the FMþFS classification was probably underestimated in our study.24
Finally, the FMþFS classification significantly improved the noninvasive diagnosis of liver fibrosis by avoiding liver biopsy and refined the precision of fi-brosis diagnosis while maintaining very high accuracy. Thus, between published decision-making algorithms and our new noninvasive classification of fibrosis, the FMþFS classification appears to be the most appropri-ate for clinical use. Because it requires several steps and calculations (Supporting Fig. 4), the use of the FMþFS classification in clinical practice may, at first glance, seem complex. However, once all these steps are computerized, physicians need only provide the results of FibroScan and FibroMeter.
The length of liver biopsy had no influence on the diagnostic accuracy of Successive SAFE, Successive BA, or the FMþFS classification. The accuracy of Succes-sive SAFE was independently influenced by age, sex, and ALT level. Indeed, Successive SAFE was quite inaccurate at high ALT levels, especially in older men (Fig. 4A). The success rate of FibroScan had no influ-ence on the diagnostic accuracy of Successive BA or the FMþFS classification. In this setting, it has been already been shown that IQR/M was the only Fibro-Scan characteristic that had a significant impact on its accuracy.20 In our study, IQR/M influenced the accu-racy of the FMþFS classification but not that of Suc-cessive BA. This was due to the high rate of liver bi-opsy (49.8%) required by Successive BA. In fact, the FMþFS classification is more sensitive to the influence of IQR/M than Successive BA because its diagnosis depends on the FibroScan results in all patients (0% liver biopsy required). In addition to IQR/M, the ac-curacy of the FMþFS classification was independently influenced by age and ALT level. However, the accu-racy of the FMþFS classification remained higher than 80% in the various subgroups resulting from the com-bination of these three parameters (Fig. 4B).
In conclusion, SAFE and BA for binary diagnoses of significant fibrosis or cirrhosis have excellent diag-nostic accuracy in chronic hepatitis C. However, in clinical practice, the significant fibrosis algorithm and the cirrhosis algorithm have to be used successively, which induces a significant decrease in diagnostic accu-racy and a significant increase in the rate of required liver biopsy. A new noninvasive classification of fibrosis synchronously combining FibroScan and FibroMeter
results allows for an entirely noninvasive (0% liver bi-opsy required) and precise (six fibrosis classes) diagno-sis of liver fibrodiagno-sis with a diagnostic accuracy (87%) that is not significantly different from those of SAFE and BA.
Acknowledgment: The SNIFF 32 study was con-ducted by the following: Angers: Sophie Michalak, Anselme Konate´, Catherine Ternisien, Alain Chevailler, Franc¸oise Lunel, Marie Christine Rousselet, Wael Mansour; Provence-Alpes-Coˆte-d’Azur (PACA): Phil-ippe Halfon, Marc Bourlie`re, Denis Ouzan, Albert Tran, Danielle Botta, Christophe Renou, Christophe Sattonnet, Marie-Christine Saint-Paul, Thierry Bender-itter, Ste´phane Garcia, Henri Pierre Bonneau, Guil-laume Penaranda; Tours: Yannick Bacq, Anne de Muret, Marie-Claude Bre´chot; Grenoble: Vincent Leroy, Nathalie Sturm, Marie-Noelle Hilleret, Patrice Faure, Jean-Charles Renversez, Francoise Morel, Can-dice Trocme; Bordeaux: Victor de Ledinghen, Juliette Foucher, Laurent Caste´ra, Patrice Couzigou, Pierre-Henri Bernard, Wassil Merrouche, Paulette Bioulac-Sage, Brigitte Le Bail; and Clichy: Claude Degott, Val-e´rie Paradis.
The VINDIAG 7 study was conducted by the fol-lowing: Grenoble: Vincent Leroy, Nathalie Sturm, Marie-Noelle Hilleret, Patrice Faure, Jean-Charles Renversez, Francoise Morel, Nathalie Sturm, Candice Trocme; Bordeaux: Victor de Ledinghen, Juliette Foucher, Laurent Caste´ra, Patrice Couzigou, Pierre-Henri Bernard, Wassil Merrouche, Paulette Bioulac-Sage, Brigitte Le Bail.
The FIBROSTAR study was conducted by the fol-lowing: Hepatologists: R. Poupon, A. Poujol, Saint-Antoine, Paris; A. Abergel, Clermont-Ferrand; J.P. Bro-nowicki, Nancy; J.P. Vinel, S. Metivier, Toulouse; V. De Ledinghen, J. Foucher, Bordeaux; O. Goria, Rouen; M. Maynard-Muet, C. Trepo, Lyon; Ph. Mathurin, Lille; D. Guyader, H. Danielou, Rennes; O. Rogeaux, Chambe´ry; S. Pol, Ph. Sogni, Cochin, Paris; A. Tran, Nice; P. Cale`s, Angers; P. Marcellin, T. Asselah, Clichy; M. Bourliere, V. Oule`s, Saint Joseph, Marseille; D. Larrey, Montpellier; F. Habersetzer, Stras-bourg; M. Beaugrand, Bondy; V Leroy, MN Hilleret, Grenoble.
Biologists: R-C. Boisson, Lyon Sud; M-C. Gelineau, B. Poggi, Hoˆtel Dieu, Lyon; J-C. Renversez, Candice Trocme´, Grenoble; J. Gue´chot, R. Lasnier, M. Vaubour-dolle, Paris; H. Voitot, Beaujon, Paris; A. Vassault, Necker, Paris; A. Rosenthal-Allieri, Nice; A. Lavoinne, F. Ziegler, Rouen; M. Bartoli, C. Lebrun, Chambe´ry; A. Myara, Paris Saint-Joseph; F. Guerber, A. Pottier, Elibio, Vizille.
Pathologists: E-S. Zafrani, Cre´teil; N. Sturm, Grenoble.
Methodologists: A. Bechet, J-L Bosson, A. Paris, S. Royannais, CIC, Grenoble; A. Plages, Grenoble
We also thank the following contributors: Gilles Hunault, Pascal Veillon, Gwenae¨lle Soulard; and Kevin L. Erwin (for English proofreading).
References
1. Castera L, Vergniol J, Foucher J, Le Bail B, Chanteloup E, Haaser M, et al. Prospective comparison of transient elastography, Fibrotest, APRI, and liver biopsy for the assessment of fibrosis in chronic hepatitis C. Gastroenterology 2005;128:343-350.
2. Sebastiani G, Vario A, Guido M, Noventa F, Plebani M, Pistis R, et al. Stepwise combination algorithms of non-invasive markers to diagnose significant fibrosis in chronic hepatitis C. J Hepatol 2006;44:686-693. 3. Bourliere M, Penaranda G, Renou C, Botta-Fridlund D, Tran A, Portal
I, et al. Validation and comparison of indexes for fibrosis and cirrhosis prediction in chronic hepatitis C patients: proposal for a pragmatic approach classification without liver biopsies. J Viral Hepat 2006;13: 659-670.
4. Bourliere M, Penaranda G, Ouzan D, Renou C, Botta-Fridlund D, Tran A, et al. Optimized stepwise combination algorithms of non-inva-sive liver fibrosis scores including Hepascore in hepatitis C virus patients. Aliment Pharmacol Ther 2008;28:458-467.
5. Becker L, Salameh W, Sferruzza A, Zhang K, Chen R, Malik R, et al. Validation of Hepascore, compared to simple indices of fibrosis, in US patients with chronic hepatitis C virus infection. Clin Gastroenterol Hepatol 2009;7:696-701.
6. Sebastiani G, Halfon P, Castera L, Pol S, Thomas DL, Mangia A, et al. SAFE biopsy: a validated method for large-scale staging of liver fibrosis in chronic hepatitis C. HEPATOLOGY2009;49:1821-1827.
7. Castera L, Sebastiani G, Le Bail B, de Ledinghen V, Couzigou P, Alberti A. Prospective comparison of two algorithms combining non-invasive methods for staging liver fibrosis in chronic hepatitis C. J Hep-atol 2010;52:191-198.
8. Boursier J, Vergniol J, Sawadogo A, Dakka T, Michalak S, Gallois Y, et al. The combination of a blood test and Fibroscan improves the non-invasive diagnosis of liver fibrosis. Liver Int 2009;29:1507-1515. 9. Rashid M, Mitchell JD, Cramp ME, Cross TJ. Limitations of the
algo-rithm for the SAFE biopsy: a noninvasive fibrosis measure in chronic hepatitis C. HEPATOLOGY2010;51:354-355.
10. Boursier J, Bacq Y, Halfon P, Leroy V, De Ledinghen V, De Muret A, et al. Improved diagnostic accuracy of blood tests for severe fibrosis and cirrhosis in chronic hepatitis C. Eur J Gastroenterol Hepatol 2009; 21:28-38.
11. Boursier J, Cales P. Combination of fibrosis tests: sequential or syn-chronous? HEPATOLOGY2009;50:656-657.
12. Cales P, Boursier J, de Ledinghen V, Halfon P, Bacq Y, Leroy V, et al. Evaluation and improvement of a reliable diagnosis of cirrhosis by blood tests. Gastroenterol Clin Biol 2008;32:1050-1060.
13. Cales P, De Ledinghen V, Halfon P, Bacq Y, Leroy V, Boursier J, et al. Evaluating accuracy and increasing the reliable diagnosis rate of blood tests for liver fibrosis in chronic hepatitis C. Liver Int 2008;28: 1352-1362.
14. Boursier J, De Ledinghen V, Zarski J, Rousselet MC, Sturm N, Foucher J, et al. A new combination of blood test and Fibroscan for accurate non-invasive diagnosis of liver fibrosis stages in chronic hepati-tis C. Am J Gastroenterol 2011;106:1255-1263.
15. Zarski H, Sturm N, Guechot J, Paris A. Independent and prospective comparison of 9 surrogate markers for the diagnosis of liver fibrosis in chronic hepatitis C [Abstract]. HEPATOLOGY 2009;50(Suppl 4):
1061A.
16. Leroy V, Halfon P, Bacq Y, Boursier J, Rousselet MC, Bourliere M, et al. Diagnostic accuracy, reproducibility and robustness of fibrosis blood tests in chronic hepatitis C: a meta-analysis with individual data. Clin Biochem 2008;41:1368-1376.
17. Wai CT, Greenson JK, Fontana RJ, Kalbfleisch JD, Marrero JA, Con-jeevaram HS, et al. A simple noninvasive index can predict both signifi-cant fibrosis and cirrhosis in patients with chronic hepatitis C. HEPATOLOGY2003;38:518-526.
18. Cales P, Veillon P, Konate A, Mathieu E, Ternisien C, Chevailler A, et al. Reproducibility of blood tests of liver fibrosis in clinical practice. Clin Biochem 2008;41:10-18.
19. Castera L, Forns X, Alberti A. Non-invasive evaluation of liver fibrosis using transient elastography. J Hepatol 2008;48:835-847.
20. Lucidarme D, Foucher J, Le Bail B, Vergniol J, Castera L, Duburque C, et al. Factors of accuracy of transient elastography (Fibroscan) for the diagnosis of liver fibrosis in chronic hepatitis C. HEPATOLOGY2009;
49:1083-1089.
21. Halfon P, Bacq Y, De Muret A, Penaranda G, Bourliere M, Ouzan D, et al. Comparison of test performance profile for blood tests of liver fi-brosis in chronic hepatitis C. J Hepatol 2007;46:395-402.
22. Thein HH, Yi Q, Dore GJ, Krahn MD. Estimation of stage-specific fi-brosis progression rates in chronic hepatitis C virus infection: a meta-analysis and meta-regression. HEPATOLOGY2008;48:418-431.
23. Bedossa P, Carrat F. Liver biopsy: the best, not the gold standard. J Hepatol 2009;50:1-3.
24. Mehta SH, Lau B, Afdhal NH, Thomas DL. Exceeding the limits of liver histology markers. J Hepatol 2009;50:36-41.