УНИВЕРЗИТЕТ „ГОЦЕ ДЕЛЧЕВ“ – ШТИП
ФАКУЛТЕТ ЗА ИНФОРМАТИКА
GOCE DELCEV UNIVERSITY – STIP
FACULTY OF COMPUTER SCIENCE
ГОДИНА 3
ЈУНИ, 2015
VOLUME III
ГОДИШЕН ЗБОРНИК
2014
YEARBOOK
2014
ГОДИШЕН ЗБОРНИК
ФАКУЛТЕТ ЗА ИНФОРМАТИКА
YEARBOOK
FACULTY OF COMPUTER SCIENCE
Издавачки совет
Проф. д-р Саша Митрев
Проф. д-р Лилјана Колева - Гудева
Проф. д-р Владо Гичев
Проф. д-р Цвета Mартиновска
Проф. д-р Татајана Атанасова - Пачемска
Доц. д-р Зоран Здравев
Доц. д-р Александра Милева
Доц. д-р Сашо Коцески
Доц. д-р Наташа Коцеска
Доц. д-р Зоран Утковски
Доц. д-р Игор Стојановиќ
Доц. д-р Благој Делипетров
Редакциски одбор
Проф. д-р Цвета Mартиновска
Проф. д-р Татајана Атанасова - Пачемска
Доц. д-р Наташа Коцеска
Доц. д-р Зоран Утковски
Доц. д-р Игор Стојановиќ
Доц. д-р Александра Милева
Доц. д-р Зоран Здравев
Главен и одговорен уредник
Доц. д-р Зоран Здравев
Јазично уредување
Даница Гавриловаска - Атанасовска
(македонски јазик)
Павлинка Павлова-Митева
(англиски јазик)
Техничко уредување
Славе Димитров
Благој Михов
Редакција и администрација Универзитет ,,Гоце Делчев“-Штип Факултет за информатика ул. ,,Крсте Мисирков“ 10-A п. фах 201, 2000 Штип Р. МакедонијаEditorial board
Prof. Saša Mitrev, Ph.D
Prof. Liljana Koleva - Gudeva, Ph.D.
Prof. Vlado Gicev, Ph.D.
Prof. Cveta Martinovska, Ph.D.
Prof. Tatjana Atanasova - Pacemska, Ph.D.
Ass. Prof. Zoran Zdravev, Ph.D.
Ass. Prof. Aleksandra Mileva, Ph.D.
Ass. Prof. Saso Koceski, Ph.D.
Ass. Prof. Natasa Koceska, Ph.D.
Ass. Prof. Zoran Utkovski, Ph.D.
Ass. Prof. Igor Stojanovik, Ph.D.
Ass. Prof. Blagoj Delipetrov, Ph.D.
Editorial staff
Prof. Cveta Martinovska, Ph.D.
Prof. Tatjana Atanasova - Pacemska, Ph.D.
Ass. Prof. Natasa Koceska, Ph.D.
Ass. Prof. Zoran Utkovski, Ph.D.
Ass. Prof. Igor Stojanovik, Ph.D.
Ass. Prof. Aleksandra Mileva, Ph.D.
Ass. Prof. Zoran Zdravev, Ph.D.
Managing/ Editor in chief
Ass. Prof. Zoran Zdravev, Ph.D.
Language editor
Danica Gavrilovska-Atanasovska
(macedonian language)
Pavlinka Pavlova-Miteva
(english language)
Technical editor
Slave Dimitrov
Blagoj Mihov
Address of the editorial office Goce Delcev University – Stip Faculty of Computer Science Krste Misirkov 10-A PO box 201, 2000 Štip, R. of Macedonia
За издавачот:
Проф д-р Владо Гичев
3
Годишен зборник 2014Yearbook 2014 Факултет за информатика, Универзитет „Гоце Делчев“ – Штип Faculty of Computer Science, Goce Delcev University – Stip
СОДРЖИНА
CONTENT
АНАЛИЗА НА ТОЧНОСТА НА МЕТОДОТ НА CRANK-NICOLSON ВО
ЗАВИСНОСТ ОД ПАРАМЕТАРОТ НА МЕТОДОТ r
Весна Гунова, Владо Гичев ...5
MULTIMEDIA TECHNOLOGIES IN ENGINEERING EDUCATION
D.Minkovska, L.Stoyanova ...15
МОДЕЛ НА ПРИФАЌАЊЕ И УПОТРЕБА НА РЕПОЗИТОРИУМОТ НАМЕНЕТ
ЗА НАСТАВНИЧКИОТ КАДАР НА УНИВЕРЗИТЕТОТ „ГОЦЕ ДЕЛЧЕВ“ – ШТИП
Мирјана Коцалева , Игор Стојановиќ , Зоран Здравев ...21
РЕШАВАЊЕ НА ТОПЛИНСКА РАВЕНКА СО NEUMANN ГРАНИЧНИ УСЛОВИ
СО УПОТРЕБА НА CRANK NICOLSON МЕТОДОТ
Мирјана Коцалева , Владо Гичев ...33
ГОЛЕМИ ПОДАТОЦИ ЗА ЕДИКАТИВНО ПОДАТОЧНО РУДАРЕЊЕ,
АНАЛИТИКА НА ПОДАТОЦИ И ВЕБ РАБОТНИ ТАБЛИ
Зоран Милевски, Елена Гелова, Зоран Здравев ...39
АЛАТКИ ЗА ВИЗУАЛИЗАЦИЈА НА СОФТВЕР
Александра Стојанова, Наташа Стојковиќ, Душан Биков ...47
VALUATION OF FACTORS AFFECTING THE UNEMPLOYMENT RATE OF YOUNG
PEOPLE IN REPUBLIC OF MACEDONIA
Tatjana Atanasova Pacemska1, Elena Mitreva ...56
NUMERICAL ANALYSIS OF BEHAVIOR FOR LORENZ SYSTEM
WITH MATHEMATICA
Biljana Zlatanovska ...63
ДИГИТАЛЕН ВОДЕН ЖИГ ВО СЛИКА ВО ФРЕКВЕНТЕН ДОМЕН СО
ДИСКРЕТНА КОСИНУСНА ТРАНСФОРМАЦИЈА
Ана Љуботенска, Александра Милева ...73
COMPARING OF THE BINOMIAL MODEL AND THE BLACK-SCHOLES MODEL
FOR OPTIONS PRICING
ГОЛЕМИ ПОДАТОЦИ ЗА ЕДИКАТИВНО ПОДАТОЧНО РУДАРЕЊЕ, АНАЛИТИКА НА ПОДАТОЦИ И ВЕБ РАБОТНИ ТАБЛИ Зоран Милевски1, Елена Гелова2, Зоран Здравев2 1Факултет за информатика, Универзитет „Гоце Делчев“, Штип [email protected] 2Факултет за информатика, Универзитет „Гоце Делчев“, Штип (elena.gelova, zoran.zdravev)@ugd.edu.mk Апстракт. Во оваа ера на големи податоци училиштата и универзитетите собираат безброј информации. Но, голем дел одтие податоци се чуваат на начин што ги прават тешко пристапливи за наставниците и менаџерите. Обично пишаните извештаи кажуваат само една приказна или само еден дел од собраните информации. Многу образовни установи користат Moodle во процесот на учење и кога станува збор за поголем број на корисници и учесници се разбира станува тешко да се следат нивните активности во курсевите. За да се направи учењето поефикасно, важно е да се овозможи персонализација врз учесниците, врз основа на нивната активност, можност да се анализира нивната активност во различни курсеви, да се предвидат резултатите на учесниците и подобро да се истражат активностите на учениците. Целта во овој труд е да се опише процесот на селекција и добивање на податоци од базата на податоцина Moodle со употреба на техники за податочно рударење и да се креира работна табла – веб базирана апликација која ќе комуницира со Moodle и ќе обезбеди пристап на повеќе нивоа и практично ќе го подобри пристапот кон евалуација на поголеми групи на учесници во процесот на учење и ќе овозможи наставниците да дознаат повеќе за тоа како учат учениците. Клучни зборови: далечинско учење, е-учење, едукативно податочно рударење, Мoodle, едукативни контролни табли, извештаи во повеќе нивоа
BIG DATA FOR EDUCATION DATA MINING, DATA ANALYTICS AND WEB DASHBOARDS Zoran Milevski1, Elena Gelova2, Zoran Zdavev2
1Faculty of computer science, Goce Delcev University, Stip, Macedonia
2Faculty of computer science, Goce Delcev University, Stip, Macedonia
(elena.gelova, zoran.zdravev)@ugd.edu.mk
Abstract. In this era of big data, school and universities are gathering tons of information. But much of that data is stored in ways that make it difficult for teachers and managers to access it. Usually written reports tell only one story or display just one piece of information. Many educational institutions use Moodle as educational environment in the process of learning and when it comes to a bigger number of users and course participants it becomes hard to follow their activity in the courses. To make studying more effective, it is important to supply personalization of the participants, based on their activity, an opportunity to analyze their activities in different courses, predict the results of the participants and get better survey of the activities of the students. The goal of this work is, by the use of data mining techniques to describe the process of selection and acquiring data from the Moodle database, and to create dashboard - web based application, that would communicate with Moodle and supply multilevel approach, and practically improve the approach to evaluation of larger groups of participants in the learning process and will help teachers to learn more about how students learn.
Keywords: Distance Education, E-learning, Educational data mining, Moodle, Educational Dashboard, Multilevel reports
1.
Introduction
Interest in the material to be learned is the best stimulus to learning, rather than such external goals as grades or later competitive advantage. It is very important how this material is presented, whether it motivates us to explore and whether it will be available in the future if we need to remind ourselves of what we have learned and want to go deeper into the details for the field of interest.
There are many systems for so-called electronic learning used by many teachers for easier presentation of learning materials in front of their students. The usage of this web-based educational systems has increased rapidly in the past few years. Many universities even offer courses for e-learning and ensure quick, easy and effective study of a given material. The impact on this trend comes from the fact that neither teachers nor students are limited any longer to be at the same time on the same location.
In this paper we use Moodle (Modular Object Oriented Developmental Learning Environment) as an educational system that is well known and widely used because it is open code, and it is also simple to use both for the teachers and the students as course participants [1], [2], [3].
40
Годишен зборник 2014
Yearbook 2014 Факултет за информатика, Универзитет „Гоце Делчев“ – Штип Faculty of Computer Science, Goce Delcev University – Stip
Moodle stores great amount of data in its database that is very important when analyzing the students conduct and represents a gold mine of educational data. Many online activities and communications occur during the online learning process. Although Moodle, as well as the other systems of this type, offers tools for reports and view of the more important activities of the course participants, when it comes to a bigger number of students it becomes hard to follow their activity in the courses. To make studying more effective, it is important to supply personalization of the contestants, based on their activity, an opportunity to analyze the participants in different courses, prediction of the results of the participants and better survey of the activities of the students. A promising area, when it comes to fulfilling this goal is data mining, and in this case it is educational data mining with the Moodle database [3], [6].
Educational data mining means selective extraction of the kept data of large databases, their processing with the use of several educational techniques of data mining such as classification, clustering, statistics, regression etc. and acquiring the processed data that would improve the approach to larger groups of participants in the learning process [7]. The processed information can be useful for teachers but also for the students. Teachers receives reports for the advancing in the learning of the students, and the students gets feedbacks from the teachers for their activities that would improve their learning.
The goal is to make one web-based application so called dashboard that will work in several levels of approach as: manager, teacher and student role. All these previously mentioned feedbacks and reports, well organized are contained in this dashboard. The idea is to build one application that will not work as plugin, but will represent independent application because have more futures that are easy to use, without any further training. Maybe this complex to use plugins and various techniques for mining was a barrier for many teachers to use Moodle as modern tool in the learning process and harnessing the potential of Moodle in terms of getting different reports with a few clicks about when and how students learn.
Whether implemented in primary or secondary education or university this dashboard gives excellent reports that Moodle does not as such. In our previous work we explore the efficiency in the usage of e-learning Moodle in the process of education in high school and educational data mining with Moodle 2.4 and using that research we see the need of building useful reports and alerts which will provide organized data on multiple levels in the organization such managers, teachers and students. [13] [14]
2.
Preparing the data
Educational data mining is an interactive process in which not only the processed data can be acquired, but it can also be filtered so that a certain decision can be made. The process consists of gathering information about the students’ interaction within the process, than data processing so that they can be transformed into a relevant format to be mined. Data mining is applied, i.e. algorithms are used that provide and summarize the acquired interests about a certain user (teacher, student, manager etc.). Finally, the results are interpreted, evaluated and represented [2], [6].
Moodle doesn’t keep the records as text, but keeps them in relational MySQL database. Moodle database has around 145 related tables, but all of them are not necessary to implement educational data mining.
Figure 1 illustrates the data preparation and analysis procedure of this study. First we use SQL (Search Query Language) to get data from the Moodle database, and then save the data in another separate database as warehouse. The data preprocessing phase was performed to reduce the redundant data.
To get certain reports it is important to analyze several tables from the database so that a summary of the system activities can be provided, to get user-friendly results scheme. That is the aim of this research, with which we consider that system users (all within their own role) will get view in their activities.
While researching about all this idea of making simple, but rich with reports dashboard, we ask ourselves about the most needed indicators or learning outcomes of students in an online learning environment. That helps us in better approach in analyzing server logs to understand student behaviors and then improved the web-based learning environment accordingly.
Слика 1. Процес на претподготовка и анализа на податоци Figure 1 Data Preparation and Analysis Process
In the process of data collection in the Moodle database we create variables that we fill with needed data and transform them into table fields assigned with proper data attributes. All data fields were organized with tables and formed a rational database.
Table 1 shows a list of some variables from the logs taken from the Moodle MySQL. Табела 1. Пример на некои поважни променливи од записите на Moodle Table 1 Example of some variables from the Moodle logs
Variable name Description
$korisnik_id User ID
$vkupno_logini Total user logins in the system
$korisnik_vk_pominato_vreme Total time spent in the registered courses $korisnik_broj_kursevi Number of courses enrolled by user $vkupno_rez_dokum Total resources in the user courses $vkupno_aktiv_forumi Number of forums in the courses $korisnik_br_najavuvanja Total number of logins last month $korisnik_lastaccess When was the last time accessed course materials
Just from these variables we present the dashboard users reports with processed data from the original database.
For example in the figure 2 we show the user a view of the placed resources in all courses or in specific course (if the user is teacher or student, the list of courses contains only courses where they are enrolled).
Another report obtained by the values of the previously mentioned variables shows the time spent in the system. If we want to check if the user is active or inactive user in the courses, or something similar, we need to use some of the mining techniques that are explained later in this paper.
It’s only matter of SQL queries in order to another report shown in figure 3, figure 4 and figure 5. In figure 3 the shown table gives information about all teachers and course creators with data for teacher name and placed resources like pages, documents, URL’s, assignments, polls, forums, discussions in forums and quizzes.
42
Годишен зборник 2014
Yearbook 2014 Факултет за информатика, Универзитет „Гоце Делчев“ – Штип Faculty of Computer Science, Goce Delcev University – Stip
Слика 2. Страница на ресурси во работната табла Figure 2 Resources page in the dashboard
The variable identification from table 1 not only provides observation parameters but also leads to the construction of a predictive model, which enables instructors to predict students learning performance through real-time data mining analysis.
Слика 3. Табеларна презентација на курсеви, ресурси и активности во курсевите Figure 3 Tabular presentation of courses, resources and activities in courses
For example, the teacher may build a predictive model with data collected in the first month and then to be able to identify the students that need assistance in learning the material previously learned. With the
information from all this reports teacher may change strategy even during the school year if he notice that the learning material is difficult to the students, or otherwise, the learning material is easy to the students and may decide to go into details for the learning subject.
In the figure 4, the graph illustrates the activity of the enrolled participants given by days.
Слика 4. Активност по денови во даден курс Figure 4 Activity by days in given course
Another report, that is shown in figure 5, gives preview of the activity in the resources and participant activities in given course.
Слика 5. Активности и ресурси и нивни преглед во даден курс Figure 5 Activities and resources and their preview in given course
3. Use of data mining techniques
Besides analyzing the data in the Moodle database, it is very important how the data will be grouped in order to achieve the required effect.
For that purpose we hold up on data mining and we use some of the known techniques that can provide us all necessary information and data in the effort to give the teacher simplified view on the processed knowledge.
In e-learning systems clustering can be useful for finding similar characteristics students clusters, revealing the user conduct and grouping the students into several groups: students who are active in the system, discuss in forums, send homework, spend some time in the system in checking different contents etc. [6].
44
Годишен зборник 2014
Yearbook 2014 Факултет за информатика, Универзитет „Гоце Делчев“ – Штип Faculty of Computer Science, Goce Delcev University – Stip
In this research we will divide students into three clusters as follows: cluster 0 (inactive), cluster 1 (very active), and cluster 2 (active course participants). Cluster 0 is characterized by students who haven’t sent homework, have read only few messages, took only few quizzes and spent very little time in checking the resources, activities and forum participation. Cluster 1 is characterized by students who have sent at least one message in the forum, have read at least three messages, have passed successfully at least half of the quizzes and have finished less than half of them unsuccessfully and have high score and grades. Cluster 2 is characterized by students who have lower score than students in cluster 1 and more than the students in cluster 0. In this way the teacher can use these information so that he can divide the students into groups of different type of students for example at least one student from cluster 1 and students from the other clusters or a group of students from cluster 1 who would work on problem assignments of higher degree than the others [6], [12].
Classification of participants is used to discover potential students with similar characteristics for a definite specific pedagogical strategy, to predict the final results for a group of students, even to identify the students who need motivation to get better results.
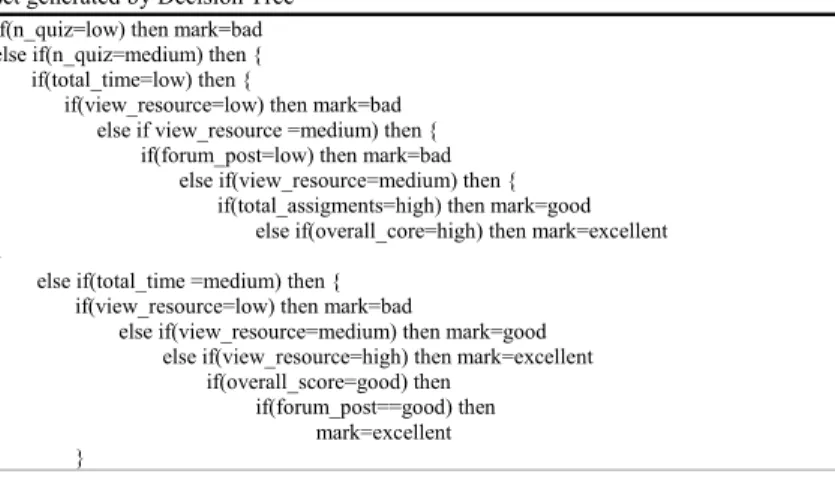
We divide the students into bad, good and excellent by generating decision trees that involve certain classification rules. Our goal is to classify students in different groups depending on their activity in Moodle. Table 2 represents the knowledge by decision tree with if-else rules. This process goes on until all data are classified perfectly or we run out of attributes. Students with lower number of passed quizzes are classified as weak students, students with bigger number of quizzes are classified as excellent and the students with an average number of quizzes as good and of course taking into account the total time spent on resources and activities, the number of sent homework assignments etc. [6], [9], [11].
Табела 2. Множество правила генерирани од одлучувачко дрво Table 2 Rule set generated by Decision Tree
if(n_quiz=low) then mark=bad else if(n_quiz=medium) then { if(total_time=low) then {
if(view_resource=low) then mark=bad else if view_resource =medium) then { if(forum_post=low) then mark=bad else if(view_resource=medium) then { if(total_assigments=high) then mark=good else if(overall_core=high) then mark=excellent }
else if(total_time =medium) then { if(view_resource=low) then mark=bad
else if(view_resource=medium) then mark=good else if(view_resource=high) then mark=excellent if(overall_score=good) then
if(forum_post==good) then mark=excellent }
4.
Conclusion
Data mining techniques are powerful tools for discovering hidden knowledge. In this paper we give analyses of the raw data from the Moodle database, their potential in receiving useful conclusions for the activity of all roles in the system. Also we give a look at the results from the data mining with the use of several techniques applied on the application that works with several levels of approaches. It is very important to integrate the data mining tools in the e-learning environments which is the goal of this research, because in this way all these data mining techniques will be applied in a single application and the feedback and the acquired results will be directly applied on the e-learning environments [17]. Here are several data mining techniques that can be used for acquiring processed results and reports in the process of learning, and they are not complicated to be used by the teachers. That is why this approach of creating dashboard – web based application, which is user-friendly and give better control when it comes to larger groups of students when the standard reports reduce the control clarity and the ability to evaluate their results at the end of the course [3], [5], [17]. Nowadays, data mining tools are too complex to be used by the educators and their futures go beyond the scope of what educator might to do. By creating a dashboard that would communicate with the e-learning system Moodle, the teachers can easily evaluate web activity in order to get more objective feedback, and find out more about students capability in successfully passing the exam. Also this dashboard will directly solve the teacher’s problems in supplying support in dealing with various kind of algorithms. It could also be oriented towards the academics and administrators responsible in order to obtain parameters about how to improve site efficiency and adapt it to the behavior of their users, have
measures about how to better organize institutional human and material resources and their educational offer, enhance educational program offers, etc.
Further ideas, implementations and improvements are planned to be integrated in this Moodle dashboard that are important for the goal to be fully achieved. For example building alerts where the managers or the teachers can see which user has not signed up for some time, mark for courses that have no content and courses where the resources are not read by the participants.
All previously transformed data using educational data mining are stored in a warehouse, separate database and will be available for additional research in order to improve the work of the teachers and the way that students learn their material more efficiently.
Референци (References)
[1] Ramaswami M., and Bhaskaran R.: A Study on Feature Selection Techniques in Educational Data Mining”, vol.1, Journal Of Computing, ISSN:2151-9617, https://sites.google.com/site/journalofcomputing (December 2009)
[2] Hung, Jui-Long Hung, and Ke Zhang. Revealing Online Learning Behaviors and Activity Patterns and Making Predictions with Data Mining Techniques in Online Teaching. Vol. 4. N.p.: MERLOT Journal of Online Learning and Teaching, 2008. N. pag. 4 vols. Web. 18 June 2014. <http://jolt.merlot.org/vol4no4/hung_1208.htm>.
[3] Baradwaj B. K., Pal S.:Mining Educational Data to Analyze Students’ Performance, (IJACSA) International Journal of Advanced Computer Science and Applications, vol. 2, no. 6 (2011)
[4] Yadav S. K., Bharadwaj B., Pal S.:Mining Education Data to Predict Student’s Retention - A comparative Study, (IJCSIS) International Journal of Computer Science and Information Security, vol. 10, no. 2 (2012)
[5] Cocea M., Weibelzahl S.: Disengagement Detection in Online Learning - Validation Studies and Perspectives, IEEE transactions on learnin technologies, vol. 4, no. 2 (April-June 2011)
[6] Romero C., Ventura S., García E.:Data mining in course management systems - Moodle case study and tutorial [7BAKER R.S.J.D., YACEF K.:The State of Educational Data Mining in 2009 - Review and Future Visions
[8] Retalis S., Papasalouros A., Psaromiligkos Y., Siscos S., Kargidis T.: Towards Networked Learning Analytics – A concept and a tool
[9] Romero C., Ventura S., Espejo P. G. and Hervás C.: Data Mining Algorithms to Classify Students, The 1st International Conference on Educational Data Mining, Montréal, Québec, Canada, pp. 8-18 (June 20-21, 2008)
[10] Yadav S. K., Pal S.: Data Mining - A Prediction for Performance Improvement of Engineering Students using Classification, World of Computer Science and Information Technology Journal (WCSIT) ISSN: 2221-0741 vol. 2, no. 2, pp. 51-56 (2012)
[11] Dash M., Liu H.:Feature Selection for Classification, An International Journal of Intelligent Data Analysis, vol. 1, no. 3,2006, pp. 131-156 (1997)
[12] Chen G., Liu C., Ou K., Liu B.: Discovering decision knowledge from web log portfolio for managing classroom processes by applying decision tree and data cube technology, Journal of Educational Computing Research, pp. 305–332 (2000)
[13] Milevski, Zoran, Nevenka Pop-Angelova, and Zoran Zdravev. Efficiency in the usage of e-learning Moodle in the process of education. 10th ed. N.p.: International Conference on Informatics and Information Technologies, 2013. 16-19. Faculty of Computer Science and Engineering, Ss Cyril and Methodius University - Skopje, Macedonia . Web. 10 May 2014. <http://ciit.finki.ukim.mk/data/papers/10CiiT/10CiiT-04.pdf>.
[14] Milevski, Zoran, and Zoran Zdravev. Education data mining with Moodle 2.4. Yearbook ed. Vol. 2. Stip: Faculty of Computer Science, Goce Delcev University – Stip, 2014. 65-72. Faculty of Computer Science, Goce Delcev University – Stip. Web. 10 May 2014. <http://eprints.ugd.edu.mk/10338/1/778-1338-1-PB.pdf>.
[15] Moodle org. LMS Moodle official site. web. 11 Apr. 2014, http://moodle.org
[16] High school Dobri Daskalov, E-learning Moodle, Kavadarci, R. of Macedonia: n.p., 2009. web. 11 Apr. 2014,
http://moodle.dobridaskalov.edu.mk
[17] Darrell M. W.:Big Data for Education - Data Mining, Data Analytics, and Web Dashboards, U.S. Department of Education Office of Educational Technology, Enhancing Teaching and Learning Through Educational Data Mining and Learning Analytics”, pp. 36 (2012)