Enhanced Attention Using Head-mounted Virtual Reality
Gang Li
1, Joaquin A. Anguera
2, Samirah V. Javed
2, Muh
. ammad Adeel Khan
1,
Guoxing Wang
1, and Adam Gazzaley
2Abstract
■ Some evidence suggests that experiencing a given scenario using virtual reality ( VR) may engage greater attentional re-sources than experiencing the same scenario on a 2D computer monitor. However, the underlying neural processes associated with these VR-related effects, especially those pertaining to cur-rent consumer-friendly head-mounted displays of virtual reality (HMD-VR), remain unclear. Here, two experiments were con-ducted to compare task performance and EEG-based neural metrics captured during a perceptual discrimination task pre-sented on two different viewing platforms. Forty participants (20–25 years old) completed this task using both an HMD-VR and traditional computer monitor in a within-group, randomized
design. Although Experiment I (n= 20) was solely behavioral in design, Experiment II (n= 20) utilized combined EEG record-ings to interrogate the neural correlates underlying potential performance differences across platforms. These experiments revealed that (1) there was no significant difference in the amount of arousal measured between platforms and (2) selec-tive attention abilities in HMD-VR environment were enhanced from both a behavioral and neural perspective. These findings suggest that the allocation of attentional resources in HMD-VR may be superior to approaches more typically used to assess these abilities (e.g., desktop/laptop/tablet computers with 2D screens). ■
INTRODUCTION
From old tachistoscopes (Leark, Greenberg, Kindschi, Dupuy, & Hughes, 2018; Eriksen & Eriksen, 1974) to standard personal computer (PC) monitors (Fan, McCandliss, Sommer, Raz, & Posner, 2002; Posner, Snyder, & Davidson, 1980), the technical advances in task presentation and data collection platforms have played an essential role in cognitive neuroscience research. Today, such advances are elevated to the next level by leveraging a burgeoning technology—consumer-friendly virtual reality ( VR)—since 2016 (Ewalt, 2016).
VR is a communication medium that leads an individual to perceive experiences as if they or their companions were physically present in an independent or shared envi-ronment (Markowitz, Laha, Perone, Pea, & Bailenson, 2018). VR experiences can be designed to engage any or all of the senses, although the term VR is typically used with respect to visual environments presented using three technologies: nonimmersive VR (e.g., a standard flat screen PC monitor or large screen-based experience, where the user’s viewpoint is movable by preprogrammed manipulations using a keyboard, mouse, or other input de-vice [Slobounov, Ray, Johnson, Slobounov, & Newell, 2015; Robertson, Card, & Mackinlay, 1993]), semi-immersive VR (e.g., 3D glasses-based VR), and semi-immersive VR (IVR; Bailey & Bailenson, 2017).
IVR is primarily characterized by three immersive tech-nologies, resulting in a stronger stereoscopy effect, a broader field of view (FOV), and a movable viewpoint via better head/body tracking (Cummings & Bailenson, 2015). There are two commonly used forms of IVR (Robertson et al., 1993): cave automatic virtual environ-ments (CAVEs) and head-mounted displays (HMDs). A CAVE is a specially designed room in which the walls, ceiling, and/or floor are covered with a screen that can project virtual images or videos (Bailey & Bailenson, 2017). An HMD is a VR headset that positions two small screens in front of both eyes, completely blocking out the physical world including the user’s body, and allows users to turn their head to examine their surroundings, with the visual presentation moving in the opposition di-rection of head motion with low latency (Bailey & Bailenson, 2017; LaValle, Yershova, Katsev, & Antonov, 2014; Jerald, 2010). Although a CAVE has many immer-sive qualities, the current state-of-the-art IVRs adopt consumer-friendly HMDs, including PC-powered HMDs (i.e., HTC Vive), smartphone-based HMDs (i.e., Samsung Gear), and all-in-one HMDs (i.e., Oculus Quest), to achieve immersive effects in a manner that is both simple and inexpensive.
One of the direct psychological responses to such im-mersive technologies or experiences has been described as sense of presence (SoP; Witmer & Singer, 1998). SoP can be classified into self-presence, social presence, and environmental/spatial presence (Bailey & Bailenson, 2017; Heeter, 1992). Both self-presence and social
1
Shanghai Jiao Tong University,2University of California, San Francisco
presence refer to the degree that users identify their body with avatars in a virtual environment, whereas envi-ronmental presence refers to the degree that the virtual environment feels real. There is some evidence that SoP can be enhanced through immersive approaches. For example, participants performing a navigation task in a semi-immersive VR environment exhibited stronger SoP than those using a non-immersive VR (Slobounov et al., 2015; Kober, Kurzmann, & Neuper, 2012). Interestingly, studies examining the neural correlates of SoP evidenced increased neural activity in a metric traditionally used to assess attention, theta power (Baka, Stavroulia, Magnenat-Thalmann, & Lanitis, 2018; Abromavicius, Gedminas, & Serackis, 2017; Kober et al., 2012). From these findings, two distinct theories involving SoP emerge: one is that SoP is enhanced by immersive ef-fects (Slater & Wilbur, 1997), whereas the other one is that SoP is enhanced by attentional focus ( Witmer & Singer, 1998).
These theories have been probed in part by re-searchers examining whether attention can be enhanced by immersive effect that are associated with better task performance. For example, previous work has demon-strated that participants in a desktop VR or semi-VR envi-ronment show better performance on attention tasks compared with conventional paper-and-pencil tests in stroke patients (Fordell, 2017; Buxbaum et al., 2008). Also, participants performing a search task in HMD-VR conditions presented better performance compared with their performance in desktop VR conditions (Pausch, Proffitt, & Williams, 1997). A comparative study of a stan-dard 2D monitor (fixed viewpoint) and IVR reported bet-ter performance on a set of attention training tasks delivered via a (outdated) HMD-VR to suspected individ-uals with attention-deficit/ hyperactivity disorder (Cho et al., 2002). In this study, neural metrics such as beta power were used as neurofeedback control for attention level; however, the authors did not quantitatively analyze its association with improved task performance. Another comparative study of a 2D cinema screen (fixed view-point) and IVR reported better attentional control on Stroop tasks, which was associated with increased pre-frontal alpha power. This improved performance was only observed in the consumer-friendly HMD (Oculus Rift)-based neurofeedback training group (Berger & Davelaar, 2018). However, the authors used different visual stimuli in the neurofeedback training tasks, such as a 3D vase in the IVR, but a 2D square on the cinema screen.
These findings suggest that the use of semi-immersive and IVR versus non-immersive platforms may confer attention-related benefits, such as increased SoP and task performance. However, it is still unclear if these benefits are simply attributable to higher arousal levels. Although a precise definition of arousal is somewhat lacking, it is generally accepted that arousal refers to the general state of readiness of an individual without a specific target or stimulus ( Whyte, 1992), which can subsequently
determine the amount of attentional resources needed for a given task (Polich, 2007; Coull, 1998). Under-standing how arousal levels may differ in IVR versus 2D environments is a critical step toward understanding how subsequent behavioral and neural interpretations of performance are affected by this physiological mea-sure. Therefore, the aim of this study is twofold: (1) to investigate whether selective attention (defined here as one’s ability to properly allocate attentional resources to a relevant stimulus or ignoring an irrelevant stimulus) could be enhanced in IVR with respect to SoP and (2) to understand how arousal, attention, and SoP differ between 2D and IVR environments.
The first stage of this study (Experiment I) was to as-sess behavioral performance metrics on an adaptive and gamified perceptual discrimination task, modified from the Posner task (Posner, 1980), to quantitatively evaluate selective attention abilities using a standard PC 2D mon-itor versus an HMD-VR platform. Our second stage (Experiment II) was to replicate in another study group potential VR-based performance advantages while simul-taneously assessing arousal, attention, and SoP using dif-ferent EEG-based neural metrics. Given that an HMD-VR is expected to offer a greater immersive experience (compared with a 2D monitor), we hypothesized that participants engaged in the task in the HMD-VR platform would show better behavioral performance and SoP, as well as neural correlates associated with heightened at-tention. If we find that the enhanced attention is simply due to heightened arousal, then one could surmise that modern IVR may not be as useful as predicted for atten-tion research, because many alternatives for enhancing arousal already exist (such as gorgeous visual effects and fascinating game stories). On the other hand, if we can demonstrate that attention-based performance in consumer-friendly IVR platform is indeed improved in a manner that is independent of arousal, then the use of such technologies could have profound benefits associated with assessing attention (and potentially for cognitive training interventions).
METHODS
Selective Attention Task ( Virtual Attention)
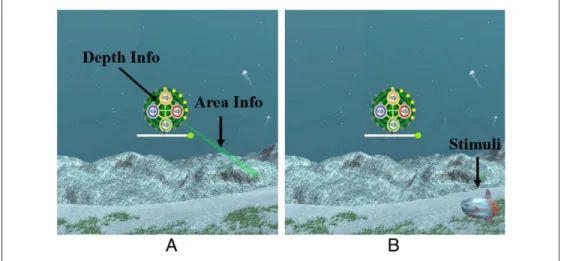
Engaging attention with the highest level of selectivity is critical to function effectively in the complex environments that we inhabit (Gazzaley & Rosen, 2016). To assess selec-tive attention abilities in this study, we used virtual atten-tion ( VA), a novel HMD-VR gaming platform (as shown in Figure 1) developed at University of California, San Francisco’s Neuroscape to assess the selective attention abilities in the form of a perceptual discrimination task with the ability to collect simultaneous EEG recordings without motion–scene interactions. The VA game was developed from the principles of a previous cognitive assessment/ intervention—DAT (distributed attention task; Rolle,
Anguera, Skinner, Voytek, & Gazzaley, 2017), which was based on a traditional Posner task (Posner, 1980).
Each trial of the VA game begins with the appearance of a composite cue (see Figure 2), indicating the area (parallel to the PC screen/HMD screen) and depth (verti-cal to the PC screen/HMD screen) where a single ocean animal (either a “Target”or“Distractor”stimuli) would appear. Both Target and Distractor stimuli were presented in a pseudorandomized fashion, with each being ran-domly associated with one of four colors (red, yellow, blue, and green) on a trial-by-trial basis. The composite cue, consisting of area and depth information, appeared on the screen for 300 msec. The larger the area (the deeper the depth), the more difficult to predict where the stimuli would appear.
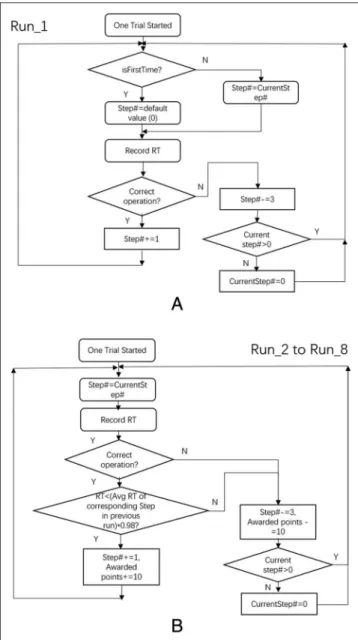
An adaptive algorithm was used to adjust the game dif-ficulty in response to real-time changes in a player’s be-havioral performance on a trial-by-trial basis. This algorithm was implemented in the form of a staircase al-gorithm, with a 1-up/3-down staircase ratio (Anguera, Boccanfuso, et al., 2013), allowing for the task to become a little harder (one level forward to reduce the position information of the stimuli) after a correct response within the RT limit; otherwise, make the task a little easier (three levels back to increase the position information of the stimuli).
Specifically, as shown in Figure 3, this algorithm started with a thresholding run (Run 1) for each partici-pant, with a max 2-sec timeout to record current RTs (the time between the appearance of the sunfish and the Figure 1.Experimental settings. Here, two experiments were conducted to compare performance and EEG-based neural metrics captured during a perceptual discrimination task, presented on two different viewing platforms (standard PC monitor vs. HMD-VR). A fake VR headset (lenses-removed, cell phone VR headset) was used when the participant was playing a game on a standard PC monitor to balance for the sense of wearing something on the head during testing.
Figure 2.VA paradigm. (A) Examples of the area cue (the light green sector) and depth cue (the yellow ring) in Level 1, indicating the exact stimuli position (100% position information) associated with a shallow depth (close to the participant’s viewpoint). As the game difficulty increased (11 game levels in total), the diameter of the depth cue became larger and larger, until the area cue became a 360° circle, indicating less and less position information of the stimuli. (B) The stimuli (target/ distractor) is presented based on the cues.
moment they press the button) for each level and then the averaged RT limits for each level were calculated. Before being applied in the second run (Run 2), the av-eraged RT limits were reduced by 2% to keep pushing the participant over the course of the experiment. The Run 2 calculated RT limits in the same way until the last run. Thus, each participant finally obtained the updated and personalized RT limit for each executed level, de-pending on their behavioral performance in previous runs. It is important to note that“run”here means a sin-gle continuous game play, about 4 min in this study, and the participant needed to complete four VR runs and four 2D runs in total.
Before the experiment started, participants were in-structed to adjust the eyes-to-VR lens distance until they could see the VR scene clearly or adjust the chair to
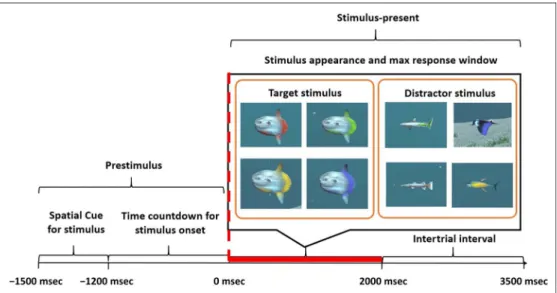
where they were accustomed to seeing the monitor. Therefore, there was no designated fixed eye-to-2D/ VR screen distance. Also, to help minimize the novelty ef-fects for both VR and the assessment itself, all partici-pants completed 5 min of practice to familiarize themselves with the controller in both the VR and 2D en-vironments. During the experiment, participants were in-structed to keep their eyes fixated on a central fixation cross at all times and keep their dominant-hand thumb on the home position of the wireless controller (Xbox 360) until the appearance of a given stimulus type. Upon the appearance of the stimuli, participants were in-structed to press the color-matched buttons if it was a target (a sunfish) and to not release their thumb from the home position if it was a distractor (any other fish). Real-time RT feedback was presented trial-by-trial, with a progress bar. Animation and sound effects were used to provide immediate posttrial feedback to the participant, depending on whether they accurately responded. The interval between the cue and the ocean animal presenta-tion was set at 1.2 sec and designed as a countdown an-imation via lighting of small red dots. The intertrial interval (ITI) was set at 1.5 sec. Therefore, each trial time was fixed, 0.3 + 1.2 + 2 + 1.5 = 5 sec (see Figure 4 for the single trial structure). Here, we examined neural ac-tivity distinctly when (i) there was no stimuli presented on the screen (stimulus-free period; thus, during the prestimulus and ITI stages combined) as well as (ii) dur-ing the stimulus-present period (the time period be-tween stimulus onset and ITI) as shown in Figure 4.
For EEG data collection in Experiment II, we used a 20-channel wireless EEG recording device (Enobio), which uses a high-resolution, high-speed, analog-to-digital con-verter (24 bit at 500 sampling rate) and supports a WiFi connection. Conventional wet electrodes were used and placed at all 20 channels, including frontal (Fp1, Fp2, Fz, F3, F4), central (C3, Cz, C4), temporal (T7, T8), parietal (P3, P4, P7, Pz, P8), and occipital (O1, O2) regions. The ground and reference electrodes were connected together and placed on the right earlobe by an ear clip. An external electrode was placed below the lower eyelid to record eye movements.
Study Design
Hardware and Software Architecture
To evaluate the hypothesis that the HMD-VR would result in better attention performance and attention-based neu-ral activity, we compared performance on this device with a traditional video game platform on a standard PC with a 2D monitor (fixed viewpoint). Figure 5 illus-trates the simplified software architecture of the whole experimental platform, which is composed of three main parts: game engine, base unit, and presentation delivery device. The same game engine and base unit were used in both HMD-VR and 2D conditions, but several inevitable Figure 3.The adaptive and personalized algorithm. This algorithm was
used to control the game difficulty for (A) the thresholding run and (B) Run 2 to last run.
visual differences caused by the presentation delivery de-vice were present, including resolution, refresh rate, frame rate, and FOV (see Table 1).
Specifically, Unity3D (ver. 2017.1.1f1) was used as the game engine, which provides consistency in all build set-tings with respect to rendering and configuration, and the quality of frame rate via the VSync function (designed to match the GPU’s frame rate (approximately 400 fps, measured by Unity3D’s stats function) with the refresh rate of the 2D monitor (60 fps). Note that this variable in particular was set to“off”in this study to reduce the systematic delay in the RT computation. This decision was motivated by the following design logic: First, we de-note refresh rate, frame rate, and the systematic delay in
calculating RT as RR, FR, and Δ, respectively. Assuming that the VSycn in Unity3D was set to “on,” then one would have the RR2D = FR2D = 60 Hz or 60 fps (i.e., 1000/60 = 16.67 msec delay per frame) and RRVR = FRVR = 90 Hz or 90 fps (i.e., 1000/90=11.1 msec delay per frame), indicating that for RT there would be a (16.67 –11.1 =) 5.57 msec systematic delay (Δ) in 2D condition if compared with that under VR condition. Now with VSycn in Unity3D being set to “off,”then we still have RRVR= FRVR= 90 fps (because the VR system forcedly set VSycn to“on”); however, we will have RR2D= 60 fps and FR2D= 400 fps. In this case,Δcan be reduced, as the frame buffer does not need to wait for the whole 16.67 msec for the next frame (i.e., a new frame can be
Figure 5.The software architecture of the whole experimental platform. Figure 4.Single trial structure.
rendered before the previous one is completely done). Although setting VSycn to“off”is not uncommon in pro-fessional first-person game contest to reduce the RT de-lay, this may cause the phenomenon of screen tearing. However, our piloting efforts before study launch did not observe any screen tearing issues visible when VSycn was set to “off,”likely due to our use of a fixed viewpoint in 2D environment and no action game-like objects moving constantly. Therefore, we set VSycn to “off” in current study to reduce any delays in RT calculation.
The base unit aimed to ensure a consistency between the CPU and GPU (NIVIDA GeForce GTX 1070, driver ver. 25.21.14.1967). For the presentation delivery device, the consumer-facing HMD-VRs, Oculus Rift, and HTC Vive (both, 1080 × 1200 per eye resolution, 90 fps re-fresh rate, and 110° FOV ) were used as the HMD-VRs in Experiments I and II, respectively. For the 2D monitor, we used a Dell P2414H in both experiments, with the same 1920 × 1080 resolution. A Unity3D-based VR toolkit (https://vrtoolkit.readme.io) was used to automatically switch the form of visual presentation by loading the HMD-VR SDK or VR simulator SDK. Here, the
mouse-based motion tracking function of the VR simulator was disabled for the purpose of the 2D fixed viewpoint. The purpose of using a VR simulator here aimed to render objects in a VR way, with 2D monitors being the visual presentation device. Furthermore, in Experiment II when the participants were playing on a 2D monitor, they wore lens-removed VR headsets (e.g., sham VR headsets; see Figure 1) to assess whether the sense of wearing a non-functional HMD ( like in Experiment I ) affected the results.
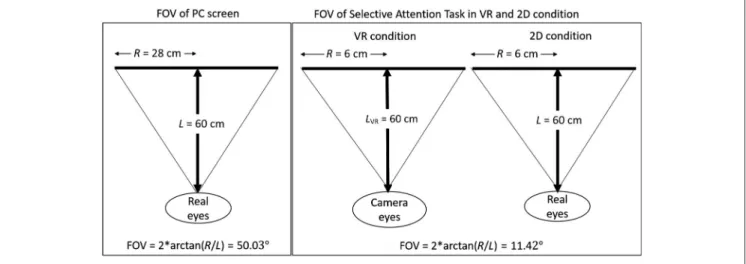
With respect to FOV, according to the HMD specifica-tions, FOV in HMD is 110°, which is bigger than on PC (50.03° = 2*arctan(R/L); see Figure 6), whereRis the half width of the PC screen and L is the eye-to-screen dis-tance. However, the FOV that the selective attention task actually utilized in both HMD and 2D conditions was quite narrow (see Figure 6) with a functional FOV used in our task was 11.42°. At no point during the HMD and 2D conditions did the participants have to move their head to locate a given stimulus. Therefore, if we ig-nore the eye-to-lens distance (about 2 cm) and the indi-vidual difference in eye-to-screen distance, then from the perspective of software design, the FOV of our task be-tween VR and 2D platforms was basically the same.
Experimental Design
The experimental design was a within-group random-ized approach, with participants completing four VR runs and four 2D runs. A run of the same type was per-formed twice before switching to the other type. For example, one participant may have played the eight runs in order “2D➔2D➔VR➔VR➔2D➔2D➔VR➔VR,” w hereas another participant might have played “VR➔VR➔2D➔2D➔VR➔VR➔2D➔2D.” Each run con-tained 50 “Target/Distractor”trials, equally divided be-tween Target and Distractor trial types, presented randomly with no more than four consecutive trial types
Figure 6.FOV calculation.
Table 1.Summary of the Technical Parameters between HMD-VR and 2D Platforms
Parameters HMD-VR 2D PC monitor
Resolution 1080 × 1200 per eye 1920 × 1080 Refresh
rate
90 Hz 60 Hz
Frame rate 90 fps 400 fps FOV 110° for default settings;
however, < 20° for our customized task
Normal individual PC FOV (50°–60°); however, < 20° for our customized task
of either kind consecutively. Note that these parameters were used in our other studies, where a perceptual dis-crimination task was utilized to assess attention-based processes (Rolle et al., 2017; Anguera, Boccanfuso, et al., 2013). Participant performance feedback was pre-sented at the end of each run. Between each run, partic-ipants were given a 2-min break time. Therefore, the total game play was 5 sec × 50 trial × 8 randomized runs = approximately 33 min, with 400 trials in total (200 trials for each platform).
Participants
Forty healthy, right-handed young adults (20–25 years old, eight women) were recruited through online adver-tisements to participate in this study. The participants in Experiments I and II were from the San Francisco Bay Area and Shanghai Jiao Tong University, respectively. All participants had normal or corrected-to-normal vision; had no history of stroke, traumatic brain injury, or psychi-atric illness; and were not taking psychotropic medica-tion. All participants reported playing less than 2 hr of video games per month. Also, all participants reported playing less than 30 min of VR games as of the experi-mental date. Therefore, there were neither professional game players nor naïve VR users. All participants were sat still during the experiment, and no participant reported nausea during or following the VR condition. All partici-pants were paid $15/hr for their participation and gave written informed consent before participation.
Data Processing and Analysis Behavioral Data
RT has been a well-studied measure of attention, because it can measure the cognitive processing speed when par-ticipants respond to a target stimulus (Anguera, Boccanfuso, et al., 2013). As our primary behavioral mea-surement of interest, we evaluated averaged RTs between VR and 2D runs. Specifically, RTs on each run were calcu-lated as in Equation 1, as were measures of accuracy in Equation 2, and then run-level metrics were averaged for each participant and each platform for further statisti-cal analysis.
RT¼t1−t2 (1)
Accuracy¼n
N100% (2) wheret1andt2represent the timing of executing the code for the appearance of Target stimulus, and the participant pressing the button after the Target stimulus appeared on the screen, respectively;nandNrepresent the number of correctly recognized stimuli and the total number of stim-uli, respectively.
Preprocessing of Neural Data
First, all four VR runs and four 2D runs were appended into single VR and 2D data sets for each participant, re-spectively. Next, a low-pass filter with a cutoff frequency of 30 Hz and high-pass filter with a cutoff frequency of 0.5 Hz were applied to remove power line noise and DC drift, respectively. The filtered EEG signals were then corrected using the mean of each channel and decom-posed into 20 independent brain sources by independent component analysis. The prominent artifactual compo-nents, such as eye blinks, eye movements, and muscle ac-tivity, were removed by using ADJUST Version 1.1—an automatic algorithm for independent component analysis-based EEG artifact removal (Mognon, Jovicich, Bruzzone, & Buiatti, 2011). Next, the metrics shown in Table 2 were extracted respectively for further analysis. The time windows for prestimulus, stimulus-present, and ITI epochs were −1.5 to 0 sec, 0–0.6 sec, and 2– 3.5 sec, respectively. For stimulus-present epochs, we did not use a larger time window to avoid potentially in-troducing motor-related activity into the signal of interest, as average RTs > 600 msec. All epochs were cleaned of excessive peak-to-peak deflections, amplifier clippings, and other artifacts, using a voltage threshold of 100 μV.
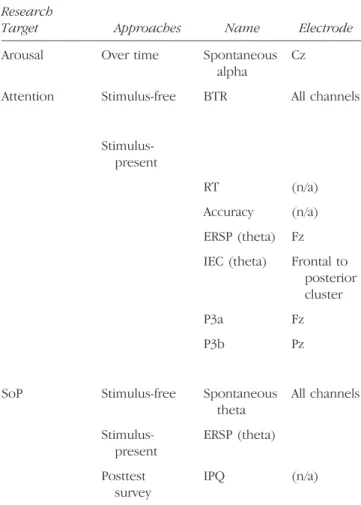
Table 2.Summary of the Metrics Used in This Study Research
Target Approaches Name Electrode
Arousal Over time Spontaneous alpha
Cz
Attention Stimulus-free BTR All channels
Stimulus-present
RT (n/a) Accuracy (n/a) ERSP (theta) Fz IEC (theta) Frontal to
posterior cluster P3a Fz P3b Pz
SoP Stimulus-free Spontaneous theta All channels Stimulus-present ERSP (theta) Posttest survey IPQ (n/a)
All EEG metrics were calculated using custom MATLAB scripts and EEGLab v14.1.2. (an open source MATLAB plugin developed by Swartz Center for Computational Neuroscience;www.sccn.ucsd.edu/eeglab). All ERPs were baseline-corrected using a−200 to 0 msec time period. To calculate event-related spectrum perturbation (ERSP), all epochs were baseline-corrected using a prestimulus time window of −1500 to 0 msec. The theta, alpha, and beta frequency bands were 4–7 Hz, 8–13 Hz, and 13–30 Hz. More details about these measures are ex-plained below.
Neural Measures of Arousal and Attention
As shown in Table 2, arousal level was evaluated over time (from Run 1 to Run 4 between platforms) using spontane-ous central alpha power. Spontanespontane-ous beta/theta ratio (BTR), RT, accuracy, event-related parietal potentials (ERPs: P3a and P3b), frontal–posterior interelectrode coherence (IEC), as well as ERSP on midline frontal theta were used together to measure attention under stimulus-free and stimulus-present periods. This battery of EEG metrics provides a better understanding on how attention differs between VR and 2D platforms, with specific mea-sures used to best assess a given construct:
• BTR for stimulus-free attention,
• P3a and ERSP for stimulus-present initial attentional processing,
• P3b for stimulus-present cognitive discrimination, and • IEC for stimulus-present functional connectivity.
With respect to SoP, all-channel spontaneous theta was used for stimulus-free analysis, whereas ERSP of all-channel theta was used under stimulus-present situations. Also, a posttest survey was used for subjective evaluation of SoP.
Arousal level. Central alpha has been shown to be an excellent indicator for assessing arousal levels among other frequency bands and brain regions (Koelstra et al., 2012). Thus, we used spontaneous alpha power at the Cz electrode as our neural measure of arousal level. Note that the alpha power is negatively associated with arousal (Koelstra et al., 2012).
Beta/theta ratio. BTR is a well-described, spontaneous EEG marker of attention, with higher BTR being associated with higher levels of attention (Lin, Chen, & Hsu, 2018; Kropotov, 2008b; Barry, Clarke, & Johnstone, 2003). The most commonly used electrode for this measure has been Cz (Lin et al., 2018; Kropotov, 2008b), but it has also been calculated by averaging across all electrode (Barry et al., 2003). Here, we utilized the grand average over all electrode approach for assessing BTR, with the theta and beta power from all 19-channel prestimulus epochs calculated using the EEGLab built-in function pop_spectopo().
P3a and P3b. For ERP analyses, we focused on the P3a and P3b components, as each has been a well-described EEG marker of the attention at frontal and posterior areas, respectively (Polich, 2007). Particularly, some evidence suggests that P3a is related to stimulus-present initial at-tentional processing if sufficient atat-tentional resources are allocated (Polich, 2007), whereas P3b is highly corre-lated with stimulus-present cognitive control, such as pressing a button or counting the number of targets (Kropotov, 2008a). These markers allowed us to interro-gate how VR and 2D environments affect one’s initial at-tentional processing and subsequent cognitive response. We adopted the commonly used Fz channel for P3a and Pz for P3b analysis (Polich, 2007). Given our focus on RT-based metrics for behavioral data, we focused on latency rather than the amplitude-based measures for these ERPs. IEC (theta). IEC is a commonly used measure of phase consistency across electrodes (Anguera, Lyman, Zanto, Bollinger, & Gazzaley, 2013). Previous evidence suggests that the enhanced, long-range, frontal–posterior IEC at theta frequency is related to improved functional connectiv-ity in a set of cognitive control tasks (Anguera, Boccanfuso, et al., 2013). Here, we created two electrodes of interest from the following electrode montages: Fp1, Fp2, F7, F3, Fz, F4, and F8 (frontal) and P3, Pz, P4, P7, P8, O1, and O2 (posterior). Using each electrodes of interest region, we calculated phase-locking values for frontal–posterior, long-range coherence (PLVIEC) as our neural metric of functional connectivity, with the attempt to assess atten-tion from the perspective of funcatten-tional connectivity. ERSP (theta). ERSP measures the average amplitude of the event-related EEG power spectrum (Makeig, 1993), which allows one to investigate stimulus-present brain dynamics. Previous evidence has shown that the frontal midline theta power is highly correlated with attentional processing (Anguera, Boccanfuso, et al., 2013). Thus, the ERSP of theta power, denoted as ERSP (theta), at the Fz electrode was used as another measure of attention, from the perspective of amplitude.
SoP Subjective and Objective Assessment
The subjective assessment of SoP is typically performed using posttest questionnaire, which can be a customized single question (Slobounov et al., 2015) or 14-item Igroup Presence Questionnaire (IPQ; Regenbrecht & Schubert, 2002). In this study, because of some redun-dant information in original IPQ, we selected three rep-resentative items from all six items for evaluating SoP (see Table 3). All participants were asked these questions immediately after all game play was finished, answering “weak/strong/no much difference” instead of rating a nine-point scale, to simply compare the subjective strength of SoP between 2D and VR. It is very important to note that our tasks did not involve avatars; thus, the
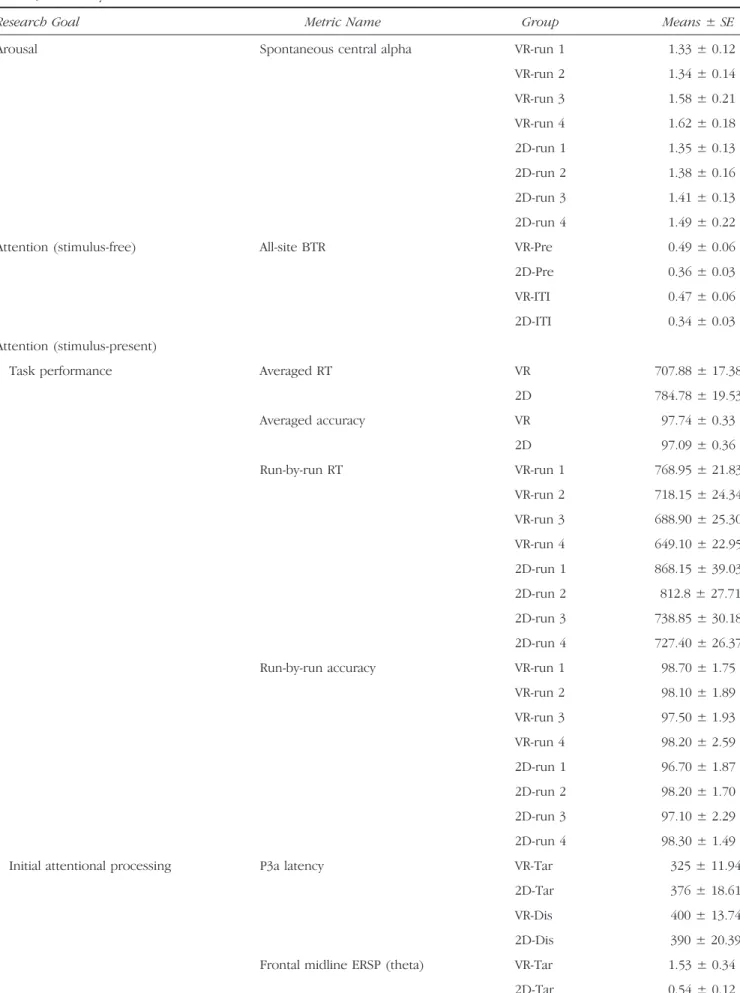
Table 3.Summary of the Behavioral and Neural Means and Standard Error
Research Goal Metric Name Group Means ± SE
Arousal Spontaneous central alpha VR-run 1 1.33 ± 0.12 VR-run 2 1.34 ± 0.14 VR-run 3 1.58 ± 0.21 VR-run 4 1.62 ± 0.18 2D-run 1 1.35 ± 0.13 2D-run 2 1.38 ± 0.16 2D-run 3 1.41 ± 0.13 2D-run 4 1.49 ± 0.22 Attention (stimulus-free) All-site BTR VR-Pre 0.49 ± 0.06 2D-Pre 0.36 ± 0.03 VR-ITI 0.47 ± 0.06 2D-ITI 0.34 ± 0.03 Attention (stimulus-present)
Task performance Averaged RT VR 707.88 ± 17.38 2D 784.78 ± 19.53 Averaged accuracy VR 97.74 ± 0.33 2D 97.09 ± 0.36 Run-by-run RT VR-run 1 768.95 ± 21.83 VR-run 2 718.15 ± 24.34 VR-run 3 688.90 ± 25.30 VR-run 4 649.10 ± 22.95 2D-run 1 868.15 ± 39.03 2D-run 2 812.8 ± 27.71 2D-run 3 738.85 ± 30.18 2D-run 4 727.40 ± 26.37 Run-by-run accuracy VR-run 1 98.70 ± 1.75
VR-run 2 98.10 ± 1.89 VR-run 3 97.50 ± 1.93 VR-run 4 98.20 ± 2.59 2D-run 1 96.70 ± 1.87 2D-run 2 98.20 ± 1.70 2D-run 3 97.10 ± 2.29 2D-run 4 98.30 ± 1.49 Initial attentional processing P3a latency VR-Tar 325 ± 11.94
2D-Tar 376 ± 18.61 VR-Dis 400 ± 13.74 2D-Dis 390 ± 20.39 Frontal midline ERSP (theta) VR-Tar 1.53 ± 0.34
term“SoP”here refers to the sense of environmental/spatial presence. With respect to an objective measure of SoP, evidence exists suggesting that frontal theta power (Baka et al., 2018; Robertson et al., 1993) or power over all chan-nels (Abromavicius et al., 2017) grows with the strength of SoP. Thus, we used spontaneous theta power to measure SoP in stimulus-free period, as well as ERSP (theta) to measure stimulus-present SoP.
Statistical Analysis
Behavioral data were analyzed using mixed two-way repeated-measures ANOVA, with Platform ( VR/2D) as a within-subject factor and Experiment Site (Experiment I: United States, Experiment II: China) as a between-subject factor, as well as standard two-way repeated-measures ANOVA, with Platform ( VR/2D) and the Order of Run (Run 1–Run 4) as within-subject factors. Neural data were analyzed using standard two-way repeated-measures ANOVA, with Platform ( VR/2D) and the Order of Run (Run 1–Run 4) as within-subject factors, or Platform ( VR/2D) and Trial Type (Target/Distractor) as within-subject factors, or Platform ( VR/2D) and Time (prestimulus/ITI) as within-subject factors. If significant interaction or a trend toward a significant interaction was found, paired t tests were used to further analyze simple main effects. That is, for example, to determine
the participants’mean difference in neural metrics be-tween platforms for each trial type or time points, as well as between time points or trial types, for each platform. All statistical analyses were done using SPSS 19.0 with a .05 alpha level. All behavioral and EEG metrics for statis-tical analyses are summarized in Table 2.
RESULTS
The means and standard error for each behavioral and neural metric are summarized in Table 3. The details of these neural data are described below, where the terms “VR-Pre”and“2D-Pre”represent“VR-Prestimulus”and “2D-Prestimulus,”respectively. “VR-Tar,” “2D-Tar,” “ VR-Dis,”and“2D-Dis”represent“VR-Target,” “VR-Distractor,” “2D-Target,”and“2D-Distractor,”respectively.
Behavioral Data
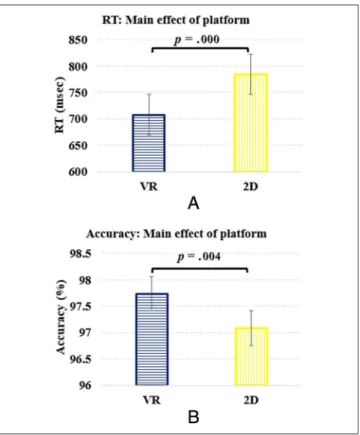
The behavioral data showed a main effect of Platform for RT, F(1, 38) = 54.74, p < .0005,η2= .590, with mean comparisons of the main effect revealing that VR RTs were significantly faster (M= 707.88 ± 17.38 msec) than the 2D (M= 784.78 ± 19.53 msec). Furthermore, the difference between the averaged RT on each platform was surprisingly consistent for the two experiments, both approximately 80 msec (793 − 716 = 77 msec for Experiment I; 775− 700 = 75 msec for Experiment II;
Table 3.(continued)
Research Goal Metric Name Group Means ± SE
VR-Dis 0.30 ± 0.67 2D-Dis 0.29 ± 0.64 Cognitive discrimination P3b latency VR-Tar 319 ± 14.02
2D-Tar 388 ± 15.58 VR-Dis 369 ± 15.05 2D-Dis 412 ± 13.87 Functional connectivity Frontal–posterior IEC (theta) VR-Tar 0.51 ± 0.02
2D-Tar 0.47 ± 0.02 VR-Dis 0.47 ± 0.02 2D-Dis 0.48 ± 0.02 SoP (stimulus-free) Spontaneous all-site theta VR-Pre 1.98 ± 0.34 2D-Pre 1.60 ± 0.09 VR-ITI 2.24 ± 0.49 2D-ITI 1.75 ± 0.11 SoP (stimulus-present) All-site ERSP (theta) VR-Tar 2.00 ± 0.13 2D-Tar 1.75 ± 0.16 VR-Dis 1.73 ± 0.21 2D-Dis 1.14 ± 0.13
Figure 7A). There was no main effect of Experimental Site (p= .63) or a Platform × Site interaction (p= .99). Of note, similar effects were found for accuracy (see Figure 7B), where a main effect of Platform was observed, F(1, 38) = 9.62,p= .004,η2= .202, supporting VR per-formance (M= 97.74 ± 0.33%) being higher than on the 2D platform (M= 97.09 ± 0.36%).
An analysis of performance over time analysis for RT revealed a significant main effect of Run, F(1, 19) = 28.73,p< .0001,η2= .60, with RT = 818.55 ± 27.73 msec for the first run versus RT = 688.25 ± 22.84 msec for the last run, and no Platform × Run interaction,F(3, 57) = 1.67, p= .18,η2= .08, indicating that the participants were getting faster over time for both VR and PC plat-forms. With respect to accuracy, the same analysis re-vealed no main effect of run,F(3, 57) = 1.59,p= .20,
η2 = .08, but a trending Platform × Run interaction, F(1, 19) = 3.86,p= .065,η2= .17. Follow-up analyses revealed that this trend was driven by a difference in ac-curacy during the first VR run (M= 98.70 ± 1.75%) versus that of the 2D condition (M= 96.70 ± 1.87%),t(19) = 4.87,p< .0001. Overall, these results suggest that there was no differential habituation to the novelty with respect to performance on each platform.
Arousal
For arousal level, we did not observe any main effects of Platform,F(1, 19) = 1.60,p= .22,η2= .08, or a Platform × Run interaction, F(3, 57) = 0.91, p = .44, η2 = .05, although there was a trending main effect of Run, F(3, 57) = 2.64,p= .06,η2= .12, pointing toward a decline in arousal over time across both platforms. These results indicate that the amount of the attentional resources was on the same level over time from the Run 1 to Run 4 be-tween VR and 2D platforms (see Figure 8).
Attention BTR
As shown in Figure 9, we found a main effect of Platform for BTR, F(1, 39) = 13.33,p = .001,η2= .26, with the
BTR for the VR platform being higher than that of the 2D platform. We also observed a main effect of Period,F(1, 39) = 4.20,p= .047,η2= .10, with the BTR during the ITI period being lower than that during the prestimulus period. There was no Platform × Period interaction (p= .84). These results indicate that, in the stimulus-free pe-riod, participants in the VR environment showed greater attention compared with 2D environment. However, for both platforms, attention decreased during the ITI stage when compared with that for prestimulus stage, indicat-ing the reduced alertness durindicat-ing the ITI stage. Note that these effects were also present if examining the BTR
Figure 9.The main effect of Platform and time, in attention, under stimulus-free periods.
Figure 8.The main effect of Platform and time, in attention, under stimulus-free periods.
more specifically at frontal (Fz electrode;p = .003) or central areas (Cz electrode;p= .01).
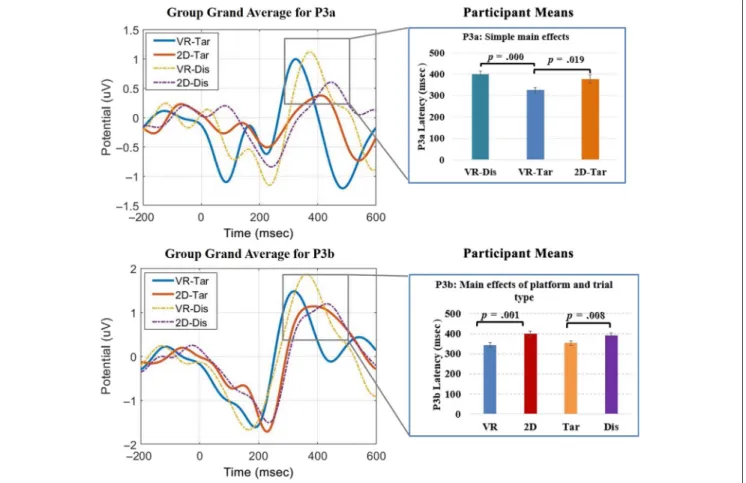
P3a and P3b. For P3a latency, we observed a trend to-ward a Platform × Trial Type interaction,F(1, 19) = 4.18, p= .055,η2= .18, as well as a significant main effect of Trial Type,F(1, 19) = 5.83,p= .03,η2= .24, but no main effect of Platform, F(1, 19) = 2.68, p= .12, η2 = .12. Follow-up analysis showed that target latencies were sig-nificantly less than that of distractor trial types when par-ticipants were in the VR platform, t(19) = −4.55, p < .0001 (see Figure 10). Similarly, VR latencies were signif-icantly less than that of the 2D platform for target stimuli, t(19) = −2.57, p= .02; however, there were no differ-ences between trial types when the 2D platform was used,t(19) =−0.45,p= .66, or between platforms for distractor trial types,t(19) = 0.56,p= .59. These results indicate that the initial ability to allocate attentional re-sources to the target stimulus was indeed better in the VR platform. We did not find any significant main effect of Platform (p= .80) or Trial Type (p= .42), or interac-tion (p= .34) for peak amplitude.
With respect to P3b, similar to the P3a findings, there was no significant main effect of Platform (p= .48), Trial
Type (p= .29), or interaction (p= .10) for peak ampli-tude. However, we did observe a significant main effect of Platform,F(1, 19) = 17.00,p= .001,η2= .47, as well as a main effect of Trial Type,F(1, 19) = 8.68,p= .008,
η2 = .31, for latency. Mean comparisons of the main effects revealed that the latencies in the VR platform were less than those generated in the 2D platform, as well as the latencies in the target trial types were less than those in the distractor trial types. There was no dif-ference in interaction,F(1, 19) = 1.11,p= .31,η2= .06. These results suggest that participants in the VR platform engaged attention-based processes faster than those in the 2D environment, with this particular advantage of VR not being trial type–specific.
ERSP (theta) at Fz. ERSP (theta) at Fz showed a signif-icant interaction,F(1, 19) = 3.93, p= .04, η2= .21, as well as a trend toward a main effect of Platform, F(1, 19) = 4.06, p = .06, η2 = .18, but no main effect of Trial Type (p = .55). Follow-up analysis showed that the theta power in the VR platform was significantly higher than that in the 2D platform when participants were responding to a target stimulus,t(19) = 2.18,p= .04 (see Figure 11), with a trial type difference present
Figure 10.The group grand average of ERPs at Fz (P3a) and Pz (P3b), across all participants (plots), and the participant means for simple main effects (bar charts).
during the use of the VR platform,t(19) = 4.48,p< .0001. However, there were no differences between trial types when the 2D platform was used,t(19) = −0.86, p = .40, nor were differences observed between platforms for distractor trial types,t(19) =−0.94, p= .36. These results are consistent with our findings on P3a, indicating that frontal activity when using the VR platform was in-deed heightened when responding to the target stimulus, both from the perspective of latency (P3a) and spectral power (ERSP).
IEC (frontal–posterior theta). For IEC, we did not find any significant main effects of Platform,F(1, 19) = 1.89, p = .19, η2 = .09, or Trial Type, F(1, 19) = 1.67, p = .21,η2= .08; however, we did observe a trend toward an interaction,F(1, 19) = 4.17,p= .055, η2= .18. This interaction trend was driven by IEC during the VR-Target conditions, being significantly higher than the 2D-Target conditions, t(19) = 3.57, p = .002 (see Figure 12), as well as the VR-Target conditions being sig-nificantly higher than the VR-Distractor conditions,t(19) = 2.19,p= .04. There were no differences between trial types when the 2D platform was used, t(19) = −0.64, p= .53, or between platforms when distractor trial types
appeared,t(19) =−0.32,p= .76. These results suggest that the participants’ functional connectivity between the frontal and posterior regions in VR platform was stronger than that in the 2D platform when they were target trials.
SoP
Stimulus-Free SoP Analyses
Spontaneous theta power across all electrodes during the stimulus-free period did not show a statistically signifi-cant main effect of platform, F(1, 39) = 1.10,p = .30, Figure 11.ERSP (theta) at Fz results. (A) The bar charts show the
simple main effects. (B) An example of the topographic map of ERSP (theta) activities under VR-Target, 2D-Target, VR-Distractor, and 2D-Distractor conditions.
Figure 13.Analysis results for (A) stimulus-free SoP and (B) stimulus-present SoP.
η2 = .03, or a Platform × Time interaction,
F(1, 39) = 0.39,p= .54,η2= .01. However, there was a significant main effect of Time,F(1, 39) = 6.76,p= .01,η2= .15, with the averaged all-channel theta power in ITI condi-tions being higher than the prestimulus condicondi-tions (see Figure 13A). These results indicate that participants expe-rienced a stronger SoP during the ITI stage compared with the prestimulus stage; however, there was no differ-ence in SoP during the stimulus-free period between VR and 2D platforms.
Stimulus-present SoP Analyses
ERSP theta power across all electrodes during the stimulus-present period did show a significant main ef-fect of Platform, F(1, 19) = 13.23, p = .002,η2= .41, such that the ERSP (theta) power in the VR platform was higher than that in the 2D platform. Furthermore, we found a main effect of Trial Type,F(1, 19) = 11.17,p= .003,η2= .37, with target trials demonstrating greater theta power than distractor trial types. There was no Platform × Trial Type interaction,F(1, 19) = 2.38,p= .14,η2= .11. In conjunction with the findings described in the Stimulus-free SoP Analyses section together, these results suggest that the advantage of SoP in VR platform was during the stimulus-present period (see Figure 13B).
Note that before finally selecting the averaged theta from all channels (F(1, 39) = 1.82, p = .19,η2= .04 for prestimulus; F(1, 19) = 13.23, p = .002, η2= .41 for stimulus-present; andF(1, 39) = 0.97,p= .33,η2=
.02 for ITI stages), theta at channel Fz was compared (F(1, 39) = 0.40,p= .53,η2= .01 for prestimulus;F(1, 19) = 4.06,p= .06,η2= .18 for stimulus-present; andF(1, 39) = 0.29,p= .59,η2= .01 for ITI stages).
Posttest Survey
The SoP metrics are presented in Table 4. As expected, all participants in HMD-VR conditions experienced a stronger SoP.
DISCUSSION
VR-induced Enhanced Attentional Performance The present findings reveal that selective attention perfor-mance during a single-visit experiment is enhanced in young adults when using an HMD-VR platform, as op-posed to a traditional 2D computer monitor, as evidenced via both behavioral and neural metrics. The 80-msec dif-ference during VR-associated RT performance was espe-cially intriguing given that a previous 2D intervention study targeting spatial selective attention only realized a 50-msec improvement over time (Rolle et al., 2017), highlighting the potential of HMD-VR as both an assess-ment and potential intervention. With respect to the neu-ral findings, each of the EEG measures has been used to assess attention-related processes, and the fact that they converge on a similar result provides supporting evi-dence for the proposed interpretations. Indeed, being able to distinguish between trial types differentially by platform further suggests that HMD-VR platforms may in-deed possess greater test sensitivity than traditional 2D approaches. One potential explanation for VR-induced enhanced attention is that HMD-VR enhanced the visuo-spatial sensory inputs and were accompanied by height-ened corticothalamic connectivity (CTC; Sherman, 2016). The present findings would agree with this interpreta-tion, as evidenced by the observed enhanced neural ac-tivity during HMD-VR use. Such enhanced CTC has been suggested to be a function of faster thalamic relay/input for corresponding cortical neurons, resulting in faster cortical spike timing (Chariker, Shapley, & Young, 2016), as evidenced by the faster P3 latency. This agrees with previous work, suggesting CTC is directly involved with the generation of the P3 ERP (Kropotov, 2008a). A related, secondary potential mechanistic interpretation would be that the thalamus is engaged to regulate inter-cortical connectivity between (and within) frontal and posterior regions of the brain. Previous work has revealed the thalamus acting in such a fashion (Nakajima & Halassa, 2017), which is consistent with our observation that long-range frontal–posterior coherence (IEC) in HMD-VR conditions is enhanced in the HMD-VR platform. Together, we believe that the heightened HMD-VR-related selective attention effects may have been achieved by stronger CTC and thalamic regulation of intercortical
Table 4.Subjective Measures of SoP
Question Condition No. of Participants 2D HMD-VR
SoP Q1 Did you have a sense of“being there”?
Weak Strong 40/40
Q2 Did you feel that the virtual world surrounded you? Weak Strong
Q3 Did you have a sense of acting in the virtual space, rather than operating something from outside? Weak Strong
connectivity. Future multimodal neuroimaging-based studies are warranted to investigate such reasoning.
Arousal and SoP in VR versus 2D
Although immersion has been shown to affect arousal ( Visch, Tan, & Molenaar, 2010), here we did not observe any significant difference in arousal level between VR and 2D platforms using the neural measure of central alpha. This suggests that the amount of attentional resources engaged did not differ between the two platforms. One possible explanation for this result is that the present par-adigm is an emotionally neutral task, unlike other studies that used immersion-based approaches to elicit emotional reactions (Estupiñán, Rebelo, Noriega, Ferreira, & Duarte, 2014). A recent review on this topic indeed suggests that the emotionally enhancing effect of immersion might be limited to arousing emotions, such as fear and anxiety (Diemer, Alpers, Peperkorn, Shiban, & Mühlberger, 2015), without such effects on attention-based assess-ments. However, there were platform differences ob-served with respect to attention and SoP both being enhanced in HMD-VR when compared with 2D condi-tions in a stimulus-present context, unlike during stimulus-free periods. These findings indicate that during stimulus-free periods, HMD-VR-induced attention level remains under a certain threshold required for fully experiencing a SoP, an interpretation suggested by Singer and colleagues ( Witmer & Singer, 1998). This re-sult has important implications for assessment-based met-rics: task-based measures that involve event-related measures of neural activity on a trial-by-trial basis show a differential increase in SoP as compared with tonic, state-based assessments as those probed during an assess-ment of resting-state activity. However, this SoP threshold and the associated benefits with experiencing a specific level of SoP is likely a relative concept. More specifically, it appears that the amount of SoP may operate in an inverted-U pattern as described by the Yerkes–Dodson law ( Yerkes & Dodson, 1908): The present findings show that SoP increases as attention goes up from 2D to HMD-VR platforms in a stimulus-present context, but SoP de-creases as attention goes up, from the stimulus-free ITI to prestimulus stage. Thus, much like the relationship be-tween arousal and performance, such that performance increases as arousal goes up, performance begins to de-cline after reaching (and then exceeding) an optimal level of SoP.
Limitations of the Present Work
Although the present findings provide evidence demon-strating that an HMD-VR platform enhances attention abil-ity, the nature of the experiment does not provide a mechanistic understanding as to why this effect is present. Although this study was conducted in healthy adults, related work has demonstrated that populations with physical
and intellectual disabilities can benefit from other forms of IVR in capturing and maintaining attention (Mineo, Ziegler, Gill, & Salkin, 2008; Weiss, Bialik, & Kizony, 2003). Of course, it is still unknown if ubiquitous HMD-VR technologies will someday translate benefits to di-verse populations with either cognitive or physical dis-abilities. Indeed, it seems possible that there may be situations where an individual with dysfunctional atten-tion would benefit from testing environments that are less visually stimulating. Future research is needed to ex-plore how well HMD-VR approaches are tolerated by dif-ferent populations. The task used here, in conjunction with the type of neural measures recorded, cannot speak to the possibility of realizing similar effects using different paradigms, engaging different neural circuits, or even in different populations. Similarly, although we observed a strong pattern of consistency across different neural mea-sures, evidencing enhanced neural signatures of attention with the HMD-VR, the measures explored are not exhaus-tive, and other measures may not show the same effects. In any case, these results encourage the pursuit of innova-tive platforms for cogniinnova-tive assessment research that allow for more immersive task engagement and may conse-quently offer the most powerful means to assess one’s cognitive control abilities. Indeed, our previous work has demonstrated that consumer electronics platforms (iPad and Xbox Kinect) could be especially useful in building more interactive, and therefore effective, cognitive assess-ments and interventions (Rolle, Voytek, & Gazzaley, 2015).
Significance and Conclusions
The present findings demonstrate (1) attention and SoP are both enhanced in HMD-VR environments under stimulus-present periods and (2) attention-based abili-ties in HMD-VR environments are indeed enhanced, with this enhancement being distinct from heightened arousal. Given that previous work has shown the feasibil-ity of using 2D-based attention assessments and interven-tions for different clinical populainterven-tions including sensory processing dysfunction (Anguera et al., 2017), attention-deficit/ hyperactivity disorder (Tucha et al., 2011), and mild impaired cognition (Li et al., 2011), the results of this exploratory study provide the first rigorous set of behav-ioral and neural evidence to encourage the transforma-tion from 2D to consumer-friendly HMD-VR-based approaches. This is especially important given that we have demonstrated the utility of using more engaging technology to better assess attention in populations with known, inherently high-performance variability (Anguera et al., 2016). These abilities are often assessed using par-adigms deployed on either desktop or laptop computers that regularly demonstrate low test sensitivity, especially in children (Strauss, Sherman, & Spreen, 2006; Wolf, 2000; Walkley, 1992). Low test sensitivity is especially present when characterizing clinical populations, as in-creased performance variability in these groups often
surpasses the range of testing sensitivity, often obscuring true cognitive deficits (Strauss et al., 2006; Wolf, 2000; Walkley, 1992). For example, we have previously demon-strated greater engagement through the use of a more enjoyable 2D paradigm provided greater sensitivity in re-vealing group differences where less engaging tests did not (Anguera et al., 2016). In the present work (through the SoP survey), participants mentioned that they could see the physical world during the 2D condition (such as the monitor itself ), whereas with HMD-VR, the physical world was occluded completely. Thus, HMD-VR has two inherent advantages with respect to enhancing one’s neural state that each deal with unique sources of irrele-vant information: the ability to effectively limit influences of external distraction on attention and the ability to heighten engagement internally to remediate internal distraction (Ziegler, Janowich, & Gazzaley, 2018). Thus, we surmise that the use of a VR HMD may indeed follow a similar or even better pattern of results whereby greater sensitivity is revealed as compared with more traditional 2D approaches, highlighting the potential implications of current study for clinical research in the future. This is especially pertinent given that a total of 14.35 million HMD-VR units were sold in 2017–2019 worldwide (Statista, 2020) and the burgeoning all-in-one HMD-VR platforms becoming available (e.g., Oculus Quest), highlighting the oncoming wave of such accessible tech-nology for researchers and clinicians to utilize these tools in ways never before attempted. Thus, the benefits of the present findings coupled with these technological devel-opments may facilitate extending such resources to larger numbers and more diverse populations.
Acknowledgments
This work was partially supported by Shanghai Sailing Program under grant 17YF1426900. A special thanks to Roger Anguera for his help in the game design for this study.
Reprint requests should be sent to Adam Gazzaley, Neuroscape, Sandler Neurosciences Center, Room 502, 675 Nelson Rising Lane, San Francisco, CA 94158, or via e-mail: adam.gazzaley@ ucsf.edu.
REFERENCES
Abromavicius, V., Gedminas, A., & Serackis, A. (2017). Detecting sense of presence changes in EEG spectrum during perception of immersive audiovisual content. In Proceedings of International Conference on Electrical, Electronic and Information Sciences (EStream)(pp. 1–4). Vilnius, Lithuania: IEEE.
Anguera, J. A., Boccanfuso, J., Rintoul, J. L., Al-Hashimi, O., Faraji, F., Janowich, J., et al. (2013). Video game training enhances cognitive control in older adults.Nature,501, 97–101. Anguera, J. A., Brandes-Aitken, A. N., Rolle, C. E., Skinner, S. N.,
Desai, S. S., Bower, J. D., et al. (2016). Characterizing cognitive control abilities in children with 16p11.2 deletion using adaptive‘video game’technology: A pilot study. Translational Psychiatry,6, e893.
Anguera, J. A., Brandes-Aitken, A. N., Antovich, A. D., Rolle, C. E., Desai, S. S., & Marco, E. J. (2017). A pilot study to determine the feasibility of enhancing cognitive abilities in children with sensory processing dysfunction.PLoS One,12, e0172616.
Anguera, J. A., Lyman, K., Zanto, T. P., Bollinger, J., & Gazzaley, A. (2013). Reconciling the influence of task-set switching and motor inhibition processes on stop signal after-effects. Frontiers in Psychology,4, 649.
Bailey, J. O., & Bailenson, J. N. (2017). Chapter 9: Immersive virtual reality and the developing child. In F. C. Blumberg & P. J. Brooks (Ed.)Cognitive development in digital contexts (1st ed., pp. 181–200). San Diego, CA: Academic Press. Baka, E., Stavroulia, K. E., Magnenat-Thalmann, N., & Lanitis, A.
(2018). An EEG-based evaluation for comparing the sense of presence between virtual and physical environments. Paper presented at the2018 Computer Graphics International 2018 (CGI 2018)(pp. 107–116). Bintan Island, Indonesia: ACM Digital Library.
Barry, R. J., Clarke, A. R., & Johnstone, S. J. (2003). A review of electrophysiology in attention-deficit/ hyperactivity disorder: I. Qualitative and quantitative electroencephalography. Clinical Neurophysiology,114, 171–183.
Berger, A. M., & Davelaar, E. J. (2018). Frontal alpha oscillations and attentional control: A virtual reality neurofeedback study. Neuroscience,378, 189–197.
Buxbaum, L. J., Palermo, M. A., Mastrogiovanni, D., Read, M. S., Rosenberg-Pitonyak, E., Rizzo, A. A., et al. (2008). Assessment of spatial attention and neglect with a virtual wheelchair navigation task.Journal of Clinical and Experimental Neuropsychology,30, 650–660.
Chariker, L., Shapley, R., & Young, L. S. (2016). Orientation selectivity from very sparse LGN inputs in a comprehensive model of macaque V1 cortex.Journal of Neuroscience,36, 12368–12384.
Cho, B. H., Lee, J. M., Ku, J. H., Jang, D. P., Kim, J. S., Kim, I. Y., et al. (2002). Attention Enhancement System using virtual reality and EEG biofeedback. Paper presented at the 2002 IEEE Virtual Reality (VR’02)(pp. 1–8). Orlando, FL: IEEE. Coull, J. T. (1998). Neural correlates of attention and arousal: Insights from electrophysiology, functional neuroimaging and psychopharmacology.Progress in Neurobiology,55, 343–361.
Cummings, J. J., & Bailenson, J. N. (2015). How immersive is enough? A meta-analysis of the effect of immersive technology on user presence.Media Psychology,19, 272–309.
Diemer, J., Alpers, G. W., Peperkorn, H. M., Shiban, Y., & Mühlberger, A. (2015). The impact of perception and presence on emotional reactions: A review of research in virtual reality.Frontiers in Psychology,6, 26.
Eriksen, B. A., & Eriksen, C. W. (1974). Effects of noise letters upon the identification of a target letter in a nonsearch task. Perception & Psychophysics,16, 143–149.
Estupiñán, S., Rebelo, F., Noriega, P., Ferreira, C., & Duarte, E. (2014). Can virtual reality increase emotional responses (arousal and valence)? A pilot study. Paper presented at the 2014 International Conference of Design, User Experience, and Usability (DUXU 2014)(pp. 541–549). Las Vegas, NV: Springer.
Ewalt, D. M. (2016). Oculus rift review: The beginning of the age of VR. Retrieved fromhttps://www.forbes.com/sites/ davidewalt/2016/03/28/oculus-rift-review-the-beginning-of-the-age-of-vr/#62806e1d5aff.
Fan, J., McCandliss, B. D., Sommer, T., Raz, A., & Posner, M. I. (2002). Testing the efficiency and independence of
attentional networks.Journal of Cognitive Neuroscience,14, 340–347.
Fordell, H. (2017).Virtual reality for enriched rehabilitation of stroke patients with spatial neglect(Thesis). Umeå
University, Umeå, Sweden. Retrieved fromwww.diva-portal. org/smash/record.jsf?pid=diva2%3A1157294&dswid=-2794. Gazzaley, A., & Rosen, L. D. (2016).The distracted mind:
Ancient brains in a high-tech world(1st ed.). Cambridge, MA: MIT Press.
Heeter, C. (1992). Being there: The subjective experience of presence.Presence: Teleoperators and Virtual
Environments,1, 262–271.
Jerald, J. J. (2010). Scene-motion- and latency-perception thresholds for head-mounted displays (Thesis). University of North Carolina at Chapel Hill. Retrieved fromhttps://pdfs. semanticscholar.org/1b64/
4571a98cc434edcae672f30cbfbba46f63e7.pdf.
Kober, S. E., Kurzmann, J., & Neuper, C. (2012). Cortical correlate of spatial presence in 2D and 3D interactive virtual reality: An EEG study.International Journal of
Psychophysiology,83, 365–374.
Koelstra, S., Muhl, C., Soleymani, M., Lee, J.-S., Yazdani, A., Ebrahimi, T., et al. (2012). DEAP: A database for emotion analysis; Using physiological signals.IEEE Transactions on Affective Computing,3, 18–31.
Kropotov, J. D. (2008a). A P3b component as index of engagement operation. InQuantitative EEG, event-related potentials and neurotherapy(1st ed., pp. 399–410). Cambridge, MA: Academic Press.
Kropotov, J. D. (2008b). Theta beta ratio as inattention index. In Quantitative EEG, event-related potentials and neurotherapy (1st ed., pp. 399–400). Cambridge, MA: Academic Press. LaValle, S. M., Yershova, A., Katsev, M., & Antonov, M. (2014).
Head tracking for the oculus rift. Paper presented at the 2014 IEEE International Conference on Robotics and Automation (ICRA 2014)(pp. 187–194). Hong Kong, China: IEEE. Leark, R. A., Greenberg, L. M., Kindschi, C. L., Dupuy, T. R., &
Hughes, S. J. (2018).Professional manual of test of variables of attention (9.0-121-g7413481). Retrieved fromhttps://files. tovatest.com/documentation/9/ Professional%20Manual.pdf. Li, H., Li, J., Li, N., Li, B., Wang, P., & Zhou, T. (2011). Cognitive
intervention for persons with mild cognitive impairment: A meta-analysis.Ageing Research Reviews,10, 285–296. Lin, B.-S., Chen, J.-L., & Hsu, H.-C. (2018). Novel upper-limb
rehabilitation system based on attention technology for post-stroke patients: A preliminary study.IEEE Access,6, 2720–2731.
Makeig, S. (1993). Auditory event-related dynamics of the EEG spectrum and effects of exposure to tones.
Electroencephalography and Clinical Neurophysiology,86, 283–293.
Markowitz, D. M., Laha, R., Perone, B. P., Pea, R. D., & Bailenson, J. N. (2018). Immersive virtual reality field trips facilitate learning about climate change.Frontiers in Psychology,9, 2364.
Mineo, B. A., Ziegler, W., Gill, S., & Salkin, D. (2008). Engagement with electronic screen media among students with autism spectrum disorders.Journal of Autism and Developmental Disorders,39, 172–187.
Mognon, A., Jovicich, J., Bruzzone, L., & Buiatti, M. (2011). ADJUST: An automatic EEG artifact detector based on the joint use of spatial and temporal features.Psychophysiology,48, 229–240. Nakajima, M., & Halassa, M. M. (2017). Thalamic control of
functional cortical connectivity.Current Opinion in Neurobiology,44, 127–131.
Pausch, R., Proffitt, D., & Williams, G. (1997). Quantifying immersion in virtual reality. Paper presented at the 24th annual conference on Computer graphics and interactive techniques (SIGGRAPH’97). (pp. 187–194). Los Angeles, CA: ACM Digital Library.
Polich, J. (2007). Updating P300: An integrative theory of P3a and P3b.Clinical Neurophysiology,118, 2128–2148. Posner, M. I. (1980). Orienting of attention.Quarterly Journal
of Experimental Psychology,32, 3–25.
Posner, M. I., Snyder, C. R., & Davidson, B. J. (1980). Attention and the detection of signals.Journal of Experimental Psychology,109, 160–174.
Regenbrecht, H., & Schubert, T. (2002). Real and illusory interactions enhance presence in virtual environments. Presence: Teleoperators and Virtual Environments,11, 425–434.
Robertson, G. G., Card, S. K., & Mackinlay, J. D. (1993). Three views of virtual reality: Nonimmersive virtual reality. Computer,26, 81.
Rolle, C. E., Anguera, J. A., Skinner, S. N., Voytek, B., & Gazzaley, A. (2017). Enhancing spatial attention and working memory in younger and older adults.Journal of Cognitive Neuroscience,29, 1483–1497.
Rolle, C. E., Voytek, B., & Gazzaley, A. (2015). Exploring the potential of the iPad and Xbox kinect for cognitive science research.Games for Health Journal,4, 221–224.
Sherman, S. M. (2016). Thalamus plays a central role in ongoing cortical functioning.Nature Neuroscience,19, 533–541. Slater, M., & Wilbur, S. (1997). A framework for immersive virtual environments (FIVE): Speculations on the role of presence in virtual environments.Presence: Teleoperators and Virtual Environments,6, 603–616.
Slobounov, S. M., Ray, W., Johnson, B., Slobounov, E., & Newell, K. M. (2015). Modulation of cortical activity in 2D versus 3D virtual reality environments: An EEG study.International Journal of Psychophysiology,95, 254–260.
Strauss, E., Sherman, E., & Spreen, O. (2006).Compendium of neuropsychological tests: Administration, norms, and commentary(3rd ed.). Oxford, United Kingdom: Oxford Univeristy Press.
Tucha, O., Tucha, L., Kaumann, G., König, S., Lange, K. M., Stasik, D., et al. (2011). Training of attention functions in children with attention deficit hyperactivity disorder. Attention Deficit and Hyperactivity Disorders,3, 271–283. Visch, V. T., Tan, E. S., & Molenaar, D. (2010). The emotional
and cognitive effect of immersion in film viewing.Cognition and Emotion,24, 1439–1445.
Statista (2020). VR device shipments by vendor worldwide 2017–2019. February 19. Retrieved fromhttps://www.statista. com/statistics/671403/global-virtual-reality-device-shipments-by-vendor/.
Walkley, R. (1992). A compendium of neuropsychological tests— Administration, norms and commentary.Australian
Psychologist,27, 205.
Weiss, P. L., Bialik, P., & Kizony, R. (2003). Virtual reality provides leisure time opportunities for young adults with physical and intellectual disabilities.CyberPsychology & Behavior,6, 335–342.
Whyte, J. (1992). Attention and arousal: Basic science aspects. Archives of Physical Medicine and Rehabilitation,73, 940–949.
Witmer, B. G., & Singer, M. J. (1998). Measuring presence in virtual environments: A presence questionnaire.Presence: Teleoperators and Virtual Environments,7, 225–240. Wolf, S. (2000). A compendium of neuropsychological
tests: Administration, norms, and commentary.Integrative Psychological and Behavioral Science,35, 70–71.
Yerkes, R. M., & Dodson, J. D. (1908). The relation of strength of stimulus to rapidity of habit-formation.Journal of Comparative Neurology and Psychology,18, 459–482. Ziegler, D. A., Janowich, J. R., & Gazzaley, A. (2018). Differential
impact of interference on internally- and externally-directed attention.Scientific Reports,8, 2498.