Evaluation of the Efficiency of Agricultural Holdings in View of
Structural Changes in Estonia
Eduard Matveev
Department of farm economic analysis, Jäneda Training and Advisory Centre (JTAC),
Estonia
Paper prepared for presentation at the 94
thEAAE Seminar
‘From households to firms with independent legal status: the spectrum of
institutional units in the development of European agriculture ’,
Ashford (UK), 9-10 April 2005
Evaluation of the efficiency of agricultural holdings in view of structural changes in Estonia
Eduard Matveev1
Abstract
This presentation provides comparative analysis of agricultural holdings in Estonia based on the Farm Accountancy Data Network (FADN) data. The FADN data for reference years 2000, 2001, 2002 and 2003 have been analysed. The FADN data analyses showed, that there are very big differences in the structure of the agricultural holdings. Individual farms represent ca 92% of the total population of agricultural producers but at the same time their part in total production attains less than 50% according to the FADN data for year 2003.
Keywords: comparative analysis, economic efficiency, Estonia, farm income, land
INTRODUCTION
Agriculture has traditionally been an important sector of national economy and a source of income for the Estonian population. Estonian agricultural policy changed sharply after regaining the independence in the beginning of nineties: from highly subsidised agricultural production to practically unsubsidised production with a free price formation. Estonia opened its markets and applied an extremely liberalised trade policy.
Estonia regained independence in 1991 and transition of the economy from a central planning to a market economy resulted in significant changes in the agricultural sector. In Estonia, reorganization began before Estonia regained independence with farm low in 1989 and reorganisation continued by land and ownership laws of 1991 and 1992 that restored private ownership by returning of land to former owners. These reforms led to the liquidation of collective and state farms as well as to development of small-scale farms i.e. family farms. In the course of reforms the number of family farms has increased considerably from 10 000 in 1994 to 36 076 in 2003, whereas the number of companies has decline.
A direct effect of this liberal agricultural policy is the extremely low profitability of the sector. The total agricultural production decreased by a half. Due to structural changes in agricultural holdings and their adaptation to new market-oriented economy, more then 40% of agricultural land and more than 50% of sown area of fields crops was abandoned.
As a result of transition from planed to market economy, land reform, privatisation of land, re-establishment of farms the structure of agricultural holdings in Estonia has considerably changed. The purpose of the paper is to assess the efficiency of agricultural holdings in view of structural changes in Estonia during the last four years i.e. from 2000 to 2003. Secondly, to compare the current economic situation of the private farms (own by natural person) and the companies e.g. a general partnership, limited partnership, private limited company, public limited company or commercial association, (own by legal person), as well as to analyse the changes in land ownership structure.
The FADN data analyses showed, that only 14% of the utilized agricultural area used by companies is in their ownership, while about 54% of the utilized agricultural area used by private farms is owned by them. In the case of about 22% of agricultural holdings all utilized agricultural was owned by its holder and they had at their disposal about 8% of the total utilized agricultural area. According to the agricultural area utilized for farming the average size of a company was on an average 6.2 times larger than that of private farm in 2003 (389,7 ha and 63,3 ha respectively).
1. METHODOLOGY AND DATA SOURCES APPLIED
The study has been carried out using Estonian FADN database for years 2000 to 2003. FADN data have been collected since 1998, whereas the number of sample agricultural holdings has increase from year to year. From the year 2000 the number of sample holdings in the sample plan has been 500. Some sample holdings have been excluded from the database after checking due to various reasons: capacity of production is too small and did not meet the minimum economic size; agricultural production contributed to less then half of the total turnover of the holding etc.
from the sample holdings is carried out according to the sampling plan. The sampling plan is drawn up according to the structure of the population of agricultural holdings ensuring the representativeness of the holdings by selecting all types of farming and economic size classes.
According to the FADN methodology of data analysis of agricultural holdings are calculated as weighted average, which enable the results to be generalized in terms of the population of agricultural producers. The weighted coefficients have been calculated by different type of farming as well as economic size classes.
According to the objective of the FADN the database of sample agricultural holdings covers only commercial farms defined as farms, which are large enough to provide a main activity for the farmer as well as provide the main occupation of at least one worker. It should be noted, that since 1998 the minimum economic size set for the selection of sample agricultural holdings in Estonia is two European Size Units (ESU).
For the analysis the data of all sample agricultural holdings were taken into evaluation and classified by type of ownership as follows: private farms i.e. natural persons and companies i.e. legal persons. Further, the FADN database for year 2003 has been divided into four economic size classes according to the ESUs.
2. RESULTS OBTAINED
In 2003 the population of agricultural holdings consisted of 7970 agricultural producers, of which 500 were included in the FADN sample. In 2003, according to the type of ownership sample agricultural holdings included 410 natural i.e. self-employed persons and 90 companies, of which 74 private limited companies, 8 public limited companies, 6 profit-oriented cooperatives, 1 limited partnership and 1 non-governmental organisation. Each sample agricultural holding represented an average of 15,94 holdings of the population of agricultural holdings.
The general structure differs between the private farms and companies in a great extent. In 2003 the average economic size of the private farm was 7,1 ESU, that is more then 7 times smaller comparing to the companies (table 1). According to the labour input used an average of 13,8 annual work units (AWU) were used in an agricultural company, whereas 1 annual work unit is fixed at 2200 working hours. The structure of labour force is different greatly in terms of the type of ownership, whereas the share of paid labour in total labour input accounted for 97,1% in the companies against 13% in private farms. The companies utilized 389,7 ha of agricultural area on average, whereas 85,8% of the land was rented (63,3 ha and 46,1% respectively in private farm).
The companies had 216,3 livestock units on average in 2003, which is significantly lesser if compared to year 2000. Milk yield has increased over the years and accounted for 5355 kg per cow on average in the companies and slightly more in private farms 5381 kg per cow in 2003. The yield of wheat was 1916 kg/ha and 1989 kg/ha in companies and private farms, respectively.
Comparison of the investment capacity per hectare of utilized agricultural area in 2003 indicated that the biggest gross investments were made in private farms, 139,25 EUR/ha. Comparison with previous years showed an increase in the investment capacity expressed per hectare. It is noteworthy that the amount of subsidies on investment had increased significantly when compared to the year 2000 in both cases.
Table 1. Main characteristics of analysed agricultural holdings, 2000-2003 (average per holding)
natural legal natural legal natural legal natural legal
Farms represented 4 416 503 7 690 609 7 598 701 7 310 660
Sample farms 387 73 416 73 407 82 410 90
Economic size, ESU 6,7 104,4 6,5 88,7 6,7 76,9 7,1 74,1
Total labor input, AWU 2,1 23,4 2,1 18,4 2,1 16,7 2,0 13,8
… of which paid labour, % 18,3 98,7 21,5 97,4 14,8 98,0 13,0 97,1
Agricultural land used, ha 64,7 682,5 55,3 483,2 59,4 408,3 63,3 389,7
…of which rented land, % 55,6 93,6 50,8 92,0 48,6 89,8 46,1 85,8
Total livestock units, LU 14,6 329,6 13,6 316,3 15,1 257,9 14,2 216,3
…of which dairy cows, % 53,6 52,7 39,4 37,9 41,9 42,6 40,2 44,9
Milk yield, kg/cow 5 092 4 528 5 331 5 094 5 382 5 234 5 381 5 355
Yield of wheat, kg/ha 2 348 2 293 2 240 1 941 2 055 1 971 1 989 1 916
Depreciation, EUR/ha 31,65 26,24 35,24 38,32 51,47 63,31 42,74 59,33
Gross investment, EUR/ha 33,07 25,01 47,09 80,73 57,46 80,79 139,25 84,53
Subsidies on invest., EUR/ha 1,32 1,40 0,18 0,86 5,07 7,77 37,70 18,65
2000 2001 2002 2003
Source: author calculations based on FADN data
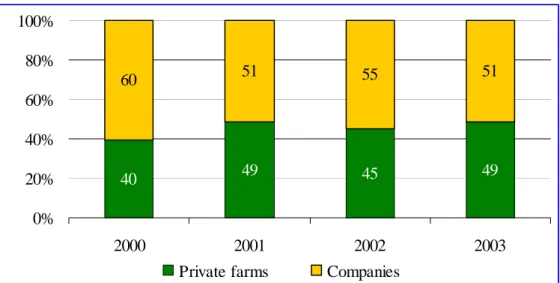
Despite of the fact that the companies’ account for only 8% of the agricultural holdings of the population, they produce more then half of total agricultural output (figure 1). Based on this, it can be concluded that the companies play a very important role in the production of the agricultural products in Estonia.
40 49 45 49 60 51 55 51 0% 20% 40% 60% 80% 100% 2000 2001 2002 2003
Private farms Companies
Figure 1. Change in the structure of total output by type of ownership, %
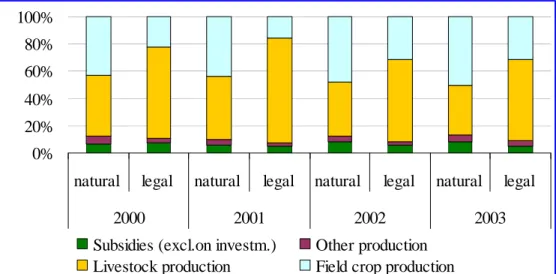
Comparison of the structure of total output of private farms and companies showed significant differences in their structure. Output of livestock contributed to the major share in total output of the companies whereas output of crops accounted for the major share in total output of the private farms (figure 2). In addition to the main agricultural activities, like keeping animals and growing crops, agricultural holdings perform other activities like forestry, farm machinery services, food processing, retail, nature management or other non-separable non-agricultural secondary activities. Hence, in 2003 the output of other activities accounted for the 5,3% and 4,2% in total output of private farms and companies, respectively. The share of subsidies (excluding on investments) in total output accounts for 8,2% in private farms and 4,6% in companies, which remains more or less the same compared to previous years.
0% 20% 40% 60% 80% 100%
natural legal natural legal natural legal natural legal
2000 2001 2002 2003
Subsidies (excl.on investm.) Other production Livestock production Field crop production
Figure 2. Change in the structure of total output by type of ownership, 2000-2003
The structure of input costs varied greatly across the holdings of different type of ownership – the share of wages paid in total inputs of the companies was 20,7% whereas the relevant share of the representatives of the private farms was only 3,8% in 2003 (figure 3). The share of overhead costs in total inputs was the higher in case of companies, at the same time, they were more successful in cutting variables costs. In private farms depreciation accounted approximately for 15,4% of total inputs in 2003, whereas in case of companies it was relatively low (9%).
0% 20% 40% 60% 80% 100%
natural legal natural legal natural legal natural legal
2000 2001 2002 2003
Variable costs Overhead costs Wages paid Depreciation Figure 3. Change in the structure of total inputs by type of ownership, 2000-2003
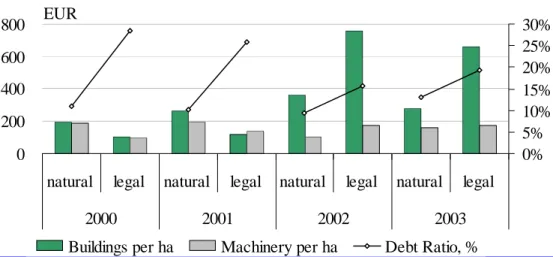
The value of fixed assets per hectare of utilized agricultural area varied to a great extent by type of ownership. (figure 4), especially in terms of the value of buildings. The value of buildings per hectare in companies are much more bigger than in private farms. Comparing the value of buildings per hectare within the various years indicates the rapid grow in 2002. This caused by the revaluation of capital assets at replacement value carried out in all sample agricultural holdings in 2003. Taking into account that depreciation can only be calculated in case the useful economic life of the asset is not over yet, therefore, maximum age of fixed assets subject to the survey was set and depreciation of fixed assets at replacement value beyond the defined age was not estimated. Depreciation was estimated only for fixed assets currently used for production.
One important indicator is the debt ratio, which indicates the percentage of total assets that is financed by debt. The analysis indicates that there are certain differences in the
level of debt between holdings of different types of ownership. The average private farm has relatively low debt level comparing to company. Thus, the total assets of the companies were financed by external capital and equity contributing to 19,0% and 81,0 of total assets in 2003, respectively. Liabilities of the private farms accounted for 13,0% of the structure of capital. Therefore, taking into account a relatively low debt level of agricultural holdings, they have good potentials to involve external capital for finance their production.
0 200 400 600 800
natural legal natural legal natural legal natural legal
2000 2001 2002 2003 0% 5% 10% 15% 20% 25% 30%
Buildings per ha Machinery per ha Debt Ratio, % EUR
Figure 4. Fixed assets per ha and total debt ratio by type of ownership, 2000-2003
Wages of paid labour vary greatly across the agricultural holdings of different type of ownership. On average the wage of paid labour was much bigger in the companies, accounted for 1,81 EUR/hour against 1,18 EUR/hour in private farms (figure 5). Over the past years wages paid to labour have increased year by year.
0,70 1,22 0,79 1,52 0,96 1,65 1,18 1,81 0,0 0,5 1,0 1,5 2,0
natural legal natural legal natural legal natural legal
2000 2001 2002 2003
EUR per hour
Figure 5. Wages paid to the paid labour by type of ownership, 2000-2003
One of the most important indicators is Net Value Added (NVA), which indicates the profitability of agricultural activities. NVA is obtained by subtracting depreciation of fixed assets from Gross Value Added. In term of producing NVA per AWU companies were more successful during the all period under the consideration.
Based on above mentioned, it can be concluded that the economical efficiency of companies is much bigger than that of the private farms. The companies produced 4386 EUR/AWU on average in 2003, which is ca 30% more when compared to private farms.
efficiently than companies, whereas companies are able to specialize and use efficiencies of production scale.
Accordingly, private farms will certainly face with increasing difficulty accessing to new technology to be competitive in the agricultural market, as well as in order to compete with large –scale companies. However, they can remain active for a number of years due in a large extent to the utilizing family labour and subsidies paid for agricultural production. It can be said, that they are utilizing family labour to increase their income.
0 1000 2000 3000 4000 5000
natural legal natural legal natural legal natural legal
2000 2001 2002 2003
NVA without subsidies NVA including subsidies EUR
Figure 6. Farm NVA per AWU without and including subsidies by type of ownership, 2000-2003 (average per holding)
The FADN data analysis showed, that there are significant differences in the structure of production across different economic size classes. The share of paid labour in total labour input increased in proportion with the increase in the size of the agricultural holdings – paid labour accounted for 99,2% and 76,9% of total labour input in companies and private farms of bigger size class, respectively. The same tendency can be observed in case of structure of land use - share of rented land of utilized agricultural area increased in proportion with increase in the size of the agricultural holdings.
It is noteworthy that approximately 79% of the private farms of the population belong to the smallest economic size class (2 to 8 ESUs), whereas only 30% of companies belong to certain class.
Table 2. Main characteristics of analysed agricultural holdings by group of farms classified by ESU, 2003 (average per holding)
natural legal natural legal natural legal natural legal
Farms represented 5 765 194 902 94 541 53 102 319
Sample farms 138 8 122 8 127 14 23 60
Economic size, ESU 3,9 3,4 11,3 12,9 23,5 26,9 59,4 142,8
Total labor input, AWU 1,8 2,3 2,1 4,4 2,8 7,4 8,5 24,6
… of which paid labour, % 4,8 65,8 16,2 94,9 27,1 93,3 76,9 99,2
Agricultural land used, ha 43,0 17,0 101,8 24,5 163,4 111,8 343,6 770,0
…of which rented land, % 35,8 83,7 53,4 47,9 56,6 91,3 72,8 86,0
Total livestock units, LU 8,6 1,9 24,0 28,2 36,2 74,3 127,7 425,5
…of which dairy cows, % 38,3 64,1 43,9 46,4 9,3 32,1 46,8
Milk yield, kg/cow 5 032 2 174 5 520 5 602 5 785 6 166 5 365
Yield of wheat, kg/ha 1 644 2 134 2 701 2 241 2 311 2 478 1 898
Wages of paid lab., EUR/hour 1,25 1,49 0,88 1,79 1,04 1,98 1,36 1,82
Depreciation, EUR/ha 36,83 70,87 40,46 359,14 50,92 64,59 69,84 56,23
Gross investment, EUR/ha 147,33 99,35 73,80 370,24 166,76 81,98 184,30 81,71
Subsidies on invest., EUR/ha 30,59 21,51 61,91 37,96 69,31 18,61
2-<8 8-<16 16-<40 40-…
Source: author calculations based on FADN data
CONCLUSIONS
The results of analysis of Estonian agricultural holdings shows, that there are very big differences in the structure of the private farms and the companies. 14% of the utilized agricultural area used by companies is in their ownership, while about 54% of the utilized agricultural area used by private farms is owned by them. According to the agricultural area utilized for farming the average size of a company was on an average 6.2 times larger than that of private farm in. This leads to the comparative advantage of large-scale companies over the small-scale private farms. The share of paid labour in total labour input accounted for 97,1% in the companies, whereas it was only 13% in case of private farms.
Approximately 79% of the private farms of the population belong to the smallest economic size class (2 to 8 ESUs), whereas only 30% of companies belong to certain economic class.
The FADN data analyses showed, that there are big differences in operational efficiency of Estonian agricultural holdings across the holdings of different type of ownership - the companies produced on average ca 30% more NVA per AWU when compared to private farms. Consequently, private farms used labour less efficiently than companies.
1
Department of farm economic analysis, Jäneda Training and Advisory Centre (JTAC), Estonia. Paper presented at the 94th EAAE Seminar “From households to firms with independent legal status: The spectrum of institutional units in the development of European agriculture”, held in Wye, April 9-10, 2005.
REFERENCES
Commercial Code. RT (State Gazette) I 1995, 26/28, 355; consolidated text RT I 1998, 91/93, 1500.
Economic characteristics of farm accountancy data network agricultural holdings in 2000. Jäneda Training and Advisory Centre. 2001-pp. 119
Economic characteristics of farm accountancy data network agricultural holdings in 2001. Jäneda Training and Advisory Centre. 2002-pp. 158
Economic characteristics of farm accountancy data network agricultural holdings in 2002. Jäneda Training and Advisory Centre. 2003-pp. 137
Economic characteristics of farm accountancy data network agricultural holdings in 2002. Jäneda Training and Advisory Centre. 2003-pp. 163
Farm accountancy data network database for year 2000. Jäneda Training and Advisory Centre. Farm accountancy data network database for year 2001. Jäneda Training and Advisory Centre. Farm accountancy data network database for year 2002. Jäneda Training and Advisory Centre. Farm accountancy data network database for year 2003. Jäneda Training and Advisory Centre. Ministry of Agriculture of Estonia. Estonian Rural Development Plan 2004-2006. Tallinn, 2004 - pp. 153
Ministry of Agriculture. 2004. Agriculture and Rural Development: overview 2003/2004. Statistical Office of Estonia. The Structure of Agricultural Holdings 2000. Tallinn, 2004 – pp. 80.