Part 614
Stream Visual Assessment
Protocol Version 2
Utah
Washington
Iowa
South Carolina
For additional information contact: Fisheries Biologist
West National Technology Support Center 1201 NE Lloyd Blvd., Suite 1000
Portland, OR 97232 (503) 273–2400
The U.S. Department of Agriculture (USDA) prohibits discrimination in all its programs and activities on the basis of race, color, national origin, age, disability, and where applicable, sex, marital status, familial status, parental status, religion, sexual orientation, genetic information, political beliefs, reprisal, or because all or a part of an individual’s income is derived from any public assistance program. (Not all prohibited bases apply to all pro-grams.) Persons with disabilities who require alternative means for commu-nication of program information (Braille, large print, audiotape, etc.) should contact USDA’s TARGET Center at (202) 720-2600 (voice and TDD). To file a complaint of discrimination, write to USDA, Director, Office of Civil Rights, 1400 Independence Avenue, SW., Washington, DC 20250–9410, or call (800) 795-3272 (voice) or (202) 720-6382 (TDD). USDA is an equal opportunity provider and employer.
This document presents a revised and updated NRCS Stream Visual As-sessment Protocol Version 2 (SVAP2) for use by conservation planners, field office personnel, and private landowners. Like its predecessor, it is a relatively easy-to-use tool for qualitatively evaluating the condition of aquatic ecosystems associated with wadeable streams, that is, those shal-low enough to be sampled without use of a boat. Such wadeable streams include those modified to improve drainage on agricultural lands, especially if these systems are part of an ecologically functional stream and/or river network. While the protocol does not require users to be experts in aquatic ecology, it does require they read the protocol’s user guidance thoroughly before beginning an assessment. The SVAP and SVAP2 are tools that work best when users first identify local stream reference conditions that can effectively provide a standard for comparison. State offices are encouraged to refine the protocol based on the physical settings, stream conditions, and life history requirements of aquatic fauna found in their specific locales. Additional guidance on how to make State modifications is provided in ap-pendix C.
Both versions of the SVAP provide a relatively basic level of ecological assessment based on qualitative descriptions. Each is designed to give a snapshot of wadeable stream ecosystem conditions that allows planners and conservationists to assist landowners with determining the quality of stream habitats located on their property. SVAP2 was developed to provide more comprehensive descriptions of several scoring elements, namely, channel condition, hydrological alteration, riparian area conditions, and fish habitat complexity. Field conservationists are encouraged to use SVAP2 in those situations where more detail is needed to critically score these ele-ments and their relative contribution to the condition of the stream. This version lends itself to tracking trends in stream conditions over time, as well as identifying resource concerns and their potential causes. The origi-nal SVAP is designed to be conducted with the landowner. SVAP2 can be completed with a landowner or conservation planning team. Background information relevant to ecological processes and functions of stream/ripar-ian ecosystems is incorporated into both versions of the SVAP.
This version of the Stream Visual Assessment Protocol (SVAP) was devel-oped by the U.S. Department of Agriculture (USDA) Natural Resources Conservation Service (NRCS) under the leadership of Kathryn Boyer, fish biologist, West National Technology Support Center, Portland, OR. The SVAP Revision Workgroup members provided substantial assistance in revi-sion of the overall protocol and specific scoring elements.
Jenny Adkins, water quality specialist, NRCS, Nashville, TN
Kale Gullett, fisheries biologist, East National Technology Support Center, Greensboro, NC
Edward Neilson, resource conservationist, NRCS, Grand Junction, CO Barry Southerland, fluvial geomorphologist, West National Technology Support Center, Portland, OR
Billy Teels (retired), Central National Technology Support Center, Fort Worth, TX
Deborah Virgovic, fisheries biologist, NRCS, Mount Vernon, WA
Kip Yasumiishi, civil engineer, West National Technology Support Center, Portland, OR
Formal technical reviews of an earlier draft of the protocol were completed by the following people whose assistance is much appreciated.
Greg Kidd, biologist, NRCS, Madison, WI Julie Hawkins, biologist, NRCS, Richmond, VA Robert Weihrouch, biologist, NRCS, Madison, WI
Mitch Cummings, fisheries biologist, NRCS, Tillamook, OR
Todd Bobowick, soil conservationist (fisheries), NRCS, Torrington, CT Erin Myers, biologist, NRCS, Gainesville, FL
Romy Myszka, biologist, NRCS, Fort Worth, TX
Jennifer Anderson-Cruz, biologist, NRCS, Des Moines, IA Stephen Brady, wildlife biologist, NRCS, Fort Worth, TX Chet Hadley, biological science technician, NRCS, Heppner, OR Andrew Lipsky, biologist, NRCS, Warwick, RI
Daniel Thompson, wildlife biologist, NRCS, Grand Junction, CO National Riparian Service Team, Bureau of Land Management, Prineville, OR
Contents: 614.00 Introduction 614–1
614.01 What is a healthy stream? 614–2
614.02 Stream classification 614–5
614.03 Reference sites 614–5
614.04 Using this protocol 614–6
(a) Preliminary assessment of the stream’s watershed ...614–6 (b) Delineating the assessment reach ...614–6 (c) Scoring the elements of the Stream Visual Assessment Protocol ...614–8
614.05 Stream assessment elements 614–9
(a) Element 1—Channel condition ...614–9 (b) Element 2—Hydrologic alteration ...614–17 (c) Element 3—Bank condition ...614–19 (d) Elements 4 and 5—Riparian area quantity and quality ...614–21 (e) Element 6—Canopy cover ...614–24 (f) Element 7—Water appearance ...614–26 (g) Element 8—Nutrient enrichment ...614–27 (h) Element 9—Manure or human waste presence ...614–28 (i) Element 10—Pools ...614–29 (j) Element 11—Barriers to aquatic species movement ...614–31 (k) Element 12—Fish habitat complexity ...614–32 (l) Element 13—Aquatic invertebrate habitat ...614–34 (m) Element 14—Aquatic invertebrate community ...614–36 (n) Element 15—Riffle embeddedness ...614–40 (o) Element 16—Salinity (if applicable) ...614–41
614.06 References 614–42
Appendices
Appendix A Additional References for Further Reading A–1
Appendix B Glossary B–1
Appendix C Technical Information to Support Implementation of the C–1 Stream Visual Assessment Protocol Version 2
Tables Table 1 Guide to figure ratings and CEM stage 614–14
Table C–1 Correlations between qualitative SVAP metrics and C–3 quantitative EMAP metrics
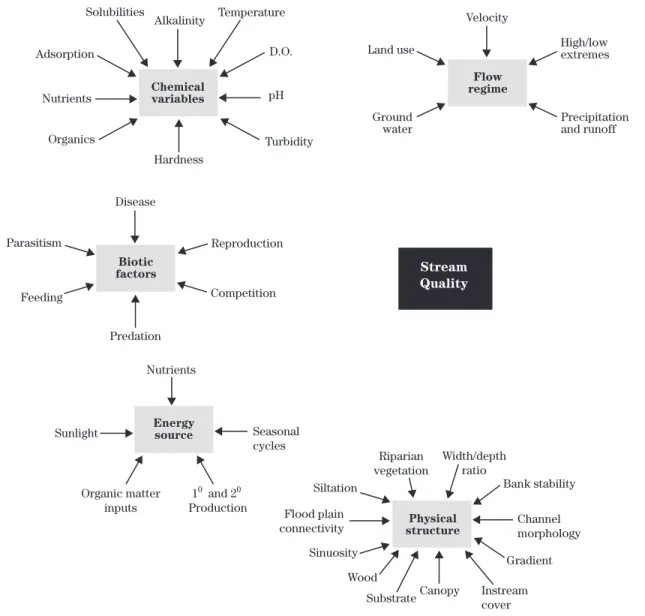
Figures Figure 1 Factors that influence the quality or condition of 614–3 streams (modified from Karr et al. (1986))
Figure 2 Baseflow, bankfull, and flood plain locations 614–7
Figure 3 Channel Evolution Model 614–9
Figure 4 CEM stage I. Typically excellent channel condition 614–9 with natural bank protection
Figure 5 CEM stage II. Poor channel condition, headcuts 614–10 common
Figure 6 CEM stage III, with bars adjacent to vertical banks 614–10
Figure 7 CEM stage V channel, with developing flood plain and 614–10 abandoned flood plain, now a terrace
Figure 8 CEM stage I. Score: 10 614–12
Figure 9 CEM stage V. Score: 9 614–12
Figure 10 CEM stage I. Point bars below bank. Score: 8 614–12
Figure 11 CEM stage V. Slight flood plain detachment. Score: 8 614–12
Figure 12 CEM stage V. Score: 7 614–13
Figure 13 CEM stage IV. Score: 6 614–13
Figure 14 CEM stage IV. Score: 5 614–13
Figure 15 CEM stage III. Score: 4 614–13
Figure 16 CEM, stage II. Score: 3 614–14
Figure 17 CEM stage III, with active point bars forming. Score: 614–14 2 or 1
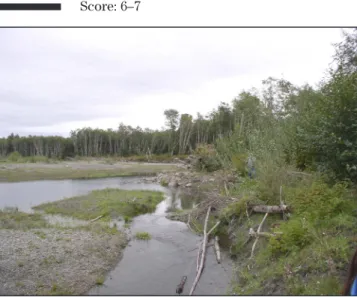
Figure 19 Aggrading channel with point bar separated from 614–15 flood plain. Score: 8
Figure 20 Aggrading channel with shallow areas in reach. Score: 614-15 6–7
Figure 21 Aggrading channel, downward trend with lateral 614–15 migration evident. Score: 5
Figure 22 Multiple aggraded wide and shallow channels, with 614–16 actively eroding streambanks. Score: 4
Figure 23 Aggraded channel. Score: 2 614–16
Figure 24 Aggraded channel. Score: 1–0 614–16
Figure 25 Percent canopy cover 614–25
614.00 Introduction
The Stream Visual Assessment Protocol (SVAP) is a national protocol that provides an initial evaluation of the overall condition of wadeable streams, their ripar-ian zones, and their instream habitats. The majority of the Nation’s streams and rivers are small, often with intermittent flows and, yet, they constitute a close multidimensional linkage between land and water management. These smaller streams and rivers are increasingly a focus of Natural Resources Conserva-tion Service (NRCS) assistance to landowners. This protocol is developed for relatively small streams, be they perennial or intermittent. If the stream can be sampled during low flow or seasonally wet periods of the year without a boat, it can be assessed using the SVAP. Although this protocol has been developed for use nationwide, its authors recognize the importance of regional differences in influencing stream condi-tions. The NRCS thus encourages modification and calibration of the national protocol’s scoring elements, if needed, to achieve greater sensitivity to resource conditions at State and regional levels. Thus, version 2 (SVAP2) can be viewed as a national framework for States to revise or amend, if necessary, to better assess local stream and riparian conditions. Guidance for such modifications is provided in appendix C. The SVAP2 protocol can be successfully applied by conservationists with limited training in biology, geomorphology, or hydrology. Since publication of the initial version of the SVAP, the protocol has taken on broader applications as a tool to evaluate quality criteria for conservation planning, establish eligibil-ity for Farm Bill programs, identify potential resource concerns, and assess trends in stream and riparian conditions over time. Consequently, NRCS State Offic-es have played a large role in modifying the protocol, updating training materials, and transferring SVAP2 technology to the field. States should continue with such efforts and also pay close attention to achieving consistency in how the protocol is applied within their States and in adjacent States. It is less critical that a particular assessment discern between a score of 5 or 6 with subtle subjective differences than it is that the protocol be interpreted and applied consistently,
year-to-year by multiple users. Consistency, efficiency, and effectiveness can be gained by collaborating closely with local users and those in other States within the region. NRCS State Offices are encouraged to contact appropriate National Technology Support Center (NTSC) specialists regarding refinement of this SVAP2’s scoring criteria to more accurately reflect local conditions. NTSC specialists can also assist with coordinating regional training to improve understand-ing of the methodology and consistency in use of the SVAP2.
The SVAP2 is a preliminary qualitative assessment tool to evaluate features that affect overall stream condi-tions at the property level. The tool assesses visually apparent physical, chemical, and biological features within a specified reach of a stream corridor. Because of its qualitative nature, the protocol may not detect all causes of resource concerns, especially if such causes are a result of land use actions in other parts of the watershed. It does provide a means to assess site conditions in the context of the larger watershed. A synthesis of information gathered during the prelimi-nary assessment and field assessment portions of the protocol can be used to provide general guidance to landowners on how watershed features and practices they employ are reflected in the quality of their stream ecosystems.
614.01 What is a healthy
stream?
A stream’s watershed captures precipitation, filters and stores water, and regulates its release through the stream channel network and eventually into a lake, another watershed, or an estuary and the ocean. Watersheds are characterized by different climates, geomorphic features, soil types, vegetation, and land uses. Their upland features control the quantity and timing of water and materials that make their way overland and into a stream system. The environmental conditions of a stream or river corridor (such as water quantity and quality, riparian and flood plain function, and habitat quality) are thus linked to the entire wa-tershed. These linkages affect stream processes that act vertically, laterally, longitudinally, and over time. Land managers may have little control of watershed management beyond their property lines or jurisdic-tional boundaries. Nevertheless, activities that occur in many individual farm fields, rangelands, or pastures can have cumulative impacts on the condition of an individual landowner’s stream and those downstream. Soundwatershed and stream corridor management are important for maintaining stream conditions that allow the stream to be resilient and resistant to natu-ral disturbance and human-caused perturbations. The natural resilience of a stream to recover from floods, fire, and drought is an indicator that it is healthy (Meyer 1997).
Streams, their flood plains, and adjacent riparian areas are complex ecosystems where numerous biological, physical, and chemical processes interact (Cushing and Allen 2001). Changes in any one feature or process in a stream ecosystem have cascading effects through-out the stream as it flows downstream and as its flows change with seasonal shifts in precipitation. Stream processes are interconnected, and these connections maintain a balance of materials that are transported and deposited by the stream, including sediment, water, wood, and nutrients. If conditions change, these processes must readjust to keep the stream resilient and functional for energy and material transport and aquatic fauna and flora. The conditions of a stream reflect current and past land uses and management ac-tions. As such, they can also help predict future trends of watershed land use and conditions.
Multiple factors affect stream conditions and, there-fore, stream quality (fig. 1). For example, increased nu-trient loads alone may not cause a visual change to a forested stream, but when combined with tree removal and channel widening, the result may shift the energy dynamics from a community based on leaf litter inputs to one based on algae and aquatic plants. The result-ing chemical changes caused by photosynthesis and respiration of aquatic plants coupled with temperature increases due to loss of canopy cover will alter the aquatic community.
Many stream processes are in delicate balance. For example, the force of the streamflow, amount of sedi-ment, and stream features that slow or hasten flow must be in relative balance to prevent channel incision or bank erosion. Increases in sediment loads beyond the capacity of the stream to transport them down-stream can lead to extensive deposition of sediments and channel widening.
Lastly, the biological community of a stream also affects its overall condition. As indicators of biologi-cal integrity fish, aquatic invertebrates, and all other members of a stream’s community portray a pattern of stream condition that further enhances our abil-ity to detect concerns. For example, the prevalence of exotic species in a fish assemblage of a particular stream often indicates deterioration in stream function or quality. While beyond the scope of the SVAP2, such indices of biological integrity provide an even more comprehensive picture of a stream ecosystem’s condi-tion (Giller and Malmqvist 1998; Matthews 1998). Stream corridors benefit from complex and diverse physical structure. Such complexity increases chan-nel roughness that dissipates the energy of water and reduces its erosive power. Structural complexity is provided by channel form (meanders, pools, riffles, backwaters, wetlands), profile (stream gradient, width, and depth), materials that have fallen into the chan-nel (trees and bank material), overhanging vegetation, roots extending into the flow, and streambed materials (sand, gravel, rocks, and boulders). The movement of these materials and the path of flow form pools, riffles, backwaters, side channels, flood plain wetlands, and many other types of habitats. Thus, streams with com-plex flood plains and a diversity of structural features generally support a higher diversity of aquatic species
Figure 1 Factors that influence the quality or condition of streams (modified from Karr et al. (1986)) Nutrients Adsorption Solubilities Alkalinity Temperature D.O. pH Turbidity Disease Riparian vegetation Hardness Seasonal cycles Nutrients Sunlight Siltation Sinuosity Wood Substrate Gradient Channel morphology Flood plain connectivity Width/depth ratio Bank stability Organic matter inputs 1 0 and 20 Production Instream cover Canopy Competition Reproduction Ground water
Land use High/lowextremes
Precipitation and runoff Velocity Organics Parasitism Feeding Predation Chemical variables Biotic factors Energy source Physical structure Flow regime Stream Quality
(Schlosser 1982; Pearsons et al. 1992; Gurnell et al. 1995).
Chemical pollution of streams and rivers diminishes stream health and harms aquatic species. The major categories of chemical pollutants are oxygen-deplet-ing sources such as manure, ammonia, and organic wastes; nutrients such as nitrogen and phosphorus from both fertilizers and animal wastes; acids from mining or industrial effluents; and contaminants such as pesticides, salts, metals, and pharmaceuticals. It is important to note that the effects of many chemicals depend on multiple factors. For example, an increase in the pH caused by excessive algal plant growth may cause an otherwise safe concentration of ammonia to become toxic.
Finally, it is important to recognize that healthy, resil-ient streams, riparian areas, and flood plains operate as a connected stream corridor system. Lateral ex-change of water and materials between a stream and its flood plain is the driving force for nutrient dynam-ics in the stream corridor community. Primary produc-tivity of flood plain habitats is closely tied to hydrope-riod, or the length of time the flood plain is inundated or saturated with water. Productivity is greatest in wet-lands with pulsed flooding (periodic inundation and drying) and high nutrient input and lower in drained or permanently flooded conditions. Flood plains and their associated wetlands play a critical role in the health of the stream itself. An example would be the removal of nitrogen (denitrification) in floodwaters by flood plain wetlands (Forshay and Stanley 2005).
Riparian wetlands may also influence stream channel morphology and flows, buffering the stream channel against the physical effects of high flows by dissipat-ing energy as waters spread out onto the flood plain. In many instances, these flood plains provide refuge habitat for aquatic species, especially during flood events. As streamflows recede, riparian wetlands provide water storage, slowly releasing water and aquatic organisms back to the stream through surface and subsurface transport, thereby influencing stream baseflows during drier times of the year.
In summary, physical, chemical, and biological ele-ments that influence stream conditions also provide indicators of how well a stream is functioning and responding to natural disturbances (floods) or
hu-man actions (land clearing). A stream corridor that maintains key ecological and physical functions over time is a healthy, resilient ecosystem that can support diverse communities of aquatic species.
614.02 Stream
classifica-tion
A healthy stream will look and function differently de-pending on its location or ecological setting. A moun-tain stream that flows through a narrow valley over a shale bedrock bottom is very different from a stream that flows through a wide valley over alluvial deposits. Similarly, coastal streams are different from piedmont streams and desert canyon streams. Accurately classi-fying the type of stream in an area of interest is impor-tant to assessing the current condition, or health, of that particular stream. Stream classification is a way to account for the effects of natural variation in streams and helps avoid comparing the conditions of streams of different classes. A stream’s classificationprovides a point of reference for subsequent assessments that may occur at the site. Ideally, a separate SVAP modifi-cation should be developed for each stream class, but realistically, this is not possible. At best, States should identify only as many stream classes as are necessary to account for natural variation in streams caused by the prevailing environmental influences of their region. Some important factors to consider are major land re-source areas (MLRA) or ecoregion, drainage area, and gradient. Ecoregions are geographic areas in which ecosystems are expected to be similar. Drainage area is the size of the area of a watershed (catchment or basin). Gradient is the slope of a stream. For example, an SVAP2 modification may be warranted for low gradient, wadeable streams of the northern Piedmont of North Carolina. References regarding stream clas-sification can be found in appendix A.
NRCS State Offices are responsible for SVAP2 modifi-cations. Because there are many stream classification systems, States should select the one most suitable to their ecoregion and decide the scale at which their SVAP2 will be modified or refined (for all stream classes within the State, for all stream classes within an ecoregion of the State, or for several stream classes within an ecoregion). Enough up-front work should be done by State Offices in tailoring the protocol to permit field offices to use it without further modifica-tion. This includes refining and evaluating the pro-tocol, modifying the element criteria and scoring to reflect local conditions, and delineating the geographic boundaries for its intended use.
614.03 Reference sites
One of the most difficult challenges associated with evaluating a stream’s quality or existing condition is the determination of historic and potential condi-tions. An accurate assessment of the stream requires a benchmark of, or reference to, what a healthy stream in the targeted ecoregions should look like. It is often assumed that historic conditions of streams were healthy or resilient after disturbances. However, it is unrealistic to expect that all stream systems can potentially be as resilient as they were prior to exten-sive land use activity. In such cases, land managers often identify a benchmark condition that reflects the least impaired conditions of the ecoregion. Under this scenario, the SVAP2 would be adapted to reflect the stream corridor conditions to which managers are aspiring to.Reference sites represent the range of conditions that potentially exist for a particular class of stream. Least impaired reference sites represent the best condi-tions attainable, and most impaired reference sites the worst. One challenge in selecting least impaired refer-ence sites is that there are few streams left, especially in agricultural landscapes, that have not been influ-enced by human actions. Accessible, least impaired reference sites are important not only because they define a benchmark for attainable conditions, but they also serve as demonstration areas for field staff to observe the characteristics of the region’s best streams that would result in the highest possible SVAP2 scores. A common pitfall in reference site selection is the fail-ure to survey a wide enough area to find sites that are truly least impaired and are representative of an entire class of stream. Another common problem, particular-ly in highparticular-ly altered landscapes, is the failure to identify sites that are most impaired. In addition to setting the lower bar of the stream health gradient, most impaired sites provide a clear illustration of how streams are not supposed to look and serve as models for improve-ment actions. Remember, reference sites should rep-resent an entire stream class and thus may be located in another county or State. Therefore, it helps if they can be identified at a State or higher level and with the help of State agencies that may have already estab-lished reference sites that represent a full range of human perturbations for a given class of stream.
614.04 Using this protocol
This protocol is intended for use in the field with the landowner. Conducting the assessment with the landowner provides an opportunity to discuss natural resource concerns and conservation opportunities. Be-fore leaving the office to assess a stream, a preliminary assessment of watershed features should be conduct-ed in the field office. The Stream Visual Assessment Summary Sheet (exhibit 1) provides a standardized form for recording information and data collected during both the preliminary and field portions of the assessment.(a) Preliminary assessment of
the stream’s watershed
• Become familiar with watershed conditions before going to the assessment site. Stream con-ditions are influenced by the entire watershed including uplands that surround the assessment site. Changes in upland conditions can change the discharge, timing, or duration of streamflow events that affect stream conditions. Aerial pho-tographs, topographic maps, stream gages, and any other source of data available can be used to obtain information about watershed conditions before conducting the SVAP2 on a stream. State agencies, watershed groups, local landowners, and Federal land managers are likely to already have documented relevant information about watershed conditions. Ecoregion descriptions, size of the watershed (drainage area) and upland practices often explain conditions at the assess-ment site and are helpful for addressing some of the elements in SVAP2.
• Gather land use information about the water-shed to provide a context for the stream to be assessed and a better understanding of the condi-tions at the site. For example, road crossings and water control structures may prevent movement of aquatic species. Mining, agriculture, and ur-banization all influence water quality and quan-tity, as well as stream corridor condition. • Review available water resource information
for the watershed and stream reach. Water con-trol structures and/or activities outside of the assessment reach may be affecting streamflow.
Ask the landowner if he or she is aware of up-stream withdrawals (surface diversions or pump stations), drains, or any features that affect the amount of instream flow during the year. The U.S. Environmental Protection Agency’s (EPA) Surf Your Watershed Web site (http://www.epa. gov/surf) is also a good source of information. • Consult the State fish and wildlife agency
re-garding stream and riparian species likely to be present in the reach and whether fish passage to or from the area is limited.
• Become familiar with potential riparian plant species and community types appropriate to the area to be assessed.
(b) Delineating the assessment
reach
Assess one or more representative reaches, evaluate conditions on both sides of the stream, and indicate left and right bank conditions looking downstream. A reach is a length of stream with relatively consistent gradient and channel form. An assessment reach for this protocol is, at a minimum, a length of stream equal to 12 times the bankfull channel width. Longer reaches may be appropriate, depending on the objec-tives of the assessment.
Bankfull channel width is the stream width at the bankfull discharge, or flow rate that forms and con-trols the shape and size of the active channel. Bankfull discharge or bankfull flow is the flow rate at which the stream begins to move onto its active flood plain, if one is present. On average, the bankfull discharge occurs every 1.5 to 2 years, depending on local stream channel and weather conditions. Figure 2 illustrates the relationship between baseflow (low flow), bankfull flow, and the flood plain.
Bankfull width is determined by locating the first flat depositional surface occurring above the bed of the stream. The lowest elevation at which the bankfull sur-face could occur is at the top of the point bars or other sediment deposits in the channel bed. These generally occur on the inside of the meanders (white part of the figure 2). Other indicators of bankfull elevation include a break in slope on the bank, vegetation changes or ex-posed roots, a change in the particle size of bank mate-rial, and wood or small debris left from high waters. In
temperate areas of the country, vegetation can grow into depositional bars below some bankfull indicators. Therefore, look for signs of well-established vegeta-tion at the elevavegeta-tion level with the top of point bars to help identify bankfull stage.
The following videos and documents are resources to assist field personnel in identifying bankfull discharge indicators across the coterminous United States. They can be downloaded from: http://www.stream.fs.fed.us. Click on “Publications and Products.”
• A Guide to Field Identification of Bankfull Stage in the Western United States, principally narrated by Luna B. Leopold.
• Identifying Bankfull Stage in Forested Streams of the Eastern United States, principally narrated by M. Gordon Wolman.
• Guide to Identification of Bankfull Stage in the Northeastern United States. USDA General Tech-nical Report (RMRS–GTR–133–CD). Fort Collins, CO.
• Harrelson, C., L. Rawlins, and J.P. Potyondy (1994). Stream Channel Reference Sites: An Illus-trated Guide to Field Technique. USDA General Technical Report (RM–245): 61.
Often the stream length within the landowner’s prop-erty boundaries is shorter than the minimum length needed to adequately determine conditions using the SVAP2. If permission is received to cross property boundaries, it is appropriate to do so to evaluate an adequate length of the stream. If crossing property boundaries is not an option, the assessment reach length will be the length that is within the property boundaries. When large sections of stream are to be assessed and there are constraints that prohibit assess-ing the entire stream length, representative reaches of the stream on the property should be subsampled. Using aerial photographs, topographic maps, and various stream classification methods, streams can be stratified into smaller units (stream reaches) that share common physical characteristics such as stream gradient and average bankfull width. The degree of
Figure 2 Baseflow, bankfull, and flood plain locations (Rosgen 1996)
Flood plain Flood plain
Bankfull
Inside of meander
Bankfull Baseflow
stratification will depend on the reason for assess-ing the stream. If simply providassess-ing an opportunity for the landowner to learn about the general conditions of the stream, perhaps only one reach is assessed. If the SVAP2 is being conducted to identify potential improvement actions, the entire stream within the property should be assessed. SVAP2 scores can then be used as a preliminary and qualitative evaluation of conditions. Low scores likely indicate more quantita-tive assessments of geomorphic, hydrological, and biological features of the stream corridor are needed to determine what stressors are causing the problems identified. Quantitative assessments should only be completed by trained specialists (stream ecologists, hydrologists, geomorphologists, hydraulic engineers) to assure the complex features influencing stream con-ditions are being evaluated as accurately as possible. If there are several stream types (reaches) within the property, multiple stream visual assessments should be completed, one for each reach. Regardless of the situation, the SVAP2 requires field personnel to score four elements based upon the entire length of the stream that is within a single landowner’s property. These are: riparian area quantity, riparian area quality, canopy cover, and barriers to aquatic species move-ment.
(c) Scoring the elements of the
Stream Visual Assessment
Protocol
The SVAP2 ideally should be completed during base-flows when habitat feature limitations are likely to be most visible. Each assessment element is scored with a value of zero to 10. Some of the 16 elements, for example, salinity, may not be relevant to the stream being assessed. Score only those elements appropriate to the ecological setting of the stream. Livestock or hu-man waste should be scored in all reach assessments. Background information is provided for each assess-ment eleassess-ment, as well as a description of what to look for. Using Part 2B of the Stream Visual Assessment Protocol Summary Sheet, record the score that best fits the observations made in the assessment reach. Base observations on the descriptions in the matrix provided for each element assessed. Assign a score that applies to the conditions observed in the assess-ment reach. If the conditions of the stream fit
de-scriptions that occur in more than one column of the matrix, score the element based on the lower valued descriptions. For example, when scoring the element hydrological alteration, if bankfull flows occur accord-ing to the natural flow regime (score 10–9 column), but there is a water control structure present (score 8–7 column), assign the score based on the lowest scoring indicator present within the reach, which in this case would be an 8 or 7. Again, evaluate conditions on both sides of the stream, and note left bank and right bank conditions while looking downstream.
The complete assessment is recorded on the summary sheet, which consists of two principal sections: Pre-liminary Watershed Assessment and Field Assessment. Section 1 records basic information about the water-shed and reach such as drainage area, location, and land uses. Space is provided for a description of the reach, which may be useful to locate the reach or illustrate problem areas. On the worksheet, indicate tributaries, presence of drainage ditches, and irriga-tion ditches; note springs and ponds that drain to the stream; include road crossings, and note whether they are fords, culverts, or bridges.
Section 2 is used to record the scores for up to 16 assessment elements. Score an element by compar-ing the observations to the descriptions provided. If matching descriptions is difficult, try to compare what is being observed to the conditions at reference sites for the area. Again, some of the elements may not be applicable to the site and, therefore, should not be included in the assessment. The overall assess-ment score is determined by adding the values for each element and dividing by the number of elements assessed. For example, if the scores add up to 76 and 12 assessment elements were used, the overall assess-ment value would be 6.3, which is classified as FAIR. This value provides a numerical score of the environ-mental condition of the stream reach. This value can be used as a general statement about the state of the environment of the stream or (over time) as an indica-tor of trends in condition.
614.05 Stream assessment
elements
(a) Element 1—Channel
condi-tion
Description and rationale for assessing chan-nel condition
The shape of a stream channel changes constantly, im-perceptibly, or dramatically, depending on the condi-tion of the stream corridor (channel, riparian area, and flood plain) and how it transports water and materials. Channel condition is a description of the geomorphic stage of the channel as it adjusts its shape relative to its flood plain. Channel adjustments resulting in a dra-matic drop in streambed elevation (incision or degra-dation) or excessive deposition of bedload that raises the bed elevation (aggradation) affect the degree of bank shear and often decrease stream channel stabil-ity. Such channel adjustments can have substantial effects on the condition of streams, adjacent riparian areas, associated habitats, and their biota. For ex-ample, the greater the incision in a channel, the more it is separated from its flood plain, both physically and ecologically. Conversely, the greater the aggradation, the wider and shallower a stream becomes, which can affect riparian vegetation, surface water temperatures, and stream and riparian habitat features.
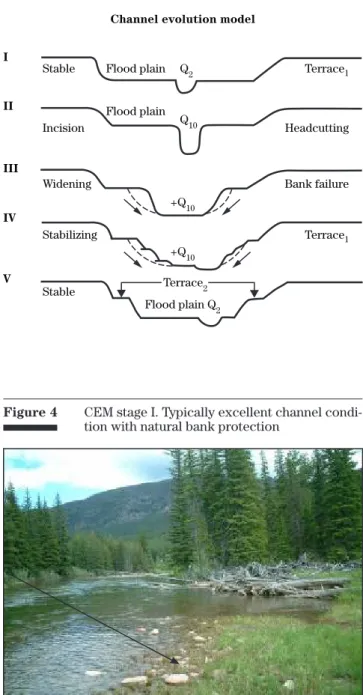
Conceptual models of how a channel evolves or ad-justs over time illustrate the sequence of geomorphic changes in a stream that result from disturbances in the watershed. Such sequences are useful for evalu-ating trends in channel condition. The stages of the Schumm Channel Evolution Model (CEM), as shown in figure 3, provide a visual orientation of the pattern of streambed adjustment in an incising stream, its gradual detachment from the existing flood plain, and eventual formation of a new flood plain at a lower elevation. A similar model by Simon (1989) is also de-scribed in the Stream Corridor Restoration Handbook (FISRWG 1998) available in most NRCS field offices. Stage I channels are generally stable and have fre-quent interaction with their flood plains. The relative stability of the streambed and banks is due to the fact that the stream and its flood plain are connected, and flooding occurs at regular intervals (Q2). Consequently,
the stream’s banks and flood plain are well vegetated. Depositional areas (bars), if present, form a gradual transition into the active flood plain, as shown by the arrow in figure 4.
Channel evolution model
I
Stable Flood plain Flood plain Terrace2 Flood plain Q2 Q2 Q10 +Q10 +Q10 Incision Widening Stabilizing Stable Terrace1 Headcutting Bank failure Terrace1 II III IV V
Figure 3 Channel Evolution Model, after Schumm, Harvey and Watson (1984). Q2 indicates a flood interval of 2 years; Q10 indicates an interval of 10 years
Figure 4 CEM stage I. Typically excellent channel condi-tion with natural bank proteccondi-tion
Land use activities that increase runoff, such as land-clearing, paving, or channel straightening, often result in channel incision processes characteristic of stage II in channel evolution. The height of the banks increases due to downcutting of the channel, and the stream and flood plain have less frequent interaction. Bank vegeta-tion becomes stressed, and banks are prone to failure. Once failures begin, the channel widening of stage III begins. A stage II channel is typically narrower at the bed relative to the depth (often referred to as low width-to-depth ratio) than a stage III channel. A stage II channel is in an active downward trend in condition and active headcuts are often present (fig. 5).
During stage III, bank failures increase the formation of bars located next to the now relatively vertical banks. In stage III, alternating point bars are typically forming on opposite banks adjacent to vertical banks (fig. 6).Channel widening continues until the stream bed is wide enough to disperse streamflows and slow the water, beginning stage IV in channel evolution. Bank vegetation loss continues.
During stage IV, sediments begin to build up in the channel instead of moving downstream, aggrading the bed. Eventually, vegetation begins to establish in the sediment deposited along the edge of the stream, cre-ating channel roughness and further slowing the flow. An early stage IV channel indicates relatively poor conditions, while a late stage IV channel indicates an
Figure 7 CEM Stage V channel, with developing flood plain (left) and abandoned flood plain, now a terrace, behind trees on right side of stream improving trend in channel condition. At this stage, the stream has become more sinuous. Alternating bar features are apparent.
Stage V begins when a new flood plain begins to form. Early in stage V, bank vegetation may not be fully established, and some bank erosion is likely. In a late stage V, the original active flood plain from stage I is now a high terrace, and the evolution of a stage I channel begins, with a new flood plain developing at a lower elevation than the terrace (fig. 7).
Figure 6 CEM stage III, with bars adjacent to vertical banks
Figure 5 CEM stage II. Poor channel condition, head-cuts common
The reader should keep this conceptual channel evolu-tion model in mind as he or she visually assesses the characteristics of the stream. In areas where heavy vegetation occurs naturally due to higher annual pre-cipitation, eroded banks and slightly incised channels may be masked and consequently harder to observe. In these areas, try to observe bank features from a
location near the channel bed. In using the scoring matrix, note that a channel that is either incising or ag-grading cannot score higher than an 8. Use the upper right portion of the matrix to score incising or incised channel reaches. Use the lower right portion of the matrix to score aggrading channel reaches.
Natural, stable channel with established bank vegetation
If channel is incising (appears to be downcutting or degrading), score this element based on the descriptions in the upper section of the matrix
No discernible signs of inci-sion (such as vertical banks) or aggradation (such as very shallow multiple channels) Active channel and flood plain are connected throughout reach, and flooded at natural intervals
Streambanks low with few or no bank failures
Stage I : Score 10
Stage V: Score 9 (if terrace is visible)
No more than 1 bar forming in channel
Evidence of past incision and some recovery; some bank erosion possible
Active incision evident; plants are stressed, dying or falling in channel
Headcuts or surface cracks on banks; active incision; vegetation very sparse Active channel and flood
plain are connected in most areas, inundated seasonally
Active channel appears to be disconnected from the flood plain, with infrequent or no inundation
Little or no connection be-tween flood plain and stream channel and no inundation Streambanks may be low or
appear to be steepening
Steep banks, bank failures evident or imminent
Steep streambanks and fail-ures prominent
Top of point bars are below active flood plain
Point bars located adjacent to steep banks
Point bars, if present, located adjacent to steep banks Stage I: Score 8
Stage V: Score 7–8 Stage IV: Score 6
Stage IV: Score 5 Stage III: Score 4 Stage II: Score 3
Stage II or III, scores ranging from 2 to 0, depending on severity
8 7 6 5 4 3 2 1 0
If channel is aggrading (appears to be filling in and is relatively wide and shallow), score this element based on the descriptions in the lower section of the matrix
Minimal lateral migration and bank erosion
Moderate lateral migration and bank erosion
Severe lateral channel migra-tion, and bank erosion A few shallow places in
reach, due to sediment deposits
Deposition of sediments causing channel to be very shallow in places
Deposition of sediments causing channel to be very shallow in reach
Minimal bar formation (less than 3)
3–4 bars in channel Braided channels (5 or more bars in channel)
10 9 8 7 6 5 4 3 2 1 0 Element 1 Channel condition
What to look for
State Offices are encouraged to develop photo series appropriate to their particular area. Figures shown are from all regions of the United States.
• Channel is not incising or aggrading. A score of 10 is appropriate for a stage I channel (fig. 8) with a frequently inundated flood plain that often covers the width of the valley. A late stage V channel with a lower active (frequently flooded) flood plain, well-established vegetation on the banks, and a higher terrace (abandoned flood
Figure 8 CEM stage I. Score: 10
Figure 9 CEM stage V. Score: 9
Figure 10 CEM stage I. Point bars below bank. Score: 8
Figure 11 CEM stage V. Slight flood plain detachment. Score: 8
plain) from previous channel evolutions would score 9 (fig. 9).
• Channel appears to be incising. Scores of 8, 7, or 6 indicate degrees of observable detachment between the active bankfull channel and the flood plain. The top of the point bars are below the elevation of the flood plain. A stage I or V channel that has an active, but less frequent, out-of-bank flow into the flood plain would score an 8 (figs. 10 and 11).
Figure 12 CEM stage V. Score: 7
Figure 13 CEM stage IV, Score: 6
Figure 14 CEM stage IV. Score: 5 • Channel is incising. If active channel erosion is
apparent on the outside of meanders of a stage V and it is forming a new flood plain and out-of-bank flows still occur, lower the score to a 7 (fig. 12 ). • Channel is incising. Active bank erosion is
caus-ing sediment build up in channel, formcaus-ing deposi-tional features of a stage IV channel. The channel is still adjusting its width. If top of bars are below active flood plain, score a 6 (fig. 13). Lower score to 5 if top of bars of the stage IV channel are adjacent to steep banks as shown by the arrow in figure 14. • Channel is incising. There is disconnect between
the flood plain and the bankfull channel (fig. 15), with riparian vegetation compromised by lack of seasonal flooding and lowered water table. Channel appears to be widening in areas of sediment build-up, typical of stage III channels (score 4).
Figure 16 CEM stage II. Score: 3
Figure 17 CEM stage III, with active point bars forming. Score: 2 or 1
• Channel is incising with no connection be-tween the active flood plain and the vegetation. Tensile cracks or headcuts often present in a Stage II channel; score would be a 3 (fig. 16).
Figure no. CEM stage SVAP score
4 I 10 5 II 0–1 6 III 4 7 V 9 8 I 10 9 V 9 10 I 8 11 V 8 12 V 7 13 IV 6 14 IV 5 15 III 4 16 II 3 17 III 1–2 18 II 0–1
Table 1 Guide to figure ratings and CEM stage • Channelis deeply incised and completely
disconnected from flood plain, usually charac-teristic of a stage II or III, depending on whether channel widening has begun. Scores range from 2 to 0 (table 1) depending on observed conditions (figs. 17 and 18).
What to look for (aggrading channels) The removal of willows and other kinds of riparian vegetation will decrease bank stability and contribute to streambank failure. Excessive streambank failure and lateral migration (the process of a stream shifting from side to side within a valley or other confinement) often result in wider and shallower channels unable to transport sediments downstream. Excessive channel filling occurs when a stream channel can no longer transport both the size and load of sediments associat-ed with the watershassociat-ed runoff conditions. Streams with no pools that previously had pools and riffles are most likely aggraded. Stream segments that are excessively wide and shallow with multiple center bars are often aggraded. Streams that once maintained single- or dual-threaded channel patterns, but have converted to a braided system (three or more channels at bankfull discharge), are typically aggraded. Excessively ag-graded systems are unstable and channel adjustments from side to side can be rapid.
• Channel is aggrading. The streambed appears to be filling with sediment faster than it can be transported downstream. Deposits appear over-steepened and unstable, as in figure 21. Channel appears to be wider and shallower than in other reaches of stream. Some bank erosion is evident. Some mid-channel bars may be forming or
pres-Figure 19 Aggrading channel with point bar separated
from flood plain. Score: 8 Figure 21
Aggrading channel, downward trend with lateral migration evident. Score: 5
ent. Bed features such as pools and riffles appear to be less discernible or segregated. Lateral mi-gration of channel is apparent. Point bar(s) may be separated from their flood plain. Scores range from 8 to 6 depending on degree of impairment from stable reference conditions (figs. 19, 20, and 21).
Figure 20 Aggrading channel with shallow areas in reach. Score: 6–7
• Channel is aggrading. Channel is wide and shallow, and the banks are actively eroding. Ex-tensive deposition such as center bars and side bars are present. The streambed appears to have less pool-riffle features with a more consistent riffle-plane bed. Bank vegetation is sparse. Pools that would have typically formed in the meander bend portion are shallow and featureless. Scores range from 5 to 3 (fig. 22).
• Channel is aggrading. Channel is extremely wide and shallow with interconnected channels (figs. 23 and 24). Streambanks are typically un-stable and highly eroded with sparse vegetation. Excessive deposition is common throughout the active channel. Multiple bars, both center and side bars, are located throughout the active chan-nel. Lateral migration is common.
Figure 24 Aggraded channel. Score: 1–0
Figure 22 Multiple aggraded wide and shallow channels, with actively eroding streambanks. Score: 4
In concluding the assessment of this element of SVAP, remember that channel condition is of critical impor-tance to overall stream health, yet difficult to visually assess accurately. Scores of less than 5 for channel condition may indicate substantial channel adjust-ments are occurring and a quantitative assessment by well-trained specialists is warranted.
(b) Element 2—Hydrologic
alter-ation
Description and rationale for assessing hydro-logic alteration
Hydrologic alteration is the degree to which hydrol-ogy and streamflow conditions differ from natural, unregulated flow patterns. Streamflow regime affects the distribution and abundance of stream species and influences the health of streams through several physical and chemical processes (Allan 1995; Poff et al. 1997). Naturally occurring daily and annual flow variations provide ecological benefits to flood plain ecosystems and the aquatic and terrestrial organisms that depend upon them (Poff and Ward 1989). With respect to fish, natural streamflow variations provide cues for spawning, egg hatching, rearing, and swim-ming to off-channel flood plain habitats for feeding or reproduction and upstream or downstream migration (Junk et al. 1989).
The full range of streamflow at any point in a given wa-tershed is essential in maintaining the complex physi-cal and biologiphysi-cal structures and functions of a stream corridor. The geometry, composition, and appearance of a stream channel and its adjacent flood plain are largely the result of fluvial processes that govern a dy-namic equilibrium between streamflow, the materials it carries, and riparian vegetation (Lane 1955; Leopold et al. 1964). Bankfull and higher flows are important factors that control stream channel shape and function and maintain physical habitat for animals and plants (Wolman and Miller 1960). Generally, bankfull flow occurs every 1 to 2 years in unregulated alluvial rivers (Wolman and Leopold 1957) and lasts for only a few days each year. However, numerous researchers have recorded bankfull flow return intervals greater than 2 years (Williams 1978), especially in arid and semiarid settings such as in the southwestern United States (Wolman and Gerson 1978). Conversely, in regions dominated by frequent, prolonged rainfall, bankfull flow can occur once or twice yearly. Consequently, the 2-year event should be considered as only a coarse estimate of bankfull flow. The reader is encouraged to seek additional assistance when working in streams where streamflow is generated by monsoonal precipi-tation or other extreme climatic events or affected by significant flow regulation because of upstream reser-voirs, pump plants, or diversions.
Water and land management practices that alter the timing, duration, magnitude, frequency, or rate of change of streamflow patterns can substantially alter riparian and instream habitat along regulated stream reaches (Calow and Petts 1994). Water withdrawals, watershed and flood plain development, agricultural or wastewater effluents, and practices that change sur-face runoff (dikes and levees) or subsursur-face drainage (tile drainage systems) affect the amount and quality of water in a stream channel across the water year. The effects of water withdrawals on aquatic resources and stream condition can usually be readily observed (especially during low-flow periods). However, aug-menting streamflow with irrigation runoff or
stormwa-ter from municipal areas also often results in adverse physical and biological impacts. For example, the total runoff volume from a 1-acre parking lot is about 16 times that produced by an undeveloped acre of meadow (Schueler 1994). Additionally, peak discharge, velocity, and time of concentration also increase significantly when natural landscapes are replaced by impervious surfaces (Booth 1990). Further, runoff introduces pollutants to waterways and often results in rapid physical deterioration and aquatic community changes (Booth and Jackson 1997). Finally, heavy grazing and clearcutting often have similar, although typically less severe, effects (Platts 1991; Jones and Grant 1996).
What to look for
• Ask the landowner about the frequency of bank -full, overbank, and low flows, referring to figure 2 as needed. Be cautious—water in an adjacent field does not necessarily indicate natural flood-ing. The water may have flowed overland from a low spot in the bank outside the assessment reach or be an artifact of irrigation or drainage management.
• Look for indicators that help identify bankfull
stage (refer to channel condition element). If there is newly deposited debris (leaves and branches) or unvegetated mineral sediments (mud lines, sands, and silts) near the edge of the active channel, it is very likely that bankfull or higher flows have occurred in recent months.
• If channel bars are present, inspect the type and
general age of vegetation. A vegetative commu-Bankfull or higher flows
occur according to the flow regime that is characteristic of the site, generally every 1 to 2 years
and
No dams, dikes, or develop-ment in the flood plain1/, or water control structures are present
and
natural flow regime2/ prevails
Bankfull or higher flows occur only once every 3 to 5 years or less often than the local natural flow regime
Bankfull or higher flows oc-cur only once every 6 to 10 years, or less often than the local natural flow regime
Bankfull or higher flows rarely occur
Developments in the flood plain, stream water with-drawals, flow augmentation, or water control structures may be present, but do not significantly alter the natural flow regime2/
Developments in the flood plain, stream water with-drawals, flow augmentation, or water control structures alter the natural flow regime2/
Stream water withdrawals completely dewater channel; and/or flow augmentation, stormwater, or urban run-off discharges directly into stream and severely alters the natural flow regime2/
10 9 8 7 6 5 4 3 2 1 0
1/ Development in the flood plain refers to transportation infrastructure ( roads, railways), commercial or residential development, land con-version for agriculture or other uses, and similar activities that alter the timing, concentration, and delivery of precipitation as surface runoff or subsurface drainage.
2/ As used here, “natural flow regime” refers to streamflow patterns unaffected by water withdrawals, flood plain development, agricultural or wastewater effluents, and practices that change surface runoff (dikes and levees) or subsurface drainage (tile drainage systems).
nity dominated by invasive species or seedlings less than 2 years old is a good indicator that bankfull or higher flows have occurred in the last 2 years, or with some regularity. An absence of vegetation on bars could be interpreted in the same manner, unless the stream is braided (three or more channels with excessive sand, gravel and/or cobble substrates and a notable lack of permanent vegetation) and/or streamflow is sig-nificantly regulated.
• Evidence of flooding includes high water marks,
such as water stain lines, sediment deposits, or stream debris, well above the stream channel. Look for these on streambanks, trees, rocks, or other structures such as bridge pilings or cul-verts.
• Water control structures are any feature that
alters streamflow. Examples commonly include stream surface intakes (pump stations, flash-board or full-round risers, drop pipes, stop log structures, screw or flap gate structures), stream-side infiltration galleries or ring wells, diversions, dikes, or dams (both temporary and permanent). Any water control structures that divert wa-ter directly out of a stream should be suitably screened to prevent entrapment or capture of fish.
(c) Element 3—Bank condition
Description and rationale for assessing bank condition
Stable streambanks are essential components of functional physical habitat and unimpaired biological communities. An excess of fine sediment in streams impacts aquatic species assemblages (Waters 1995) and results in significant water quality impacts with se-vere economic consequences (Pons 2003). Simon et al. (2000) found that unstable streambanks can contribute as much as 85 percent of the total sediment yield in an entire watershed. Severely unstable streambanks can result in the loss of valuable farmland, force changes in water tables, and endanger transportation infra-structure and other flood plain features.
Bank erosion is a natural mechanism in alluvial rivers, cannot be totally eradicated and provides important physical and ecological functions to the evolution of stream channels and flood plains (Wolman and Leo-pold 1957; Hooke and Redmond 1992). Excessive bank erosion usually occurs where riparian areas are de-graded or when a stream is unstable because of chang-es in land management practicchang-es, hydrology, sediment dynamics, or isolation from its flood plain. Bank failures are generally attributed to the interaction of fluvial and gravitational forces (Thorne 1982)—high, steep banks with undercutting occurring at the base of the slopes are very prone to erosion or collapse. A healthy riparian corridor with a well-vegetated flood plain contributes to bank stability. The roots of some perennial grasses, sedges, and woody vegetation can help hold bank soils together and physically protect the bank from scour during bankfull and higher flow events. Therefore, the type of vegetation covering streambanks is an important component of bank stability. For example, many trees, shrubs, sedges, and rushes have the type of root masses capable of withstanding high streamflow events, while Kentucky bluegrass does not. Further, native riparian vegetation generally provides better erosion resistance and bank stability than invasive species (Tickner et al. 2001). Finally, surface and subsurface soil types also influ-ence bank stability. For example, banks with a thin soil cover over gravel or sand are more prone to collapse than are banks with deep, cohesive soil layers. Score each bank individually and average the total to report a single, composite bank condition score.
What to look for
• Evaluate the entire length of all banks along the
assessment reach, and then consider the propor-tion of unstable to stable banks. Obviously, if a quantifiable portion of the reach shows signs of accelerated erosion or bank failures, bank stabil-ity is a problem and should be scored as such. Conversely, if the majority of the reach shows minimal erosion and no signs of bank failure, bank stability is likely good. Finally, it is best to score this element during the summer or when-ever flows in the assessment reach are low.
• Signs of erosion and possible bank stability prob -lems include unvegetated stretches, exposed tree roots, and scalloped edges (sections of eroded bank between relatively intact sections).
• When observing banks from within the active
channel or below bankfull elevation, look for piping holes, rills, and or gullies. Each of these concentrated flow paths is associated with even-tual bank stability problems or outright failures.
• Look for tension cracks while walking along
streambanks. Tension cracks will appear as verti-cal fissures or crevices running along the top of the streambank roughly parallel to the flow.
• Evidence of construction, vehicular, or animal
paths near banks or grazing areas leading di-rectly to the water’s edge suggest conditions that may lead to bank collapse.
• Sections of streambank lying instream adjacent
to existing banks are a telltale sign of active bank erosion and instability.
Banks are stable; protected by roots of natural vegetation, wood, and rock 1/
No fabricated structures pres-ent on bank
No excessive erosion or bank failures 2/
No recreational or livestock access
Banks are moderately stable, protected by roots of natural vegetation, wood, or rock or a combination of materials
Banks are moderately un-stable; very little protection of banks by roots of natural wood, vegetation, or rock
Banks are unstable; no bank protection with roots, wood, rock, or vegetation
Limited number of structures present on bank
Fabricated structures cover more than half of reach or entire bank
Riprap and/or other struc-tures dominate banks Evidence of erosion or bank
failures, some with reestab-lishment of vegetation
Excessive bank erosion or active bank failures
Numerous active bank failures
Recreational use and/or graz-ing do not negatively impact bank condition
Recreational and/or live-stock use are contributing to bank instability
Recreational and/or livestock use are contributing to bank instability
Right bank 10 9 8 7 6 5 4 3 2 1 0 Left bank 10 9 8 7 6 5 4 3 2 1 0
1/ Natural wood and rock does not mean riprap, gabions, log cribs, or other fabricated revetments.
2/ Bank failure refers to a section of streambank that collapses and falls into the stream, usually because of slope instability.
(d) Elements 4 and 5—Riparian
area quantity and quality
Description and rationale for assessing ripar-ian area conditions
Riparian areas are the vegetated areas adjacent to stream channels that function as transitional areas between the stream and uplands. Riparian vegetation thrives on the moisture provided by streamflow and ground water associated with the stream corridor. Ri-parian areas may or may not include flood plains and associated wetlands, depending on the valley form of the stream corridor. For example, steep mountainous streams in narrow V-shaped valleys often do not have obvious flood plains. Riparian areas are among the most biologically diverse habitats of landscapes and are sources of wood, leaves, and organic matter for the stream. These areas provide important habitat and travel corridors for numerous plants, insects, amphib-ians, birds, and mammals.
Ecological processes that occur in the stream corridor are linked to those in uplands via intact riparian areas and flood plains, if present. Riparian areas themselves also provide valuable functions that maintain or im-prove stream and flood plain conditions. The capacity for riparian areas to sustain these functions depends in part on the quality and quantity of the riparian vegeta-tion and how it interacts with the stream ecosystem. The quality of the riparian area increases with the width, complexity, and linear extent of its vegeta-tion along a stream. A complex riparian community consists of diverse plant species native to the site or functioning similarly to native species, with multiple age-classes providing vertical structural diversity suit-able for the site. As explained previously, the quality of riparian areas is influenced by the hydrological features of the stream, as well as upland and bank conditions. Well-established and connected riparian ar-eas perform critical functions for maintaining healthy, resilient stream ecosystems by providing:
• a vegetative filter for surface runoff, reducing
pollutants and sediment entering streams, and no concentrated flow from upland areas
• roughness that slows water and the erosive ef -fects of floodwater
• root systems that bind soil, protect streambank
integrity, and build flood plain surfaces
• moisture, soil conditions, surface macrotopogra -phy and microtopogra-phy, and microclimates for a diversity of riparian plants, animals, and micro-organisms
• structurally diverse habitat for migratory song -birds, as well as resident species of wildlife that are especially dependent on woody riparian vegetation for reproduction and feeding
• shade or overhanging vegetation to maintain
cooler water temperatures for aquatic species
• large wood to forested stream channels, which
offers instream cover, creates pools, traps sedi-ments, and provides habitat for stream biota
• organic material (leaves, twigs, grass) and in -sects for stream and riparian food chains
• undercut banks important to fish for hiding and
resting
• diverse, complex off-channel habitats, such as
backwaters, wetlands, and side channels formed by the interaction of streamflow, riparian vegeta-tion, and often large wood. These areas of slower water provide critical refuge during floods for a variety of aquatic species and serve as rearing areas for juvenile fish
• a diversity of plant species of multiple age
classes, adapted to the site and providing critical habitat for both resident and migratory birds and other riparian wildlife species
Well-established riparian areas are critical for stream health and fish and wildlife habitat. For this reason, it is important to evaluate both the quantity (Element 4) and the quality (Element 5) of the riparian area, and score the riparian conditions of the entire stream within a property boundary. Visually score the entire stream, if possible. If the stream is too extensive to score using SVAP2, score only the assessment reach visually, and use recent aerial photos (less than 2 years old) to score those riparian areas of the stream outside of the assessment reach.
Riparian area quantity: what to look for
• This element rates the extent of the riparian area
on the property (length × width). Estimate the width of the vegetation area from the edge of the active channel outward to where natural riparian vegetation ends and other land use/land cover begins.
• Vegetation gaps are lengths of streamside with
no natural vegetation ecologically suitable for the site and at a density and spacing uncharacteristic of the plant community being assessed. Estimate gap percentage by dividing the total length of gaps by the total length of the stream within the property boundary multiplied by 100.
• For this element, natural plant community means
one with species native to the site or introduced species that have become naturalized and func-tion similarly to native species of designated ref-erence sites, growing at densities characteristic of the site. Regional plant guidebooks are useful to have in the field for scoring this element.
• Compare the width of the riparian area to the
bankfull channel width. In steep, V-shaped valley forms, there may not be enough room for a flood plain riparian area to extend as far as one or two active channel widths. In this case, a score may be adjusted to a higher value based on reference site conditions.
Natural plant community extends at least two bank-full widths or more than the entire active flood plain and is generally contiguous throughout property
Natural plant com-munity extends at least one bankfull width or more than 1/2 to 2/3 of active flood plain and is generally contiguous throughout property
Natural plant com-munity extends at least 1/2 of the bank-full width or more than at least 1/2 of active flood plain
Natural plant com-munity extends at least 1/3 of the bank-full width or more than 1/4 of active flood plain
Natural plant commu-nity extends less than 1/3 of the bankfull width or less than 1/4 of active flood plain
Vegetation gaps do not exceed 10% of the estimated length of the stream on the property
Vegetation gaps do not exceed 30% of the estimated length of the stream on the property
Vegetation gaps exceed 30% of the estimated length of the stream on the property
Vegetation gaps exceed 30% of the estimated length of the stream on the property
Right bank 10 9 8 7 6 5 4 3 2 1 0 Left bank 10 9 8 7 6 5 4 3 2 1 0
Note: Score each bank separately. Scores should represent the entire stream riparian area within the property. Score for this element = left bank score plus right bank score divided by 2. If the score of one bank is 7 or greater and the score of the other bank is 4 or less, subtract 2 points from final score.