City, University of London Institutional Repository
Citation
:
McCurdy, N., Dykes, J. & Meyer, M. (2016). Action Design Research and
Visualization Design. In: Proceedings of the Sixth Workshop on Beyond Time and Errors on
Novel Evaluation Methods for Visualization. (pp. 10-18). New York, USA: ACM. ISBN
978-1-4503-4818-8
This is the accepted version of the paper.
This version of the publication may differ from the final published
version.
Permanent repository link:
http://openaccess.city.ac.uk/15270/
Link to published version
:
http://dx.doi.org/10.1145/2993901.2993916
Copyright and reuse:
City Research Online aims to make research
outputs of City, University of London available to a wider audience.
Copyright and Moral Rights remain with the author(s) and/or copyright
holders. URLs from City Research Online may be freely distributed and
linked to.
City Research Online:
http://openaccess.city.ac.uk/
[email protected]
Action Design Research and Visualization Design
Nina McCurdy
University of Utah
[email protected]
Jason Dykes
City University London
[email protected]
Miriah Meyer
University of Utah
[email protected]
ABSTRACT
In applied visualization research, artifacts are shaped by a series of small design decisions, many of which are evalu-ated quickly and informally via methods that often go unre-ported and unverified. Such design decisions are influenced not only by visualization theory, but also by the people and context of the research. While existing applied visualiza-tion models support a level of reliability throughout the de-sign process, they fail to explicitly account for the influence of the research context in shaping the resulting design arti-facts. In this work, we look to action design research (ADR) for insight into addressing this issue. In particular, ADR offers a framework along with a set of guiding principles for navigating and capitalizing on the disruptive, subjec-tive, human-centered nature of applied design work, while aiming to ensure reliability of the process and design. We explore the utility of ADR in increasing the reliability of applied visualization design research by: describing ADR in the language and constructs developed within the visualiza-tion community; comparing ADR to existing visualizavisualiza-tion methodologies; and analyzing a recent design study retro-spectively through the lens of ADR’s framework and princi-ples.
CCS Concepts
•Human-centered computing → Visualization the-ory, concepts and paradigms;
Keywords
Design study; applied visualization design research; action design research; concurrent evaluation
1.
INTRODUCTION
Throughout the visualization design process, artifacts are shaped by many design decisions, only some of which are for-mally validated. Many of these decisions are instead evalu-ated through quick, informal, and light-weight mechanisms,
Permission to make digital or hard copies of all or part of this work for personal or classroom use is granted without fee provided that copies are not made or distributed for profit or commercial advantage and that copies bear this notice and the full cita-tion on the first page. Copyrights for components of this work owned by others than ACM must be honored. Abstracting with credit is permitted. To copy otherwise, or re-publish, to post on servers or to redistribute to lists, requires prior specific permission and/or a fee. Request permissions from [email protected].
BELIV ’16 October 24, 2016, Baltimore, MD, USA
c
2016 ACM. ISBN –tbd–.
DOI:
--tbd--most of which are not reported or verified. Furthermore, in collaborative settings these design decisions are influenced not just by visualization theory and guidelines, but also by the people and context in which artifacts are designed.
Documented adherence to applied visualization process [16, 24] and decision [19, 21] models affords a level of reliability for the resulting artifacts. These models ground design de-cisions in established visualization principles and through the validation of artifacts within the application domain. They do not, however, explicitly address the more subjec-tive shaping of artifacts by the people and context involved in the project, a shaping that can at times ignore or even go against established visualization conventions. Nor do they explicate the role that deliberate disruption on the part of the visualization designer plays in the shaping of artifacts. Taken together, these gaps reveal important influencing fac-tors within the visualization design process for which there are not yet established guidelines for ensuring reliability of the resulting artifacts.
Within information systems research, a recently proposed methodology called action design research (ADR) offers a framework that aims to ensure the reliability of designed ar-tifacts through adherence to a set of principles [25]. Like visualization design research, ADR seeks to contribute de-sign knowledge by solving real-world problems, while sup-porting the messy, iterative, human-centered nature of the design process. ADR, however, explicitly incorporates ap-proaches from social science that acknowledge and facilitate the effects of people and context on the shaping of artifacts, and specifically those that occur when actions taken by the design researcher result in a disruption of the target users’ processes or understanding, and vice versa. This explicit incorporation of established social science methods, namely those fromaction research[6, 17], provides guidance for re-liably designing artifacts in a real-world context — precisely where gaps exist in current visualization models.
places in the visualization design process where this shap-ing can, and should, be captured and reported. Moreover, ADR provides scaffolding for better understanding the re-lationship of controlled, experimental,in vitroresearch and design-orientatedin vivoresearch within visualization.
2.
ACTION DESIGN RESEARCH
The ADR methodology consists of a set of guiding prin-ciples and a high-level process model. While ADR has been reported as a development methodology in visual analytics systems research [28], it has yet to be explored in light of applied visualization design methods. In the following sec-tion we discuss the development of the methodology within the information systems community, followed by an expli-cation of each of the principles and process stages. Each of these discussions includes an analysis of how ADR con-cepts reflect, apply to, or inform current visualization design research theory and practice.
2.1
Overview
Information systems research is driven by a dual mis-sion: to generate valuable information systems knowledge and to create effective solutions to real-world problems that inform an application’s domain [25]. Early process models to achieve this mission focus on incorporating both exper-imental and design methods, while emphasizing relevance through a grounding in real-world problems [13, 27]. Sein
[image:3.612.62.283.423.625.2]et al.[25] critique this approach for not recognizing or cap-turing the influence of people, organizations, and context on shaping technology throughout the design process. They argue further that appropriate forms of evaluation that con-sider such elements must be interwoven throughout the de-sign process.
Figure 1: An overview of the ADR methodology in-dicating the relationship of the stages to each other, as well as the guiding principles [25]. The deliberate omission of an arrow pointing from stage 1 to stage 2 may seem counterintuitive, but emphasizes the key role of reflection and learning: movement from stage 1 to stage 2 must occur via stage 3. Whereas stages 1 - 3 are iterative and cyclic, stage 4 is isolated and vis-ited only after the preceding stages are completed.
The action design research (ADR) methodology [25], shown in Figure 1, is an attempt to address these shortcomings. Specifically, ADR explicates the influence of the research environment as well as the roles and influences of members of the research team in and on the design process and the re-sulting technology artifact. ADR structures the design pro-cess around cycles of building, intervention, and evaluation that mirror the cycles of planned intervention and reflection used in action research. Action research embraces disrup-tion and acdisrup-tion on the part of the designer as a means to learn about a problem [6, 17] As a result, within the ADR methodology, the resulting artifact is considered an instan-tiation of the space, time, community, and process in which it is developed [22, 23], and termed theensemble artifact to reflect this quality.
Our own experience suggests that, whether consciously or not, many visualization designers learn through actions, using explicit methods like technology probes [7] and data sketches [12], or more implicit approaches such as abstrac-tion and visualizaabstrac-tion suggesabstrac-tions during interviews. Through-out the design process, visualization designers disrupt and influence both the target users and the problem context, while simultaneously being disrupted themselves. We sus-pect that adherence to the principles and process of ADR could increase the reliability of visualization design research by applying qualitative methods, such as those described in
grounded evaluation[8], and providing guidance for captur-ing important details around insightful disruptions.
2.2
ADR Principles
ADR’s seven guiding principles express the core values of the methodology and serve as a system of reminders to help ensure that research conducted by the ADR team — com-prising visualization researchers and domain practitioners — is reliable throughout. Principles associated with early stage research (P1, P2) stress the importance of ground-ing design in theory and real-world problems, whereas those associated with design development (P3,P4,P5) focus on the influences of members of the collaboration on each other and on the design, and on the need for continuous evalu-ation that takes such influences into account. Additional principles (P6,P7) emphasize the importance of acknowl-edging and responding to such influences throughout the design process, as well the importance of generating usable design knowledge from specific research outcomes. While some of these principles (P1,P2,P5,P7) reflect those ex-plicitly articulated in the visualization literature [1, 9, 16, 19, 21, 24, 26], several of these principles (P3, P4, P6) provide new and potentially valuable guidance around the validation of visualization design research.
P1: Practice-inspired Research.
The first principle emphasizes that applied research should be motivated and inspired by real-world problems. This no-tion is analogous to what the visualizano-tion community has termed problem-driven research. This approach helps to en-sure domain relevance and paves the way forin vivo evalu-ation — two core tenets of design studies [24].
P2: Theory-ingrained Artifact.
helping guide the design process. This principle serves the same purpose as thelearnstage in the design study method-ology [24], which emphasizes that researchers must learn the space of visualization possibilities in order to design effec-tively. Additionally, it relates to the nested model’s [21]
encoding and interaction threats, which stress that theory should inform decisions at all levels of the design, thereby ensuring that resulting artifacts are theory-ingrained. Visu-alization design studies frequently focus on the application of theory to inform and justify design.
P3: Reciprocal Shaping.
Principle 3 emphasizes the constant shifting and shaping of both the artifact and the design process by the differ-ent perspectives within the team. While this element of design research may feel familiar and perhaps obvious to members of the visualization community, few attempts have been made to account for this element in existing visual-ization methodology [12]. Acknowledging the occurrence of reciprocal shaping can increase reliability by: 1) providing an explicit opportunity to document impactful activities and insights throughout the design process; and 2) revealing op-portunities for structured approaches to ensure and support the effects of all people involved on the design process and resulting artifacts. We suspect that reciprocal shaping is more prevalent in applied visualization research than in in-formation systems research due to the deeply collaborative and highly iterative nature of visualization design and the influential nature of data-led discovery. Methods for en-suring and capturing reciprocal shaping within visualization remain underdeveloped, and are potentially of high-interest for the BELIV community.
P4: Mutually Influential Roles.
Principle 4 emphasizes the learning and cross-fertilization that occurs among ADR team members. Each member of the team brings a unique suite of knowledge, theory, and expertise. Through close collaboration the team members learn about each other’s expertise, sometimes offering valu-able insight into another member’s primary research domain. These insights can create substantial shifts in how another team member thinks about, or approaches, his or her re-search or domain, which within the visualization community is informally considered a sign of success for design studies. Beyond the citation of publications in an application do-main, or anecdotal stories [5, 14, 18], however, methods and mechanisms for reliably assessing and reflecting on mutual influence are underdeveloped.
P5: Authentic and Concurrent Evaluation.
Principle 5 stresses that evaluation should happen through-out the design process to both influence the process itself and inform design decisions. Importantly, this principle encour-ages researchers to prioritize authenticity when evaluating artifacts and their effects through methods that are ecolog-ically valid and conducted in-the-wild; this value is echoed in visualization design methodologies [16, 24, 26]. Authen-tic and reliable evaluation in the context ofP3and P4— which value and encourage the influence of all members of the team on the shaping of the artifact and even in devel-oping the insights achieved across domains — however, is at odds with controlled studies that aim to establish predic-tive models throughin vitroexperiments that seek to remove
subjectivity. Instead, ADR provides a means of achieving re-liability within a subjective context by articulating the role that people and context have on the design process itself. Furthermore, ADR, and visualization design research more generally, provide an environment for: 1) the evaluation of theresultsof controlled studies; and 2) a real-world scenario that may draw attention to the need for additional visual-ization research that may itself require controlled studies.
P6: Guided Emergence.
Principle 6 encourages researchers to be aware of and sen-sitive to the reciprocal shaping of theory-ingrained artifacts that happens throughout the design process: to nurture and incorporate the shaping into the design process, and to cap-ture and apply it toward generating new design principles. While design research should be guided in part by theory, re-searchers should also be open to incorporating insights that emerge from the research context, interactions, and evalua-tion. This principle can help ensure reliability of resulting artifacts by encouraging the explicit awareness, and docu-mentation, of the emergence itself, such as the evaluation of design decisions and the evidence used to develop them.
P7: Generalized Outcomes.
Principle 7, which recognizes the unique and highly spe-cialized outcomes of a design process, also emphasizes the importance of generalizing and abstracting research find-ings. This principle specifically encourages researchers to generalize the problem and the solution, as well as to de-rive design principles. The visualization community sub-scribes to a similar process of generalizing research findings for the purpose of broader application. Abstractions, prob-lem characterizations, and guidelines are examples of such generalizations [19, 21]. This principle, however, suggests that other kinds of learning, particularly surrounding the reciprocal shaping and mutually influential nature of the de-sign process, could also be formalized, benefitting the greater research community.
2.3
ADR Stages
ADR is a high-level framework that encompasses many of the details found in existing visualization process models and practices. Research begins with preliminary investiga-tion and articulainvestiga-tion of the problem, continues with a period of iterative and cyclic human-centered design and develop-ment, and ends with critical reflection and synthesis of re-search. ADR differs from visualization design methodologies in its focus on intervention as a critical element of the design process and its objective of learning through design. Equally important, however, is the actionable framework that ADR’s stages provide for adhering to and reflecting on the princi-ples discussed in Section 2.2 to underpin the design process in ways that aim to achieve reliability. Tight cycles of ac-tion and evaluaac-tion are core to this and, unlike the emphasis in models of visualization design, reflection is required and ongoing.
S1: Problem Formulation.
This stage also involves what ADR terms“casting the prob-lem as an instance of a class of probprob-lems”— similar to the initial problem characterization and abstraction of visualiza-tion design research. This stage emphasizes the principle of practice-inspired research (P1), stressing the importance of a real-world context for developing appropriate tasks as well as for establishing an ecologically valid context for valida-tion of artifacts. The principle of theory-ingrained artifact (P2) is also stressed in this stage, indicating the importance of a prepared mind for developing effective solutions.
S2: Building, Intervention, Evaluation.
The second stage of ADR is grounded in the core tenet of action research that an effective way to learn about some-thing is to try to change it [6]. In this stage, design re-searchers collaborate closely with domain practitioners, both to continue to develop and refine the problem space, as well as to design, develop, and refine the artifact. This is accom-plished via cycles of building, intervention, and evaluation (BIE). As these cycles progress, new interventions are de-signed based on the results from previous cycles, are evalu-ated in real time, and are used to inform subsequent cycles. Technology probes [7] are a common intervention instrument used within design study research. Our own experiences of conducting visualization design research suggest that BIE cycles occur frequently and at multiple scales, with overar-ching cycles exploring high-level questions, mid-level cycles exploring core concepts surrounding the data abstraction and design of a visualization artifact, and low-level rapid, iterative feedback and informal evaluation cycles through-out. In Section 4.2, we illustrate the multi-scale nature of BIE cycles and adapt the model proposed in Seinet al.[25]. The principles of reciprocal shaping (P3) and mutually influential roles (P4) emphasize the highly collaborative, messy, human-centered nature of BIE cycles, as well as the shifting nature of the problem being studied. These prin-ciples provide structure to incorporate these dynamic and unpredictable elements of applied research into the design process. This stage also emphasizes authentic and concur-rent evaluation (P5) as designers probe with technology to find out what works, and what their design ideas reveal. Evaluation needs to be quick, as well as concurrent with the build and intervene activities.
S3: Reflection & Learning.
The reflection and learning stage happens continuously and in parallel withS1 and S2. In this stage researchers are encouraged to reflect on: ongoing evaluation in order to guide the design process; how well the research process adheres to guiding principles and how to encourage deeper adherence; and potential, broader implications of the re-search. This stage may occur either momentarily or in longer stretches, and is often triggered by aninsight— a revelation, a moment of validation, or a design challenge — developed duringS1orS2. While this stage has similar objectives to thereflectstage in the nine-stage framework for design stud-ies [24], ADR is explicit about the repeated and central role of reflection throughout the design process. Reflection and learning is guided by one principle, guided emergence (P6), encouraging researchers to adhere toP2-5throughout the design process and to reflect critically on the impact of such principles on the design and on the greater contribution of their research.
S4: Formalization of Learning.
The final stage of ADR is the formalization of learning. This stage occurs once the BIE cycles are completed and builds on the reflection and learning conducted throughout the design process — casting the insights and artifacts to a broader class of problems and solutions. Stage 4 embraces the generalization of outcomes (P7), pushing visualization researchers to think more broadly about the scope of their contributions to provide guidance around generalizing and abstracting elements of the design process.
3.
COMPARISON TO VIS MODELS
As described in Section 2, ADR marks an evolution of thinking within the information systems community about the role of design in research, and specifically about how to make design research reliable and generalizable. The visual-ization community is engaged in a similar conversation, and has put forth a number of models for structuring the design process [24, 16] and validating design decisions [8, 19, 21]. In this section, we briefly discuss these models as they relate to ADR.
The nine-stage framework represents the first formalized process model and methodology for conducting design stud-ies [24]. The framework is organized into three phases: the first describing a set of activities that should occur before triggering a design study project, the second describing the core design activities in the production of visualization ar-tifacts, and the third describing analysis and reflection to move design insights toward generalizable knowledge. Eval-uation is stated as a concurrent step across the entire nine-stage framework, but its specific role or guidance on what types of evaluation are appropriate is not discussed in detail. The design activity framework (DAF) [16] was a response to some of the shortcomings of the nine-stage framework. Specifically, the DAF emphasizes evaluation as a primary component of each design activity within the design process while also offering guidance for appropriate evaluation meth-ods. The DAF also attempts to give a more flexible structure to the design process by supporting iterative, nested, and parallel design activities. In an effort to boost the action-ability of the framework, the DAF bridges between the steps designers take and the decisions they make by explicating the levels of the nested model [19, 21] that are considered in each design activity. The nested model describes four levels of decisions — problem characterization, data and task ab-straction, visual encodings and interactions, and algorithms — and the interconnected relationship of decisions with re-spect to validation. The artifacts produced as a result of these decisions are often considered to be the contributions made by a design study [24].
ADR encompasses both the latter two stages of the nine-stage framework as well as the entire DAF by describing the design process from a problem trigger through formalization of the knowledge acquired. Similar to the DAF, ADR has an explicit treatment of evaluation as an essential step that is repeatedly visited throughout all design activities. Unlike the DAF, however, ADR makes reflection a primary activity throughout the design process, extending the role of reflec-tion from that detailed in the nine-stage framework in a way that mirrors action research cycles.
the emphasis of the role of learning through planned actions as a primary driver of the design process. Second, the view that the development of an artifact is both a contributor to
andconsequence of the research process. Third, the framing of the design process in a manner that achieves reliability by incorporating established values from social science.
4.
APPLYING ADR TO POEMAGE
We now consider ADR in a visualization context by ap-plying it retrospectively to a recent design study [14]. This design study involved a two-year collaboration between vi-sualization researchers (two of the co-authors of this work) and poetry scholars, resulting in various artifacts, including: new views on visualization design in poetry scholarship, in-sights into the role of computers in this discipline, a series of guidelines that can be applied to visualization in human-istic domains, and a new visualization tool called Poemage. In what follows, we present and critique the design study by reframing it through the lens of ADR. We argue this refram-ing sheds new light on contributions of the design study and illustrates the applicability of ADR to visualization design research.
4.1
Problem Formulation
The Poemage design study was triggered by the poetry scholars’ interest in exploring the potential role of visualiza-tion in poetry scholarship, and in particular in the experi-ence of a close reading of a poem. Close reading involves the in-depth analysis of a poem and all its literary devices, and is central to the poetry scholars’ research. During the initial portion of the problem formulation stage, the visual-ization researchers conducted informal and semistructured interviews with the poetry scholars to learn about the close reading process [8]. From these interviews, the visualization researchers discovered that influencing close reading could happen in many different ways, and that there was no ex-plicit notion of data in this context.
From there the visualization researchers dug through text analysis literature to determine what types of literary de-vices — metaphor, imagery, affect, and sound to name a few — can be extracted from a poem. The goal was to find a device that was both robustly computableandinteresting to the poetry scholars. Eventually, the team narrowed in on sonic devices — a class of poetic device that utilizes sound and the relationships between sounds in words to effect the interpretation of a poem. Next, the team developed an ini-tial data abstraction; the data under consideration would be sets of sonically similar words within a poem. Additionally, the visualization researchers reviewed literature around text visualization, close reading, and digital humanities.
Adherence to P1 and P2.
The investigation in this stage was grounded in the poetry scholars’ interest in exploring the role of visualization in po-etry scholarship, which was continually revisited through the numerous discussions among the team members. The theory acquired within this stage came from various approaches to text analysis and visualization, and the values and method-ologies of digital humanities. In addition, learning around approaches to digital humanities scholarship inspired the vi-sualization researchers to pursue a highly experimental and exploratory approach to the design process, which was main-tained throughout the design study. As the problem
formu-lation stage was revisited later in the design study, the visu-alization researchers turned once again to visuvisu-alization the-ory, digging into specific visualization techniques that best supported the effective encoding of the evolving data ab-straction for the tasks at hand.
4.2
Building, Intervention, Evaluation
[image:6.612.319.559.426.543.2]During the BIE stage, the team developed a broad ar-ray of technology probes to understand three core questions: What sonic devices are interesting to the poetry scholars? What are the scholars interested in doing with the sonic de-vices? How can visualization support their exploration of the sonic devices? Overarching to these questions was the larger investigation into the role visualization could play in poetry scholarship. Sein et al.[25] describe small numbers of BIE cycles relating to beta and alpha prototypes of soft-ware systems in their examples of ADR. On reflection, our design study consisted of a series of BIE cycles that oc-curred at multiple scales: one high-level, overarching BIE cycle examining the role and impact of technology on po-etry scholarship; three mid-level cycles focusing on sound, visualization design, and the development of the Poemage tool; and many rapid, low-level cycles of iteration, expan-sion, and refinement each involving a planned and active intervention, evaluation of effect on the poetry scholars, and subsequent reflection to establish knowledge gained and to drive design decisions. Each scale warranted different types of evaluation, with the higher level scales incorporating more formal evaluation, and the lower level scales using quicker, lighter weight methods. These low-level BIE cycles are of particular interest for future investigations into reliability via documentation and recording of evaluation efforts. Fur-thermore, the different scales of BIE cycles may be partic-ularly important in visualization as it is so often driven by discovery.
Figure 2: Multi-scale BIE cycles: (a) high-level BIE cycle focusing on the role of technology in poetry scholarship, (b) mid-level BIE cycles focusing on sound, vis design, and the development of Poemage, (c) low-level cycles involving fast, informal feedback.
this is thecrucible of action — where the ADR team, de-sign, and data interact in an authentic setting, and where a plausible, theory-ingrained artifact is used by a practitioner to establish knowledge in both the application and visual-ization domains. Further development, and reflection and learning, result from evaluation of these planned actions. The bottom line corresponds to the deployment of the Po-emage tool to users beyond the team. Lamet al.[9] describe this as“deployment ... in the field,”which offers opportu-nities for summative evaluation, as is described in multi-dimensional in-depth long-term case studies (MILCs) [26]. In what follows, we outline the three mid-level BIE cycles that were core to the Poemage design study.
The first mid-level BIE cycle focused on sound and sonic devices. Via an informal survey followed by semistructured interviews, the visualization researchers worked with the po-etry scholars to determine which sonic devices would be most interesting to explore in the close reading of a poem. The identified sonic devices were translated to code within an interactive system that extracted sets of words in a poem that were related via the various devices. The visualiza-tion researchers used this software as a technology probe to test the selected devices, and to understand how the po-etry scholars might explore such devices within a poem. Evaluation of the technology probe ranged from casual feed-back to highly structured interviews. Insights from the ini-tial technology probe motivated the visualization experts to develop a language along with a formalism for specify-ing and analyzspecify-ing a broad range of sonic devices — all of which the poetry scholars blanketed under an extended def-inition of rhyme — within a poem. This language and for-malism was subsequently implemented in a system called RhymeDesign [15]. Evaluation for RhymeDesign was for-mal, including both case studies and a survey testing the expressivity of the RhymeDesign language against examples of interesting sonic devices collected from an extended net-work of poetry scholars.
The second mid-level BIE cycle focused on the design of visual representations. This cycle included explorations of different visual representations of the data abstraction as well as experimentation with different visualization and in-teraction techniques to support the exploratory tasks ob-served and identified in the previous BIE cycles. As the second BIE cycle progressed through a series of rapid, high-frequency interventions, the poetry scholars’ interest evolved from browsing through sets of words detected by the system to instead exploring the interaction between these sets across the space of the poem. This new focus inspired the team to revisit a metaphor relating sound in poetry to flow devel-oped previously by one of the poetry scholars, which in turn informed the visual notion of sonic topology. This cycle was guided by regular, rapid, and informal feedback from the poetry scholars on ideas and prototypes — sketches, screen captures, live demos, etc. — shared in person or remotely.
The third and final mid-level BIE cycle focused on the development of the Poemage visualization tool. During this cycle, valuable features, interactions, capabilities, and de-sign elements were extracted from previous BIE cycles and compiled into a multi-linked view system. Following an ini-tial beta-testing deployment period in which poetry scholars from an extended network were given several weeks to exper-iment with incorporating Poemage into their practices, the visualization researchers conducted contextual interviews and
case studies. In preparation for these focused evaluation ses-sions, the poetry scholars wrote experiential, qualitative nar-ratives about their experiences using Poemage, which they discussed during the interviews. Although this preparatory writing was not asked of the poetry scholars, they expressed that this was a natural and productive method of reflec-tion within their field, and an exercise they were inclined to complete regardless. In reflection, we note that insights like these could point to new forms of evaluation for others working in the digital humanities.
Adherence to P3, P4, and P5.
In reflecting on the BIE cycles, we found that reciprocal shaping (P3) often occurred during close collaboration be-tween the visualization researchers and poetry scholars, that evaluation (P5) occurred rapidly and informally during pe-riods of intervention, and that the cyclessupported mutual influence (P4) by creating a gradual decrease in separation between the knowledge states and the roles of the researchers and scholars.
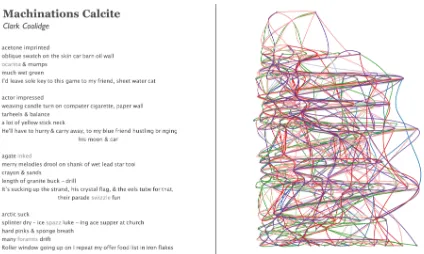
One specific example of reciprocal shaping occurred around the development of a particular feature in Poemage, which came to be known as the beautiful mess. The beautiful mess, shown in Figure 3, displays all the detected sets for a given poem, resulting in visual clutter and significant over-plotting. Although this feature was explicitly requested by the poetry scholars, it was met with a degree of resistance by the visualization researchers as it contravened visualization conventions that value clarity and readability [3]. The po-etry scholars argued, however, that the messiness resonated deeply with them as it captured the energy and excitement they felt during a close reading, as well as serving as a visual representation of the untangling task they confront with a new poem. Ultimately, the inclusion of the beautiful mess not only led to one of the more important insights of the work, but also helped to engage and gain the trust of the poetry scholars.
The reciprocal shaping of the beautiful mess contradicts the visualization theory brought to bear on the design pro-cess (P2). The design, however, worked for the poetry schol-ars, emphasizing the importance of reciprocal shaping and mutual influence. The beautiful mess was considered to be a strange anomaly of the design study, and precisely what to make of it remained unclear to the visualization researchers. An understanding of the notion of reciprocal shaping along with structured guidance to embrace and nurture this ele-ment of the design process and its contribution to design and knowledge acquisition, such as that provided by ADR, may have resulted in more features like the beautiful mess, and in more directed learning and evaluation around such features.
Figure 3: The beautiful mess feature of Poemage applied to Clark Coolidge’s“Machinations Calcite.”
Development of this feature exhibited elements of reciprocal shaping (P3) and guided emergence (P6).
humanities. On the other end of the collaboration, the vi-sualization researchers learned to embrace the poets’ broad and imprecise definition of rhyme and developed an open-ness to deviating from conventional visualization methods and principles. Additionally, the visualization researchers learned to incorporate a more extemporaneous element into their research — one that reflected the nature of their collab-orators’ poetry scholarship. Furthermore, revisiting a close reading of a particular poem, and the particular analysis that led to a new interpretation or insight, was a regular tac-tic used by the poetry scholars to illustrate a point. Thus the visualization researchers had to develop enough of an understanding of poetry, poetry analysis, and close reading in order to interpret the point being made, and translate it to the space of visualization research.
Lastly, authentic evaluation played an integral role in shap-ing the research and design process. Fast and informal feed-back guided the research team toward pursuing sonic de-vices and facilitated the design process. At various points throughout the first and second BIE cycles, the visualiza-tion researchers sat with the poetry scholars and iteratively tested and evaluated new features, interactions, and visual encodings. In addition, consistent feedback helped the vi-sualization researchers identify and build on elements of the research process that engaged the poetry scholars, increased their trust in the technology, and were disruptive in some interesting sort of way. In retrospect, recording and report-ing these kinds of findreport-ings in a more structured and perhaps comprehensive fashion, as ADR begins to facilitate, would have increased the reliability of the design process.
The evaluation strategies, particularly as they applied to interviewing techniques, evolved and shifted throughout the BIE cycles based on feedback and reflection. For exam-ple, the first round of interviews was highly structured, but it became clear that semistructured interviews were much more appropriate since the poetry scholars needed very lit-tle prompting and came to the interviews with valuable in-sights that would have been hard to elicit via preconceived questions. As another example, elements of poetry scholar-ship found their way into evaluation tactics. The primary example of this was the experiential, qualitative narratives written by the poetry scholars that were incorporated into the evaluation of Poemage. Thus, mutual influence and re-ciprocal shaping had an effect onevaluation as well as on design. This is not something that would be welcome in the kinds of isolated objective evaluation that lab studies
permit, but a reflective methodology such as ADR provides a means for such flexibility while providing reassurance re-garding reliability in applied work. Had this type of mutual influence and reciprocal shaping occurred earlier in the de-sign study, or had the team been following a methodology that explicitly encouraged this awareness and flexibility, the team may have sought and benefitted from more opportu-nities of this kind.
4.3
Reflection & Learning
Throughout the design process, the visualization researchers reflected in order to shift and shape the direction of the project, operationalize poorly defined tasks, and extract in-sights. For example, during the first BIE cycle it became clear that the poetry scholars embraced a broad and impre-cise definition of sonic similarity, motivating the visualiza-tion researchers to move beyond straightforward rhyme de-tection. The result was the development of a formalism for describing sonic similarity computationally, and the imple-mentation of the RhymeDesign tool. Another reflective mo-ment occurred when the visualization researchers observed a spectrum of ways in which the poetry scholars were using the Poemage tool, leading to a realization that one role of technology in poetry scholarship is for creativity support, as opposed to data analysis.
Adherence to P6.
Moments of guided emergence occurred throughout the design process. An illustration of this is the beautiful mess example described in section 4.2. The visualization researchers were guided by conventions surrounding clarity and read-ability, and initially resisted even experimenting with the feature. As the poetry scholars continued to push for the feature, however, one of the visualization researchers be-came more receptive. As mutual influence was established through validation of the technique, the other visualiza-tion researcher was eventually persuaded. In hindsight, this experience taught the visualization researchers to be more open to precisely the notion of guided emergence. At the time, the precise impact and takeaway of this anecdote re-mained unclear to the visualization researchers; however, the lesson was presented in the visualization publication about the Poemage design study as a kind of guideline that encour-aged others to adopt the same openness in their research.
P6directly confirms and articulates the importance of such experiences to the design process, and gives weight to any associated lessons and formulated guidelines.
4.4
Formalization of Learning
ap-propriate measures of success — and formalized them into open research questions for future work. While there was a desire to formalize learning surrounding the reciprocal shap-ing and the disruption that occurred throughout the design process, the lack of guidance and language for doing this in existing methods for visualization design left the visualiza-tion researchers with little confidence in such an endeavor.
Adherence to P7.
While the results of this research were highly specific and designed to meet the interests and needs of a very small group of poetry scholars, the visualization researchers gen-eralized elements of the process and design to various levels of abstraction. For example, the poetry scholars’ interest in exploring the role of technology in their scholarship prac-tices motivated some speculation about possible implications in the arts and in other fields that value novel interpreta-tions and creative thinking. At a much lower level, while Poemage was designed to support a very specific research activity — the close reading of American English free verse poetry — formalizing the data abstraction allowed the vi-sualization researchers to speculate about possible applica-tions to other set visualization problems. In retrospect, we wonder whether taking an ADR approach might have facili-tated framing these outcomes more effectively, consistently, and ultimately more reliably.
5.
DISCUSSION
In applied visualization research, visualization systems are often shaped by a series of small decisions made by design-ers and researchdesign-ers who have invested heavily throughout the design process. These decisions are typically made with established visualization principles in mind, and rely on fast, informal, and light-weight evaluation strategies. How to con-duct such evaluation in a manner that is reliable and that contributes to our knowledge of visualization as a methodol-ogy and to the domains in which we work is an open question within the visualization community.
In this work we look to information systems research for insight into conducting reliable, informed evaluation in set-tings that are applied and dynamic. In particular, we turn to action design research, which through adherence to a set of guiding principles offers a framework for reliably structuring and reporting on the design process in ways that can con-tribute to the acquisition of knowledge. ADR shares many commonalities with existing visualization design methodolo-gies, but deepens the theoretical underpinnings through its use of action research as a basis for design research. This foundation — adapted from an established method of en-quiry in social science, in which researchers directly influence the context they study through planned intervention — af-fords a new perspective on the forces that shape the nature of visualization design, and on the way we define reliability of research.
We describe the ADR principles and stages using visual-ization parlance, highlighting the similarities and overlaps with existing visualization theory and practice. However, we are also able to point out a number of places where ADR principles and stages are not reflected in visualization mod-els, indicating gaps that present reliability threats for visu-alization design research. Furthermore, applying ADR ret-rospectively to the Poemage design study revealed a number of highly significant moments and insights that we struggled
to articulate using existing models for conducting and re-porting visualization research. ADR provided structure and organization for analyzing the impact of the human-centered and disruptive elements on the process and design, as well as the impact of the collaboration on the learning that oc-curred in both domains — visualization and poetry. This learning has extended beyond the scope of the project and continues to influence research in both domains. While we are unable to draw conclusions around ADR’s utility as a guiding methodology through this retrospective application of the framework, doing so leads us to the hypothesis that incorporating elements of ADR into future design studies will enable better navigation and evaluation of the design process, as well as the facilitation of new kinds of learn-ing. Furthermore, while we acknowledge the plausible risk of confirmation bias associated with a retrospective appli-cation of ADR, our collective experience with Poemage and other past design studies is precisely what motivated us to seek the added guidance offered by ADR.
ADR emphasizes the differences between the methods used to frame controlledin vitroresearch and those applicable to design-oriented research where reciprocal shaping and mu-tual influence occurs. This contrast, however, also points to the synergy between subjective and objective research en-deavors: applied visualization contexts offer an environment to evaluate the results of controlled studies while simulta-neous providing inspiration for new research questions that could benefit from empirical experiments.
6.
FUTURE WORK
The emphasis on the use of design as a research tool is largely implicit in visualization research. Furthermore, the use of design as a deliberate means of disruption to observe effect is an exciting approach through which visualization researchers may beneficially engage with a broad range of application areas. In addition to these potential benefits, we see major implications as well as several open questions sur-rounding the application of ADR to visualization research.
First, ADR explicates the role of reciprocal shaping (P3), mutual influence (P4), and guided emergence (P6), none of which are captured explicitly in existing visualization mod-els. These principles stem from the application of action research, which could provide guidance for how to apply these principles in a structured, reliable way. Furthermore, visualization design research is in need of mechanisms for capturing and reporting on moments guided by these prin-ciples, and well as for reflecting on them to produce new visualization knowledge.
Second, the subjective nature of ADR questions the ap-plicability of P7 itself — what does it mean to general-ize results in the context of such a subjective, uncontrolled, and specific scenario? Others have suggested that for design studies, the goal is“transferability not reproducibility”[24], and we believe that the notion of transferability is also im-portant for ADR. How do we define reliable, transferable re-sults for visualization design research, and what mechanisms can we develop to support transferability? These questions are core components of what we believe to be interesting and exciting future work.
Acknowledgements
7.
REFERENCES
[1] K. Andrews. Evaluation comes in many guises. InAVI Workshop on BEyond time and errors (BELIV) Position Paper, pages 7–8, 2008.
[2] M. Brehmer, S. Ingram, J. Stray, and T. Munzner. Overview: The design, adoption, and analysis of a visual document mining tool for investigative journalists.IEEE Trans. Visualization and Computer Graphics (TVCG / Proc. InfoVis), 20(12):2271–2280, 2014.
[3] W. S. Cleveland. A model for studying display methods of statistical graphics.Journal of
Computational and Graphical Statistics, 2(4):323–343, 1993.
[4] K. Coles. Slippage, spillage, pillage, bliss: Close reading, uncertainty, and machines.Wester Humanities Review, pages 39–65, Fall 2014. [5] S. Goodwin, J. Dykes, S. Jones, I. Dillingham,
G. Dove, A. Duffy, A. Kachkaev, A. Slingsby, and J. Wood. Creative user-centered visualization design for energy analysts and modelers.Visualization and Computer Graphics, IEEE Transactions on, 19(12):2516–2525, 2013.
[6] G. R. Hayes. The relationship of action research to human-computer interaction.ACM Transactions on Computer-Human Interaction (TOCHI), 18(3):15, 2011.
[7] H. Hutchinson, W. Mackay, B. Westerlund, B. B. Bederson, A. Druin, C. Plaisant, M. Beaudouin-Lafon, S. Conversy, H. Evans, H. Hansen, et al. Technology probes: inspiring design for and with families. In
Proceedings of the SIGCHI conference on Human factors in computing systems, pages 17–24. ACM, 2003.
[8] P. Isenberg, T. Zuk, C. Collins, and S. Carpendale. Grounded evaluation of information visualizations. In
Proceedings of the 2008 Workshop on BEyond time and errors: novel evaLuation methods for Information Visualization, page 6. ACM, 2008.
[9] H. Lam, E. Bertini, P. Isenberg, C. Plaisant, and S. Carpendale. Seven guiding scenarios for information visualization evaluation. 2011.
[10] J. Lein. Sounding the surfaces: Computers, context, and poetic consequence.Wester Humanities Review, pages 84–109, Fall 2014.
[11] K. Lewin. Action research and minority problems.
Journal of social issues, 2(4):34–46, 1946.
[12] D. Lloyd and J. Dykes. Human-centered approaches in geovisualization design: Investigating multiple
methods through a long-term case study.IEEE Trans. Vis. Comp. Graphics, 17(12):2498–2507, 2011. [13] S. T. March and G. F. Smith. Design and natural
science research on information technology.Decision support systems, 15(4):251–266, 1995.
[14] N. McCurdy, J. Lein, K. Coles, and M. Meyer. Poemage: Visualizing the sonic topology of a poem.
Visualization and Computer Graphics, IEEE Transactions on, 22(1):439–448, 2016. [15] N. McCurdy, V. Srikumar, and M. Meyer.
Rhymedesign: A tool for analyzing sonic devices in poetry.Proceedings of Computational Linguistics for Literature, 2015.
[16] S. McKenna, D. C. Mazur, J. Agutter, and M. Meyer. Design activity framework for visualization design.
Visualization and Computer Graphics, IEEE Transactions on, 20(12):2191–2200, 2014.
[17] J. McNiff.Action research: Principles and practice. Routledge, 2013.
[18] M. Meyer, T. Munzner, and H. Pfister. Mizbee: a multiscale synteny browser.Visualization and Computer Graphics, IEEE Transactions on, 15(6):897–904, 2009.
[19] M. Meyer, M. Sedlmair, P. S. Quinan, and
T. Munzner. The nested blocks and guidelines model.
Information Visualization, page 1473871613510429, 2013.
[20] T. Munzner. Process and pitfalls in writing information visualization research papers. In
Information visualization, pages 134–153. Springer, 2008.
[21] T. Munzner. A nested model for visualization design and validation.Visualization and Computer Graphics, IEEE Transactions on, 15(6):921–928, 2009.
[22] W. J. Orlikowski and C. S. Iacono. Research commentary: Desperately seeking the “it” in it research—a call to theorizing the it artifact.
Information systems research, 12(2):121–134, 2001. [23] S. Purao, O. Henfridsson, M. Rossi, and M. Sein.
Ensemble artifacts: From viewing to designing in action design research.Systems, Signs & Actions, 7(1):73–81, 2013.
[24] M. Sedlmair, M. Meyer, and T. Munzner. Design study methodology: Reflections from the trenches and the stacks.Visualization and Computer Graphics, IEEE Transactions on, 18(12):2431–2440, 2012. [25] M. Sein, O. Henfridsson, S. Purao, M. Rossi, and
R. Lindgren. Action design research.MIS Qarterly, 35(1):37–56, 2011.
[26] B. Shneiderman and C. Plaisant. Strategies for evaluating information visualization tools:
multi-dimensional in-depth long-term case studies. In
Proceedings of the 2006 AVI workshop on BEyond time and errors: novel evaluation methods for information visualization, pages 1–7. ACM, 2006. [27] R. H. von Alan, S. T. March, J. Park, and S. Ram.
Design science in information systems research.MIS quarterly, 28(1):75–105, 2004.
![Figure 1: An overview of the ADR methodology in-dicating the relationship of the stages to each other,as well as the guiding principles [25]](https://thumb-us.123doks.com/thumbv2/123dok_us/1453890.98024/3.612.62.283.423.625/figure-overview-methodology-dicating-relationship-stages-guiding-principles.webp)