Copyright 0 1975 AmericanSociety for Microbiology Printed inU.S.A.
Studies
on
the
Budding Process
of
a
Temperature-Sensitive
Mutant of Murine Leukemia Virus with
a
Scanning
Electron
Microscope
P. K. Y. WONG* ANDRODERICK MAcLEOD
Department of Microbiology,SchoolofBasicMedicalScience,* Department of Genetics and Development, and CenterforElectronMicroscopy, University of Illinois, Urbana, Illinois61801
Receivedforpublication7April 1975
The scanning electronmicroscopewasusedtostudy the buddingprocessofthe wild-type Moloney murine leukemia virus and oneof itstemperature-sensitive
mutants, designatedts3.Aconsiderably largernumber of budding particleswas observed onTB cellsinfected withts3atthenonpermissivetemperature (39 C) than at the permissive temperature (34 C). No apparent difference was noted between the number ofparticles onts 3-infected cells at (34 C) and wild-type-infected cells at 34 or 39C. Virions were detected at the cell membrane ofts
3-infected cells at 39 C as early as 8 h postinfection. Virion density increased progressivelyupto48 hafter whichnoincreasewasobserved. Anaverageof 1,600 virus particles was observed at the cellsurface at thepeak of virus production. The distribution of these on the cell membrane appeared to be random. The maximum proportion of the cell surface occupied by the viral particles didnot
exceed 10%. After temperature shift from 39to34 C, approximately 90% ofthe particles had dissociated from the cell membrane within 1 h.
Ithas been established that the finalevents of
the replicative cycle ofmurine leukemia virus
(MuLV)aretheappearance at,andsubsequent release of viral
particles from,
the cell mem-brane. Detailsregarding the budding and matu-rationprocesses are as yet notwellestablished.The
assembly
and release ofviruses appear tobe rapid (3). Thetransmission electron micro-scope
(TEM)
allowsonly
asmallportionofthecell membrane to be examined in any single section;
therefore,
the scanning electron micro-scope (SEM) has been used toexaminelarger
areas of the cell surfaces. Detection of virus
particles at the cell surface, however, remains
difficult because of the rapid release of the
budding
virus.Recently, Wong
et al. (15)iso-lated several temperature-sensitive (ts) mu-tants of Moloney MuLV. One of these ts mu-tants, designatedts3, hasbeenshown to bud at
the cell surface but does not dissociate at 39 C
(the nonpermissive temperature for virus
re-lease) (14). This ts mutant, therefore, is an
excellent tool for studies onthe maturation of
MuLV at the plasma membrane of infected
monolayers.
We present in this paper preliminary SEM observations ofthe budding process of the ts 3 mutant virus. In addition, we include SEM
examinationsofthe
wild-type (wt)
MuLVvirusand ts 3 mutant at membranesofcellscultured at the permissive (34 C) and nonpermissive
temperature (39 C); the time sequence of the
buddingprocess; a determination of the number ofvirusparticles observedpercell;the
distribu-tion ofvirusparticlesatthe cellmembrane; the rate ofreleaseof virus fromthe cellsurface after temperature shift from 39 to 34
C;
and the maximumproportionofcellsurfacescoveredbyvirus particlesat the peak of virusproduction.
MATERIALS AND METHODS
Cell cultures. TB cells were obtained from J. K. Ball, who established the line from a culture of fetal thymus and bone marrow from CFW/D mice (4) using theprocedureofWrightetal.(16).Cloned linesofTB cells were growninEagle minimal essential medium containing 10% heat-inactivated fetal calf serum (Grand Island Biological Co., Grand Island, N.Y.); penicillin, 50 U/ml; and streptomycin, 50
Ag/ml.
These cells were grown inT-75 bottles (Falcon Plas-tics, Los Angeles, Calif.) at a seeding density of 5 x
101 cells in 20-ml complete medium per bottle. Cultureswereretrievedfromfrozen stocksasneeded, and werenotmaintained in excessof20 consecutive passages in orderto minimize thelikelihood of their spontaneousproductionofendogenous virus (1).
Control cultureswereroutinely testedforthe
pres-ence of leukemia virus using the modified XC test (15). XC cells (rat cells harboring a latent avian
434
on November 10, 2019 by guest
http://jvi.asm.org/
method forMuLV using XC cells described by Wong etal. (15) wasused.
Preparation of cell cultures for SEM and TEM examination. TB cells were infected with either wt or ts 3 mutant virus at a multiplicity of infection of approximately 2. Control and infected cells in suspen-sionwereseeded on glass cover slips (15-mm diame-ter)in33-mmFalcon plastic dishes and cultured at 34 or39C. At specified intervals, individual cover slips were removed from the culture dishes, washed three times with phosphate-buffered saline (pH 7.5) and fixed with 4% glutaraldehyde in phosphate-buffered saline for 1 h. After fixation, the cells were rinsed three times with phosphate-buffered saline and dehy-drated through a graded series of ethanols. Amyl acetateinethanol wasused as the transitional solvent before final dehydration at the critical point of liquid
CO2. The specimens were immediately mounted on
aluminum stubs with a conductive adhesive and coated withgold- (60%) palladium (40%) wire,
0.008-inch (ca. 0.02 cm) diameter, to an approximate thickness of20-nm in aDenton DV-503 FP vacuum
evaporator equipped with a gyratory stage. The sam-ples were examined in aJSM-U3 scanning electron microscope at an accelerating voltage of 25 kV with either 0 or 300 specimen tilt, (00 tilt was used to
obtainmicrographs for statistical analysis).
Toenable examinationofboth the upper and lower cellsurfaces, aconfluent monolayer ofinfected cells wasgrown at 39 Cinaculturebottle. The monolayer was fixed in 14%glutaraldehyde and a portionofthe cell sheet which, detached from the surface of the culturebottle,waspartially foldedonaspecimen stub andprocessedforSEM examination. Both surfacesof
themonolayercould thus beobserved.
The remainder of the same monolayer, still
at-tached to the cultureflask, was processed for TEM. Before the propylene oxide transition, the cell sheet was carefully peeled from the plastic surface and transferred to a glass vial and processed to epoxy embedment. The embedded cell sheetwasorientedso
that during microtomy, lateral and transverse
sec-tioning of the monolayer could be obtained. The sectionswere mountedonuncoated 300-meshcopper grids, and after staining in uranyl nitrate and lead
citrate, thegridswereexaminedinaJEM 100CTEM at anacceleratingvoltage of 60kV.
RESULTS
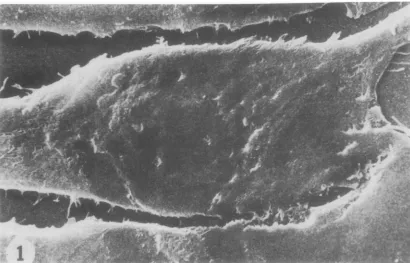
Morphology of normal TB cells. SEM
ex-amination ofTBcells inmonolayershowedthey they have a remarkably smooth surface in the
nondividing phase of growth (Fig. 1).They are
100 to 120 nm after correction for specimen
metal coating. Typical C-type particles ob-served withboth SEM and TEM areshown in inserts (a) and (b), Fig. 2B.
Wt virus-infected cells incubated both at 34 and 39 C for 48 h, showed a few randomly
scattered virus particlesat the cell surface(Fig.
2A). In addition, virus particles were also
ob-served in the intercellular spaces (Fig. 2B) indicatingthat virions had dissociated fromthe
cell surface and had adhered tothecoverslip.
A few virus particles were observed at the
surface ofts3-infected cells grown at34C (Fig.
3A),and therewas noapparentdifferenceinthe
number. or distribution of virus particles at
these cell surfaces from that observed on
wt-infected cellsateither34 or39 C. In contrast,ts
3-infected cells maintained at 39C for 48 h showed a substantially higher density of virus particles. For the most part, the virions were
distributed singly but occasionally, two, three,
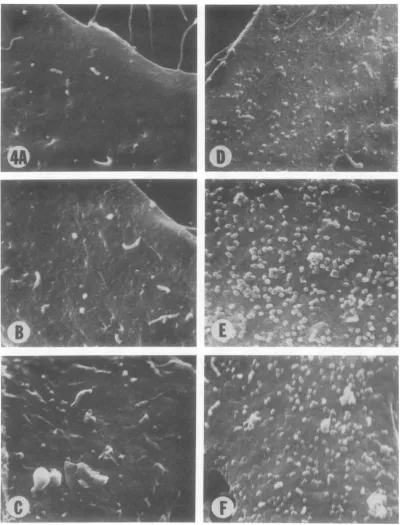
or more werejuxtaposed (Fig. 3B and insert). Time sequence of the budding process. Samples of ts 3-infected cells grown at 39 C wereprocessed atdifferent intervals after infec-tion and examined in the SEM to determine when budding could first be observed. Virus particles were first detected 8 h after infection (Fig. 4). Thetotal number ofvirus particles was observed to increase progressively, from 8 to 48 h after infection. No significant increase was
observed after incubation beyond 48 h.
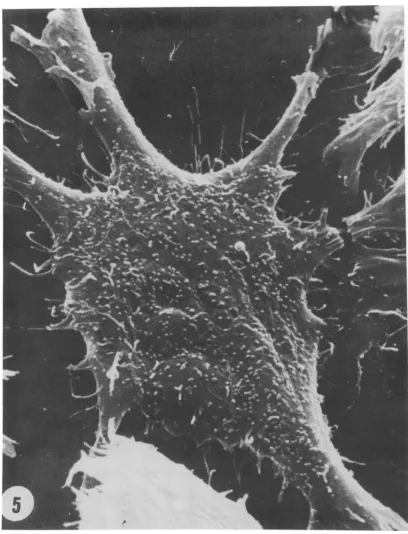
Number of virus particles observed per cell. A determination was made of the
max-imum numberof ts 3mutant virus particles on
a single cell, 48 h after infection at 39C, by analysis of micrographs of the entire upper
surfaces of numerous cells. The counts were
mademanually.
Approximately 1,000 virus particles were ob-servedat the upper surface of the cell shownin
Fig. 5. The virus particles, counted on several cells from the same and additional samples, ranged from 800 to 1,600per upper cell surface. This figure, however, does not represent the
total number of virus particlesbuddingfrom a
single cell. To determine the number of virus particles at the lower cell surface, a compact monolayerofinfected cells waspreparedsothat
on November 10, 2019 by guest
http://jvi.asm.org/
FIG. 1. Aportion of control TB cell monolayerfixed withglutaraldehyde, prepared by criticalpointdrying
technique, coated with gold, and viewed by SEM. Thereareveryfew microvillionthesmoothsurface of the cells. x5000.
both the upper and lower surfaces could be observed. Figure 6A shows the smooth upper cell surface with arepresentative virion concen-tration. In contrast, Fig. 6B shows that the lower cell surface has fewer virus particles. In
addition, filamentous structures, possibly
an-choring devices, were observed. Virus particles
present in atotal of 66 square unit areas (1 unit arearepresents2.25 x 106nm2)werecountedon
the upper and lower cell surfaces. The ratio of the number of particles observed at the upper as
compared to the lower cell surface was 1.75 ±
0.97.This difference wasstatistically significant (P < 0.05). Onthe basis of these calculationswe
estimated that there are approximately 1,600 virus particles on the cell shown in Fig. 5. Technical difficulties prevented an estimation
ofthe number ofparticles on the lateral surfaces ofthe infected cells.
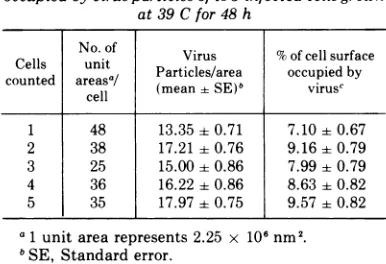
Distribution of virus particles on the cell membrane. The distribution of the budding viruses on the cell surf'ace was studied on several randomly selected ts 3-infected cells grownat 39C.Micrographsofthe uppersurface
ofeach cell, magnified x
10,000.
were obtained and a transparent overlay divided into unit squares (2.25 cm2) was superimposed on eachcell. Only those squares whichwere completely
occupied by cell surface were counted. The mean and standard error of the number of virus
particles per unit area are shown in Table 1.
From these data, we concluded that the virus
particles are randomlydistributed onthe main
bodyoftheuppercellsurface. Thepseudopodia
showed a lesser density ofvirus particles (Fig.
5).
Maximum proportion of cell surface occu-piedby virusparticles. Themaximum propor-tion of cell surface occupied by the budding
viruses was calculated by counting the virus
particles in unit areas of cells showing the highest density of virus. The total surface area occupied by the virus particles was calculated
as shown in Table 1. It was found that the maximum area occupied bythe virus particles did not exceed 10'7c ofthe total cell surface.
Rate of virus release from the cell surface after temperature shift from 39 to 34 C. To determine the rate ofrelease of ts 3 virionsfrom
the cell membrane, temperature-shift experi-ments were carried out by initially incubating the ts3-infected cells at 39 C for 48 h and then transferring the cultures to 34 C. At the time of
shift, and at 30-min intervals thereafter,
on November 10, 2019 by guest
http://jvi.asm.org/
[image:3.503.61.471.75.338.2]!3I4
FIG. 2. Portions of TB cell infected with wt MuLV at 39 C 48 h after infection. (A) A portion of the cell surface showing a fewrandomlyscattered viral particles. x10,000. (B) Wt virus particlesin theintercellular space. x30,000.Insert (a),SEM enlargement of one virus particle. x85000. Insert (b), TEM enlargement ofa
typical C-type particle. x85000.
FIG. 3. (A) A portion of a TB cell infected with ts 3 at 39 C 48 h after infection. x 10,000. Insert: enlargement of viral particlestoshow duplex, triplicates and aggregates.x20,000.(B) A portion of a TBcellinfected withts 3 at 34C48hafter infection.Note fewer virus particles. x 10,000.
on November 10, 2019 by guest
http://jvi.asm.org/
[image:4.503.38.451.60.576.2]FIG. 4. Portionsof ts3-infectedTB cellsincubatedat39Cfordifferenttime intervals after infection showing theprogressive increaseinnumberof viralparticlesatthecellsurface. x10,000. (A) Eighthourspostinfection; (B) 10hpostinfection;(C) 12hpostinfection; (D)24hpostinfection; (E)48hpostinfection;and(F)72h postin-fection.
on November 10, 2019 by guest
http://jvi.asm.org/
[image:5.503.64.466.72.597.2]5
-
_~~~~6oU~~~~~~r
_ eFIG. 5. Asingle TB cellinfectedwith ts3virus incubatedat 39C 48 hafterinfection showingthedensityand distribution of viral particles on the cell surface. Approximately 1,000particles were counted on this cell surface. x6000.
on November 10, 2019 by guest
http://jvi.asm.org/
[image:6.503.40.448.71.605.2]U
FIG. 6. (A) The smooth uppersurface ofa ts3-infectedTB cell incubatedat39Cwitharepresentativevirion concentration 48h afterinfection. x10,000. (B) The lower surface ofa ts3-infected TB cell from the same monolayerasshown inFig.6A.Notethe longfilamentousstructuresprobably anchoring devices. x10,000.
TABLE 1. Density and percentage of cell surfacearea
occupied byvirusparticles ofts3-infected cells grown
at39C for48h
No. of Virus % of cell surface
counted
conedaella
areasa/Particles/area
occupied
by(mean-+
SE)"
virusc1 48 13.3540.71 7.10±0.67
2 38 17.21 0.76 9.16 0.79
3 25 15.00 0.86 7.99 0.79
4 36 16.22 ±0.86 8.63±0.82 5 35 17.97±0.75 9.57±0.82 a1 unit arearepresents 2.25 x
106 nm2.
bSE, Standarderror.
cPercentageof areaoccupied byvirusparticleswas
computed asmean/cross sectional area of virus times number of viruses per unitarea/unit area. The mean cross sectional area of the virus, after correction for metal coating, was calculated to be (1.198 + 0.049 x 10⁴nm2).
ples were processed for SEM so as to determine the number of virus particles at the cell surface (Fig. 7). Thirty minutes after shift, approxi-mately 26%c of the virusparticles, as compared
to the concentration of virus particles before temperature shift, could still be observed. At 1 h after the temperature shift, only 14%c of the virus particles were detectable at the cell sur-face.These observations indicate that the
parti-cles were rapidly released from the cell mem-brane at the permissive temperature.
DISCUSSION
During the preparation of this report at least four papers have been publishedon SEM stud-ies of virus particles at cell membranes (7, 9,
10, 12). The importance and advantages of the SEM have been pointedout by these authors.
Several characteristics of our system offer unique advantages for studying the budding process of MuLV. (i) TB cells grown in mono-layers have smooth upper surfaces which
greatly facilitate virus observation. (ii) At the nonpermissive temperature (39 C), ts 3 mutant virusprotrudes through the cell membrane, but does not dissociate from it. This characteristic makes the identity of virus particles on the cell surface considerably less questionable. More-over, temperature-shift experiments allow ma-nipulation of the budding process. (iii) The noncytopathic relationship between MuLV and
TB-cells also eliminated problems that other investigators, studying cytocidal viruses, have encountered inidentifying virions at the surface
of rounded, moribund cells with extremely ir-regular surfaces.
The observations reported in this communi-cationclearly indicate that the particles seen at the cell membrane are viral particles. The
on November 10, 2019 by guest
http://jvi.asm.org/
[image:7.503.63.461.76.311.2] [image:7.503.63.256.371.503.2]FIG. 7. Portions of ts 3-infected TB cells incubated at39C for 48 h afterinfection showing the progressive decreasein numberofviralparticlesatthe cellsurfaceafter temperatureshift from 39to 34 C. x 10,000. (A)At
the timeof temperature shift. (B) Thirty minutes after temperatures shift. (C) One hour after temperature shift.
particles observed were of uniform shape and size and after correction for metal coating,
measuredapproximately 110 nm. Cells from the same culture flask processed for TEM studies
showed typical C-type particles. On cells in-fected with ts 3 at the nonpermissive tempera-ture (34 C), as could be expected, a
considera-bly larger number of budding particles was
observed thanon cells infected with ts 3 at the
permissive temperature (34C). The number of virus particles on ts 3-infected cells at 34 C is
comparable to that observed on cells infected
with wt at 34 or39C. The number ofbudding
virus particles increased up to a maximum
density at 48 h after infection. After tempera-ture shift from 39 to 34C, a rapid decrease in the number of virus particles was observed. Theseobservationsare in agreement with previ-ous studies with XC infectivity assays and TEM observations reported by Wong and
McCarter (14).
The minimum interval reported between ini-tial infection by Rous sarcoma virus and the
appearance of progeny virus was 8 h (2, 6). However, in the MuLV-murine sarcoma virus system Biswal et al. (5), using TEM particle counts,reportedthe appearance of extracellular virus noearlier than 12 h after infection. Salz-bergetal.(11)detected thepresence of extracel-lular virus at 14 to 15 h after infectionusing the reverse transcriptase assay. In the same publi-cation, Salzberg et al. also reported that intra-cellular viral RNA was detected 7 h after infection. The interval between completion of
synthesisofMuLV RNA and its appearance in
complete virions was determined
by
Bader (3)to be about 1 h. The earliest likelihood, there-fore, for detecting the virions budding at the
membrane couldbe expected at approximately
8 h postinfection. In our study, we detected virions at the cell membrane even slightly
earlier than 8 h postinf'ection. The SEM is therefore more sensitive in detecting small numbers of virus particles than conventional assay systems. In addition, the SEM has the
advantage over infectivity assays in enabling
on November 10, 2019 by guest
http://jvi.asm.org/
[image:8.503.41.451.75.370.2]442
detection of noninfectious virus particles. A comparison of an SEM particle count with the number of infectious unitsdetermined by other assaymethods is in progress.
Since we observed no increase inthe number of virus particles 48 h postinfection, and since
budding of the virus did not result in cell
cytopathogenesis in the MuLV-cell system, we therefore postulate that there may be a regula-tory mechanism which allows for the noncyto-cidal relationship between cell and virus. A clear understanding ofthe interaction between the virus and cells permitting this relationship to-exist iscurrentlylacking but warrantsfurther
investigation. We speculate that the maximum density of viral particles at the cell membranes in a noncytocidal system would not disrupt the transport functions ofthe cell membrane. The results of this study suggest that at least 90% of
the cell membrane remains available for these
functions.
The randomdistribution of viruses at the cell surface suggests that there are no specific sites on the cell membrane where virus assembly occurs. This latter observation is in agreement with that reported by Panem and Kirsten (10). Adetailed study of other aspects of the matura-tion process of ts 3 at the cell membrane is
currently inprogress.
Ourobservation that the
majority
ofthe virus particles have dissociated from the cellmem-brane within 1 h after a temperature shift from 39 to 34 C also agrees with Bader's ob-servation (3) that the interval between viral RNA synthesis and release ofcomplete virions is approximately 1 h.
We have demonstrated the effectiveness of using a ts mutant to study the phenomenon of
the budding process ofthe replicative cycle of MuLV. We anticipate that electronmicroscopy
together with biochemical and immunological studies of the temperature-sensitive defects of
ts 3 and other mutants should provide useful information regarding the events that occur during the replicative cycle of MuLV.
ACKNOWLEDGMENTS
We wish tothankBiruteJakstysfor helpfuldiscussion and
interest in this project. We also gratefully acknowledge
NormanPeters, Helen Sandberg, and LindaEmeryfortheir
experttechnical assistance.
This investigation was partially supported by Public
Health Serviceresearch grant CA-17695 from the National Cancer Institute.
LITERATURE CITED
1. Aaronson, S.A.,J. W.Hartley,and G. J.Todaro. 1969. Mouse leukemia virus: "spontaneous" release from
mouseembryocellsafterlongtermin vitrocultivation.
Proc. Natl.Acad.Sci.U.S.A. 64:87-94.
2. Bader, J. P. 1966. Metabolic requirements for infection by Roussarcomavirus. I. The transientrequirement for
DNAsynthesis. Virology 29:444-451.
3. Bader, J.P. 1970.Synthesisof theRNAof RNA-contain-ingtumor viruses. I. The interval betweensynthesis
andenvelopment. Virology 40:494-504.
4. Ball, J. K., T. Y. Huh, and J. A. McCarter. 1964. Onthe statistical distribution of epidermal papillomata in
mice. Brit. J.Cancer18:120-123.
5. Biswal, M., M. B. Grizzard, R. M. McCombe, andM. Benyesh-Melnick. 1968.Characterizationof
intracellu-larribonucleic acidspecific for the murine
sarcoma-leukemiaviruscomplex.J. Virol.2:1346-1352.
6. Hanafusa,H., and T. Hanafusa. 1966.Analysisof
defec-tiveness of Rous sarcoma virus. IV. Kinetics of RSV
production. Virology 38:369-378.
7. Holmes, K. V. 1975. Scanning electron microscopic studiesofvirus-infectedcells. I.Cytopathiceffectsand
maturation of vesicular stomatitis virus inL2cells.J.
Virol. 15:355-362.
8. Klement, V.,W.P. Rowe, J.W.Hartley,and W. E.Pugh.
1969. Mixedculture cytopathogenicity: anew testfor growth of murine leukemia viruses in tissue culture.
Proc. Natl.Acad. Sci.U.S.A.63:753-758.
9. Nemanic, M. K., D. P. Carter. D. R. Pitelka, andL.
Wofsy. 1975.Hapten-Sandwichlabeling. II.
Immuno-specificattachmentofcellsurface markerssuitablefor
scanning electron microscopy.J.CellBiol. 64:311-321. 10. Panem, S.,andW.H.Kirsten.1975.Secondaryscanning
electron microscopy of cells infected with murine
oncornaviruses. Virology63:447-458.
11. Salzberg, S., M.S.Robin, and M. Green. 1973.
Appear-ance ofvirus-specific RNA, virus particles, and cell surface changes in cells rapidly transformed by the murine sarcomavirus.Virology53:186-195.
12. Springer, E. L.,J. L.Riggs, andA. J.Hackett.1974. Viral identificationby scanning electron microscopyof prep-arationsstained withfluorescein-labeled antibody.J. Virol. 14:1623-1626.
13. Svoboda, J.,P. Chyle, D. Simkovic, andI.Hilgert. 1963.
Demonstrationofthe absenceofinfectiousRousvirus in rat tumorXC, whose structurallyintact cells
pro-duce Roussarcoma whentransferred tochicks. Folia
Biol. (Prague) 9:77-81.
14. Wong,P,K.Y., andJ. A.McCarter.1974.Studiesoftwo temperature-sensitive mutants ofMoloneymurine
leu-kemia virus.Virology58:396-408.
15. Wong, P. K. Y., L. J. Russ,and J. A. McCarter. 1973. Rapid,selectiveprocedureforisolation of spontaneous
temperature-sensitive mutants of Moloney leukemia virus.Virology 51:424-431.
16. Wright, B. S., P. A. O'Brien, G. P. Shibley, S. A. Mayyasi, and J. C. Lasfargues. 1967. Infection of an
established mouse bone marrow cell line (JLS-V9) with RauscherandMoloneymurineleukemiaviruses.
CancerRes.29:1672-1677.
J. VIROL.