17th International Conference on Applied Mechanics and
Mechanical Engineering. Military Technical College
Kobry El-Kobbah, Cairo, Egypt.
THE DEVELOPMENT OF STRESS BASED CONTINUUM DAMAGE
MECHANICS MODEL FOR PREDICTING THE FORMABILITY OF
MAGNESIUM ALLOYS UNDER COLD/WARM STAMPING
PROCESSES
M.S. Mohamed1, and P. Blackwell2
ABSTRACT
This paper presents the development and application of the novel 2D-stress based continuum damage mechanics (CDM) model for prediction of the formability of magnesium alloys under cold/warm stamping conditions. The CDM model is divided into parts; firstly, a set of uniaxial viscoplastic damage constitutive equations is determined from tensile data. Secondly, a set of multiaxial viscoplastic damage constitutive equations is formulated and calibrated from the forming limit diagram (FLD) data. The experimental uniaxial tensile data for AZ31B magnesium alloy (at different deformation conditions (temperature range of 20°C to 300°C and strain rate range of
0.001 and 0.01s-1) and FLD at the temperature of 250°C were published by Wang et
al., [1] and were used to formulate and calibrate the CDM model. A good agreement has been achieved between the experimental and numerical data. Using the newly developed plane-stress unified viscoplastic damage constitutive equations, the FLD of materials can be predicted at different temperatures and strain rates with complex strain path forming conditions.
KEY WORDS
Magnesium alloys, AZ31B, Formability, forming limit diagram (FLD), and continuum damage mechanics (CDM).
1 Research Fellow, Advanced Forming Research Centre, Strathclyde University,
Glasgow, UK. ([email protected]) and Assistant professor, Dept. of Mechanical Engineering, Faculty of Engineering, Helwan University, Egypt.
2 Engineering Director, Advanced Forming Research Centre, Strathclyde University,
INTRODUCTION
The use of lightweight materials such as aluminum and magnesium alloys, particularly for automotive applications has increased in the last 20 years. Due to their high strength/weight ratio, magnesium alloys are a preferred choice and replacements for aluminum and steel in many sheet metal parts [2]. Although magnesium alloys have many advantages compared with other metals, their wider application has been hindered partly due to their relatively low formability at room temperature, which results in some difficulties to manufacture complex-shaped components with magnesium alloys. At present, formed sheet magnesium components are not viable as formability is very low. At the microstructure level, this is due to the limited number of slip-systems in the Hexagonal-Close-Packed (HCP) crystal structure. Warm forming improves formability but the resulting production system is not competitive. The challenge is to develop a viable forming process for magnesium sheet.
The formability of sheet metal is a crucial measure of its ability for forming complex-shaped panel components and is often evaluated by the Forming Limit Diagram (FLD). This diagram can be used to determine the limit to which a sheet metal can be deformed before its failure in particular forming processes. A FLD shows the critical combinations of major and minor strains in a metal sheet at the onset of necking and provides information for a process engineer to optimize process conditions such as material condition, tool features and lubrication. The concept of FLC was introduced by Keeler [3] and Goodwin [4], who developed a principle to establish the relationship
between the surface principal strains, ε1 and ε2, at fracture. The relationship is
presented as the forming limit curve and if the orthogonal principal strain set, at all positions in a deforming sheet, lies below it a sound product will result and if above, failure will occur. Several factors affect the FLD including sheet thickness [5], temperature [6], strain rate and grain size [7] and strain hardening exponent [8].
In a warm stamping process, the metal sheet is normally warm and the tool is relatively cool. Temperature and strain rate are changed dynamically with both time and location in the sheet metal. It is well known that the formability of a metal sheet depends on the strain rate and temperature at elevated temperatures. Thus current FLDs, which have been established for constant temperature and strain rate, cannot be used directly to predict the forming limit of sheet metal in warm stamping. The stress-based continuum damage mechanics (CDM) theory has been developed to predict the damage process and failure of materials in various metal forming processes by Lin et al. [9]. In this damage model, expression of the three unvarying functions of the stress allows the representation of two different damage mechanisms: grain boundary damage and ductility damage. However, most industrial manufacturers use the conventional FLD method to predict failure, which depends on the combination of major and minor surface strains in a metal sheet. Wang et al. [1] have studied the formability of AZ31B magnesium alloy sheet by investigating the flow behavior by uniaxial tensile tests (Figure 1a and 1b) and stamping formability by forming limit tests (Figure 2).
FORMULATION AND CALIBRATION OF CDM MODEL
2D-CDM Based Unified Constitutive Equations
Uniaxial viscoplastic damage constitutive equations
Viscoplastic constitutive equations have been developed for many engineering materials, and have been used to model a wide range of time dependent phenomena, such as strain rate effect, creep, recrystallization, recovery, etc., [10, 11].
Viscoplastic constitutive equations have been developed by many researchers for many engineering materials, and have been used to model a wide range of time dependent phenomena, such as strain rate effect, creep, recrystallization, recovery, etc. In those equations, hardening of a material during viscoplastic deformation is modelled according to the accumulation of plastic strain [10]. Based on previous work, a new set of unified viscoplastic damage constitutive equations has been formed as follows:
(
−
)
− −
=
&
1
n
p
1
R k
K
σ
ω
ε
(1)
.
.
0 5R 0 5B
&
=
ρ ρ
−&
(2)(
)
n2P
A 1
C
ρ
&
=
−
ρ ε
&
−
ρ
(3)(
)
( )
2 3
1 p
1
η η
η
ω ε
ω
= −
& & (4)
(
1
)(
P)
E
σ
=
−
ω ε ε
−
(5)Equation (1) models the viscoplastic strain rate, ε&p , of the material. In the early stage
of deformation, the material hardening rate (Equation (2)) is mainly a result of
increasing the dislocation density, the rate of which,ρ&, is given in Equation (3) and
detailed in the next paragraph. At the late stage of deformation, softening due to micro-damage dominates and decreases the flow stress of the material.
The evolution of material hardening,R , is given by Equation (2), which is a function of
the normalised dislocation density, defined byρ =(ρ ρ− i) /ρm, where ρi is the
dislocation density for the virgin material (the initial state), and ρm is the maximum
(saturated) dislocation density that the material could have. Thus ρ varies from ρi to
m
ρ . This results in the range of variation of normalized dislocation density,
ρ
, being;speed, it is assumed that when the damage level reaches 0.7, failure occurrs in the material [11]. According to the feature of the damage model, the strain increment in stress-strain curves, as damage increases from 0.7 to 1.0, is little and can be omitted.
In Equation (1), K, k and n1are the material strength constant, initial yield stress and
reciprocal of strain rate sensitivity, respectively. B is the material work hardening
constant in Equation (2). In Equation (3), C is the static recovery constant, A is the
dynamic recovery constant and n2 material constant. η1,η2 are damage parameters in
equation (4). E is Young modulus in Equation (5). The parametersη3, n2 are material
constants (temperature independent) and the parametersK, k, B, A, C, η1, η2 and
1
n are temperature dependent parameters and are formulated as shown in the
following equations.
.exp( / )
1 2
K =K K T
.( / )k 2
1
k =k 1 T +k 3
.exp( / ) .exp( / )
1 2 3 4
B=B B T +B B T
.exp( / )
1 2
C=C C T
.exp( / ) .exp( / )
1 2 3 4
E=E E T +E E T
(6)
.( / ) 12
1 11 1 T 13
η
η =η +η
.( / ) 22
2 21 1 T 23
η
η =η +η
.( / )A2
1 3
A= A 1 T +A
.( / )n12
1 11 13
n =n 1 T +n
The uniaxial viscoplastic damage constitutive equations are calibrated using the experimental stress strain curves shown in Fig.1 and 2. These constitutive equations consist of a set of non-linear ordinary differential equations (ODEs). They cannot be solved analytically. Here a numerical integration method is used to solve the equations using Matlab code.
The first stage of the calibration process is to calibrate the 1D viscoplastic damage model only and determine the set of the material constants for AA6082 using uniaxial tensile data. In this step the equations (1-6) are solved numerically (i.e. to determine a set of values for the material constants) at different strain rates and different deformation temperatures.
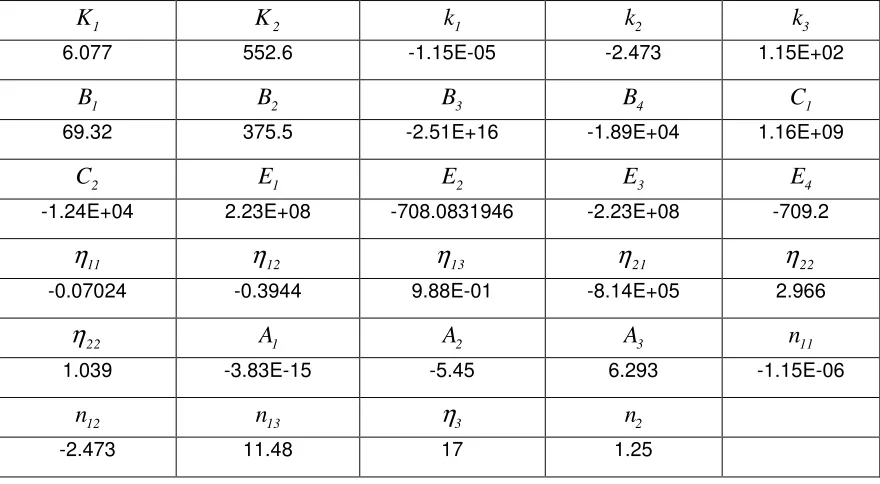
Table 1. Material constants of uniaxial viscoplastic damage model for AZ31B magnesium alloy at cold/warm forming condition.
1
K K2 k1 k2 k3
6.077 552.6 -1.15E-05 -2.473 1.15E+02
1
B B2 B3 B4 C1
69.32 375.5 -2.51E+16 -1.89E+04 1.16E+09
2
C E1 E2 E3 E4
-1.24E+04 2.23E+08 -708.0831946 -2.23E+08 -709.2
11
η η12 η13 η21 η22
-0.07024 -0.3944 9.88E-01 -8.14E+05 2.966
22
η A1 A2 A3 n11
1.039 -3.83E-15 -5.45 6.293 -1.15E-06
12
n n13 η3 n2
-2.473 11.48 17 1.25
Multiaxial constitutive equations
The general multi-axial power-law viscoplastic equations can be obtained by
consideration of a dissipation potential function. With an initial yield stress, k , and
ignoring the work hardening and other state variables, an energy dissipation potential can be in the form of [10,11]:
(7)
where
σ
e =(
3S Sij ij / 2)
1/ 2 is effective stress, Sij =σij−δ σij kk / 3 is the deviatoric stresstensor, σijis the stress tensor and δij is the Kronecker delta,K and n are material
constants. Assuming normality and the associated flow rule, the multiaxial relationship is given by:
3 2
n p
ij ij e
ij e
d S k
dt S K
ε
ψ
σ
σ
−
∂
= =
∂ (8)
where
ε
ijp is the plastic strain tensor. By the introduction of isotropic hardening (R) anddamage state variables (
ω
), the effective plastic strain rate, pe
ε& :
(
−
)
− −
=
&
n P e1
R k
K
σ
ω
ε
(9)The set of multi-axial viscoplastic constitutive equations, incorporating multiaxial damage evolution, may be written as:
(10)
(11)
(12)
ߪ = ሺ1 − ߱ሻܦ൫ߝ− ߝ൯ (13)
(
)
(
)
( )
2 3
1 1 2 3 1
1 2 3
3 . 1 + + ∆ = + + −
& H e &P
e e
ϕ
η
ϕ η
α σ
α σ
α σ
η
ω
ε
σ
α
α
α
ω
(14)
where ܦ is the elastic matrix of the material. The multiaxial damage equation (14)
comes from the uniaxial form with consideration of the multiaxial stress-state effect.
The parameters
α
1, α2 and α3 are used to calibrate the effect of maximum principalstress, hydrostatic stress and effective stress on damage evolution, respectively. If
α
1or α2 or α3 is zero, the implication is that the corresponding stress has no contribution
to the damage process of the material for sheet metal forming conditions. The symbol
ϕ represents a parameter, which controls the effect of multi-axial stress values and
their combination on damage evolution, thus determining formability. The parameter
∆ is for a correction factor representing tensile data obtained from uniaxial tensile
tests, or as suggested by Marciniak, et al.[12] and Nakazima, et al.[13] , formability tests, for which different strain measurement methods are normally used [9,14]. The CDM model calibration has been achieved and presented in details in Mohamed et
al.[14]. At uniaxial stress state, ߪ = ߪଵ and ߪு= ߪଵ/3. By substituting this condition
at Equation (14) and at ∆= 1, Equation 14) will be converted to Equation (4).
The second stage of the calibration process of the CDM model (Equations, 9-14) is the
determination of the multiaxial damage constants ∆,
α
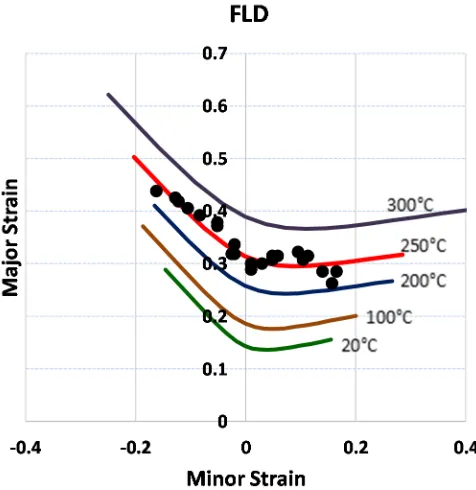
1, α2, α3and ϕin Equation (14).In this application, the FLC data at temperature 250°C and strain rate 0.01S-1 for
AZ31B published by Wang et al., [1] was used. Figure 6 shows the fitting results for the computed (solid curve) and the experimental FLCs (symbols). Good agreement between the computed and experimental data is obtained. In this case, the determined
value of ∆ is 0.6. Using the material constants at different temperatures (Table 1), the
CDM model can predict the FLD at different temperatures by an offset method.
CONCLUSIONS
In this paper, a stress-based continuum damage mechanics model has been applied for predicting the formability of magnesium alloys AZ31B under warm forming condition. The damage evolution is based on the stress values. The model is calibrated firstly using data from isothermal warm tensile tests for different temperatures and strain rates. It provides a good fit to the experimental flow stress strain relations. As an example, the prediction of FLCs from the determined CDM equations agrees well with the experimental FLC data of AZ31B at the temperature of 250°C. This method
3 2 ij p p ij e e S
ε
ε
σ
= & & 0.5 0.5R& = Bρ− ρ&
(
)
n2p
A 1 C
can be adopted for other alloys. Current investigation shows that for AZ31B, strain rate has little effect at room temperature. As the temperature increases, the effects of strain rate on tensile properties and FLC position become more prominent. Higher forming speeds lead to higher strength because of strain hardening and result in lower formability. On the other hand, higher temperatures lead to low strength but higher failure strain and forming limit strain. The CDM model can predict the FLD at different temperatures by offset method.
REFERENCES
[1] W. Wang, L. Huang, K. Tao, S. Chen, X. Wei, ”Formability and numerical
simulation of AZ31B magnesium alloy sheet in warm stamping process, Materials & Design, Vol. 87, pp. 835-844 (2015).
[2] T. Al-Samman, G. Gottstein, “Room temperature formability of a magnesium
AZ31 alloy: examining the role of texture on the deformation mechanisms“, Mater. Sci. Eng. A 488, pp. 406–414(2008).
[3] P.S Keeler “Determination of forming limits in automotive stampings, Sheet
Met. Ind., Vol. 42 pp.683–691 (1965).
[4] M.G. Goodwin, “Application of strain analysis to sheet metal forming
problems in the press shop“, Metall. Italiana, Vol. 60, pp764–74 (1968).
[5] H. Fatmaoui R. Mesrar, J. Chaoufi, ”Intrinsic diagram of sheet metal forming
limits for arbitrary strain paths”, J. of Materials: Design and applications,
Vol. 222, No.4, pp. 223-229 (2008).
[6] F. Djavanroodi, A. Derogar, “Experimental and numerical evaluation of
forming limit diagram for Ti6Al4V titanium and Al6061-T6 aluminum alloys
sheets”, Mater. Des. Vol. 31, pp. 4866-4875 (2010).
[7] A. M. Kröhn, B. S. Leen , H. T. Hyde, ”A superplastic forming limit diagram
concept for Ti-6Al-4V”, J. of Materials: Design and Applications, Vol. 221,
No. 4, pp. 251-264 (2007).
[8] G. Palumbo, D. Sorgente, L. Tricarico, ”A numerical and experimental
investigation of AZ31 formability at elevated temperatures using a constant strain rate test”, Mater. Des., Vol. 31, pp. 1308-1316(2010).
[9] J. Lin, M. Mohamed, D. Balint, T. A, Dean, ”The development of continuum
damage mechanics-based theories for predicting forming limit diagrams for
hot stamping applications”, Int. J. of Damage Mechanics, vol. 23, No. 5, pp.
684-701 (2014).
[10] J. Lin, T. A. Dean, “A set of unified constitutive equations for modelling
microstructure evolution in hot deformation”, J. Mater. Process Tech., 167 (2-3), pp. 354-362 (2005).
[11] M.S. Mohamed, A. D. Foster, J. Lin, D. Balint, T. A. Dean., ”Investigation of
deformation and failure features in hot stamping of AA6082: Experimentation
and modelling”, Int. J. Mach. Tools Manuf., Vol. 53, pp. 27–38(2012).
[12] Z. Marciniak, K. Kuczynski., T. Pokora, ”Influence of the plastic properties of
a material on the forming limit diagram for sheet metal in tension”, Int. J. Mech. Sci., Vol. 15, pp. 789–805(1973).
[13] K. Nakazima, T. Kikuma, K. Asaku,”Study on the formability of steel sheet”,
[14] M. Mohamed, J. Lin, A. Foster, T. A. Dean, ”A New Test Design for
Assessing Formability of Materials in Hot Stamping”, Procedia Engineering,
Vol. 81, pp.1689-1694 (2014).
Figures
Fig. 1. Experimental stress strain curves at different temperatures and a strain rate of
[image:8.595.114.479.485.681.2]0.01s-1 (Wang et al.)[1].
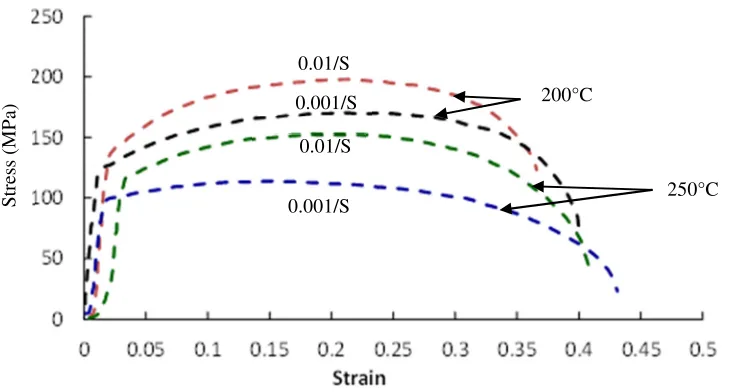
Fig. 2. Experimental stress strain curves at different strain rates and temperatures 200°C and 250°C (Wang et al.)[1].
S
tr
es
s
(M
P
a)
20°C
200°C
250°C
300°C
250°C 200°C
0.01/S
0.001/S
0.01/S
0.001/S
S
tr
es
s
(M
P
Fig. 3. Comparison of experimental (dashed lines) and computed (solid lines) stress
[image:9.595.119.480.301.475.2]strain curves at different temperatures and a strain rate of 0.01s-1 .
Fig.4. Comparison of experimental (dashed lines) and computed (solid lines) stress strain curves at different strain rates and temperatures of 200°C and 250°C.
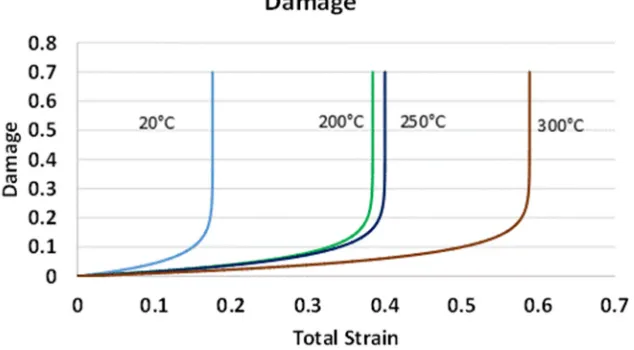
Fig. 5. Comparison of damage curves at different temperatures and
a strain rate of 0.01s-1.
C
C
[image:9.595.142.459.531.706.2]