Strategy Management through Quantitative Modelling of
Performance Measurement Systems
U. S. Bititci, P. Suwignjo and A. S. Carrie
Centre for Strategic Manufacturing University of Strathclyde, Glasgow, UK
Tel: 44-141 548 2015, Fax: 44-141 552 0557, e-mail: [email protected]
Abstract
This paper is based on previous works on performance measurement and on quantification of relationships between factors which affect performance. It demonstrates how tools and techniques developed can be used to evaluate the performance of alternative strategic choices through a quantitative approach to modelling of performance measurement systems. The paper provides a brief background to the research problem and preceding works. The tools and techniques used are briefly introduced. Use of these tools and techniques to evaluate the performance of alternative manufacturing strategies is demonstrated. Finally, the capability of the approach to deal with dynamic environments is demonstrated using sensitivity analysis.
Keywords: AHP, Performance Measurement, Prioritisation of Performance Measures, Dynamics of Performance Measures, Resources Allocation.
1. Introduction
The nature of competition has changed dramatically over the last two decades. Quality, speed, and flexibility, in addition to cost, have emerged as the three most important competitive attributes [1, 2, 3, 4]. This has made the traditional financially-based performance measurement systems less relevant. Over recent years much work has been done by practitioners and researchers to develop new performance measurement systems which try to take account of financial and non-financial measures in balance [5, 6, 7, 8]. Extensive, continuing research is also carried out at the Centre for Strategic Manufacturing (CSM), University of Strathclyde to develop a reference model for a robust and integrated performance measurement system. This research resulted in the development of a Reference Model and an Audit Method to assess the robustness and integrity of performance measurement systems used within manufacturing industries [9]. Audits carried out in over 30 organisations using this reference model revealed that the relationships between various performance measures in a system are not understood.
This new line of enquiry resulted with the development of an approach which facilitates the development of Quantitative Models for Performance Measurement Systems (QMPMS) [10].
The work presented in this paper demonstrates how the QMPMS approach could be adopted to evaluate the performance and sensitivity of alternative strategic choices. Firstly, the paper presents a brief summary of the QMPMS approach, then the use of the model to evaluate the performance of alternative manufacturing strategies is demonstrated. Finally the paper concludes with a detailed discussion on the experiences and lessons learned by the researchers.
2. Quantitative Model for Performance Measurement System (QMPMS)
The objective of the research adopted under the heading of QMPMS was to identify tools and techniques that would facilitate:
• identification of factors affecting performance
• identification of the relationship between factors affecting performance
• quantification of these relationships on one another, and on the overall performance of the business
• “what if” analysis on business performance and strategy selection
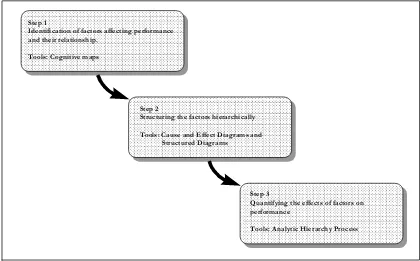
The three steps of the approach were developed as a result of the QMPMS project as depicted in Figure 1. The details of this approach have been explained and discussed in some detail in a previous publication [10].
Step 1
Identification of factors affecting performance and their relationship.
Tools: Cognitive maps
Step 2
Structuring the factors hierarchically
Tools: Cause and Effect Diagrams and Structured Diagrams
Step 3
Quantifying the effects of factors on performance
[image:2.595.106.526.392.653.2]Tools: Analytic Hierarchy Process
Figure 1. The framework of the QMPMS approach.
In general, the QMPMS approach classifies the relationships between factors which affect performance as follows:
• direct (vertical) effect
• indirect (horizontal) effect
Stage one of the QMPMS approach uses the Cognitive Mapping technique to identify factors which affect performance and their relationship with one another.
In stage two the Cognitive Maps are converted into a more formalised structure. Initially, Cause and Effect Diagrams are used as a discussion tool to structure the factors which affect performance hierarchically. Structure Diagrams are then used to formalise the hierarchical nature of the performance measurements system. Traditional structure diagrams only model the direct (vertical) relationships. However, a modified version of the structured diagrams, as used by the QMPMS approach, model also the indirect (horizontal) and self-interaction relationships between factors which affect performance.
Finally, in stage three the Analytical Hierarchy technique is used to quantify the relationship of each factor with the others with respect to overall performance.
3. Evaluating the Performance of Alternative Manufacturing Strategies
Manufacturing strategy adopted by companies has a great impact on their internal environment. Different manufacturing strategy requires different competitive capabilities [11, 12, 13]. To build particular competitive capabilities as required by the adopted manufacturing strategy, companies must employ specific types of machines, tooling, layout, human resources, information flows, systems, procedures, and technology. The configuration of those entities determines the generic performance of the manufacturing system: cost, quality, delivery, and flexibility. Evaluation of the alternative manufacturing strategies requires that the performance of the strategies on cost, quality, delivery, and flexibility can be quantified and aggregated. This is not a straightforward task, since cost, quality, delivery, and flexibility are measured in different dimensions. Cost is measured in pounds, quality may be measured in parts per million of critical defects, delivery may be measured by % orders delivered on time, and flexibility may be measured in terms of time, volume or cost.
As the operating environment of a firm changes rapidly, the selection of manufacturing strategy to be adopted is becoming more difficult. A manufacturing strategy, which is successfully being employed today, cannot be guaranteed to deliver the same results over the next two years. Consequently, the evaluation of alternative manufacturing strategies must take into account the dynamics of the external and internal environments.
It is the hypothesis of the work presented in this paper that the QMPMS approach could be an effective tool for evaluating the effectiveness and sensitivity of alternative manufacturing strategies.
For example, suppose an engineering company wants to expand its business by introducing a new product line and also wants to construct a new factory to produce the new product line. As the characteristics of the new factory will be influenced by the manufacturing strategy adopted, an analytical evaluation must be carried out to decide what kind of manufacturing strategy should be adopted. This analysis could be carried out using the QMPMS framework.
adopt ‘Mass Customiser’ strategy. These two strategies require different competitive characteristics as illustrated in Table 1 below.
Innovator
1. consistent quality
2. rapid product design change 3. improved product performance 4. dependable/reliable delivery
Mass Customiser
1. dependable delivery 2. short delivery lead-time 3. consistent quality 4. product performance
Table 1. Competitive characteristics of two alternative manufacturing strategies
The differences between the two groups lie in the elements of the characteristics and their relative positions in the group (ranking). The Innovator strategy primarily stresses quality and ability to change product designs rapidly. To have the ability to accommodate rapid product design changes, the manufacturing system must be able to shift from one type of product to another very quickly. In other words, the manufacturing system should be flexible. The next two competitive capabilities of the Innovator strategy are improved product performance and dependable delivery. Referring to the generic performance of a manufacturing system mentioned earlier, the Innovator must be excellent in quality, flexibility and delivery. Although it is necessary to control cost, it is not the principal characteristic for competitiveness.
The Mass Customiser strategy prioritises dependable delivery and short-delivery lead-times. Both these competitive capabilities relate to delivery in the generic performance of a manufacturing system. The next two competitive characteristics are consistent quality and product performance. The ability of the Mass Customiser to win competition is affected much more by performance in delivery and quality rather than performance in flexibility and cost.
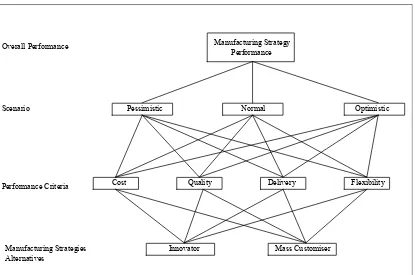
Manufacturing Strategy Performance
Cost Quality Delivery Flexibility
Pessimistic Normal Optimistic
Innovator Mass Customiser Overall Performance
Scenario
Performance Criteria
[image:5.595.96.511.67.342.2]Manufacturing Strategies Alternatives
Figure 2. Hierarchical structure of manufacturing strategy performance evaluation
Evaluation of these alternative strategies is carried out level by level starting from the top level down to the lower levels. The first evaluation assesses the possibilities of scenarios occurring in the planning period. The second evaluation assesses the relative effects of each criterion on performance under a particular scenario.
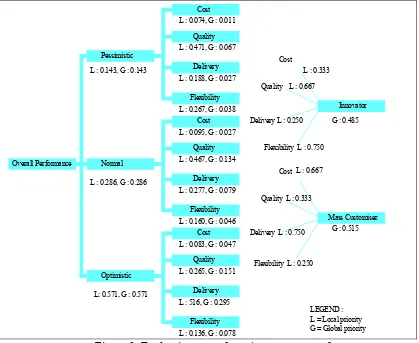
Overall Performance Pessimistic Normal Optimistic Cost Quality Delivery Flexibility Cost Quality Delivery Flexibility Cost Quality Delivery Flexibility Innovator Mass Customiser L : 0.143, G : 0.143
L : 0.286, G : 0.286
L: 0.571, G : 0.571
L : 0.074, G : 0.011
L : 0.471, G : 0.067
L : 0.188, G : 0.027
L : 0.267, G : 0.038
Cost
Quality
Delivery L : 0.250
Flexibility L : 0.750
Cost
Quality L : 0.333
Delivery L : 0.750
Flexibility L : 0.250 L : 0.095, G : 0.027
L : 0.467, G : 0.134
L : 0.277, G : 0.079
L : 0.160, G : 0.046
L : 0.083, G : 0.047
L : 0.265, G : 0.151
L : 516, G : 0.295
L : 0.136, G : 0.078
G : 0.485
G : 0.515 L : 0.333
L : 0.667 L : 0.667
[image:6.595.92.511.71.414.2]LEGEND : L = Local priority G = Global priority
Figure 3. Evaluation manufacturing strategy performance
4. The Dynamics and Sensitivity Analysis
Management uses a set of financial and non-financial performance measures to monitor and control the operation of companies through a set of performances. As external environments change rapidly, the set of performance measures employed by companies should also change to reflect changes in the environment. That is, performance measures reported to the management should change as a result of changes in customers, competitors, internal improvement and so on. Walker proposed the use of dynamic management reporting to keep performance measures up to date [14].
The changes of performance measures can be in the form of deleting, adding, or replacing some performance measures with others performance measures or just changing the priority of some performance measures. A performance measure which was classified as high priority may move to other classes because of changes in the internal or external environments of the business. The QMPMS can cope with the dynamism through the sensitivity or what-if analysis.
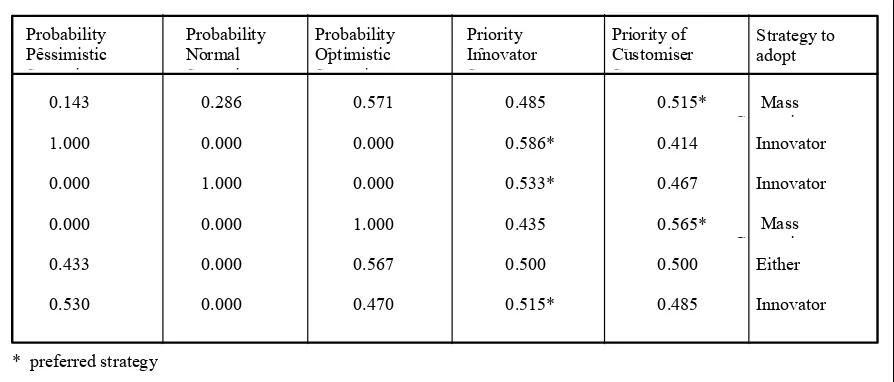
the performance will change if the probability of demand level changes. Again the AHP software could be used to evaluate the sensitivity analysis. The results of such analysis, based on the model presented earlier, are illustrated in Table 2. If the probability of low demand is 100%, the performance of the Innovator strategy will be better than the performance of the Mass Customiser strategy. While, if the probability of high demand is 100%, the Mass Customiser strategy will perform better than the Innovator strategy.
Probability f
Pessimistic
S i
Probability f Normal
S i
Probability f Optimistic
S i
Priority f Innovator S
Priority of M Customiser S
0.143 0.286 0.571 0.485 0.515* Mass
C i
1.000 0.000 0.000 0.586* 0.414 Innovator
0.000 1.000 0.000 0.533* 0.467 Innovator
0.000 0.000 1.000 0.435 0.565* Mass
C i
0.433 0.000 0.567 0.500 0.500 Either
0.530 0.000 0.470 0.515* 0.485 Innovator
Strategy to adopt
[image:7.595.92.539.159.350.2]* preferred strategy
Table 2. Sensitivity analysis of manufacturing strategy performance
Finally if the probability of the occurrence of average demand is 100%, the performance of Innovator strategy will be better than the performance of Mass Customiser strategy. In general, if the probability of the occurrence of low demand is greater than 43.3 %, the performance of Innovator strategy will be better than the performance of Mass Customiser strategy as indicated by Table 2. The sensitivity analysis can also be carried out on changes of the impacts of performance criteria on performance under different scenarios.
5. Discussion and Conclusion
A quantitative model for performance measurement systems, with an example of its application to strategy management has been presented. Using the QMPMS, factors affecting performance can be identified and their effects quantified. The application of the model to evaluate the performance of alternative manufacturing strategies shows that the effects of multidimensional factors on performance can be aggregated into a single dimensionless unit (priority). The example presented in the paper is highly simplified. The evaluation, in practice will be more complicated as all important factors affecting the performance of manufacturing strategy will need to be included in the model, and the interactions among factors should be considered and agreed.
An important benefit gained from the QMPMS approach is that the interaction of the factors can be clearly identified and expressed in quantitative terms. This identification will bring us one step forward in understanding the dynamic behaviour of factors affecting performance. However, to gain valid results, managers using AHP technique should be aware of ‘rank reversal’ phenomenon, for which AHP has been criticised [15, 16, 17, 18, 19].
affecting performance. Consequently, the number of pair-wise comparison questionnaires will be quite large and completion of all the questionnaires will be time consuming. Distributing the questionnaires to several people who have a good understanding and knowledge of the business and subject can eliminate this problem.
The second problem of the QMPMS application relates to achieving a single judgement in pair-wise comparison if more than one person is involved in completing in the questionnaires. Even though Saaty [20] provides formulae for computing the priority of group judgement using geometric mean, achieving consensus among the members of the group seems better than just using the geometric mean. Several discussions may be required to elaborate the real situation before a general consensus judgement over a particular issue can be achieved. Cognitive Mapping is also an effective tool which could be used to elaborate the problem.
The QMPMS approach also facilitates the production of performance reports, which integrate several multidimensional measures into a single performance index.
Furthermore, companies operate in a dynamic environment; consequently performance measurement is a dynamic process. This means that the priorities and criticality of performance measures will change over time as the internal and external operating environments of the business change. At a particular company, performance measures which are critical today, could change after a period of time, to become trivial performance measures. It is important to recognise these changes as soon as possible so that the basis of the quantitative model for the performance measurement system can be changed accordingly. However, changes of some factors up to a certain level would have no significant effects on performance measurement and the current performance measurement system would not need to be changed. The sensitivity analysis available through the QMPMS approach can be used to identify when to review and change the structure, content and priorities within a performance measurement system.
References
1. Garvin, D.A., 1987. Competing on the eight dimensions of quality; Harvard Business Review, November - December: 101-109.
2. Stalk, G., 1988. Time – the next source of competitive advantage; Harvard Business Review (July - August): 41-51.
3. Gerwin, D., 1987. An agenda of research on flexibility of manufacturing processes; International Journal of Operations & Production Management 7(1): 38-49.
4. Slack, N., 1987. The flexibility of manufacturing system; International Journal of Operations & Production Management 7(4): 35-45.
5. Kaplan, R.S. and Norton, D.P., 1996, Translating strategic into action -The Balanced Scorecard. Harvard Business School Press, Boston.
6. Cross, K.F. and Lynch, R.L., 1988-1989. The SMART way to define and sustain success; National Productivity Review 8(1): 23-33.
7. Dixon, J.R., Nanni, A.J. and Vollman, T.E., 1990, The new performance challenge: Measuring operations for world class competition. Dow Jones-Irwin, Homewood.
8. Globerson, S., 1985. Issues in developing a performance criteria system for an organisation ; Int. J. Prod. Res. 23(4 ): 639-646.
9. Bititci, U.S., Carrie, A.S., McDevitt, L. and Turner, T., 1997. Integrated performance measurement systems: A reference model; Proc. IFIP - WG 5.7 1997 Working Conference, Ascona-Ticino-Switzerland: 15-18.
10. Suwignjo, P., Bititci, U.S., Carrie, A.S., 1997. Quantitative models for performance measurement system ; International journal of production economics, March 2000.
11. Miller, J.G. and Roth, A., 1994. A taxonomy of manufacturing strategies; Management Science 40(3): 285-304.
12. Sweeney, M.T, and Szwejczewski, M., 1996. Manufacturing strategy and performance: a study of the UK engineering industry ; Int. J. Op. Prod. Mgmt. 16(5): 23-41.
13. Sweeney, M.T, and Szwejczewski, M., 1996. The search for generic manufacturing strategies in the UK engineering industry, in: Voss, C.A.(Ed.). Manufacturing Strategy: Operations Strategy in a Global Context, London Business School, London, pp.659-664. 14. Walker, K.B., ”Corporate performance reporting revisited-the balanced scorecard and
dynamic management reporting”, Industrial Management and data Systems, 96/3, 1996, pp. 24-30.
15. Belton, V. and Gear T., 1982. On a Short-coming of Saaty’s method of analytic hierarchies; Omega 11(3): 226-230.
16. Saaty, T.L and Vargas L.G., 1984. The legitimacy of rank reversal; Omega 12(5): 513-516.
17. Dyer, J.S., 1990. Remarks on the analytic hierarchy process; Management Science 36(3): 249-258.
18. Harker, P.T. and Vargas L.G., 1990. Reply to remarks on the analytic hierarchy process By J.S. Dyer; Management Science 36(3): 269-273.
19. Schenkerman, S., 1994. Avoiding rank reversal in AHP decision support models; European Journal of Operational Research 74: 407-419.