COMMISSION OF THE EUROPEAN COMMUNITIES
Brussels, 2.7.2008 SEC(2008) 2153
COMMISSIO STAFF WORKIG DOCUMET
Efficiency and Effectiveness of Social Spending
Accompanying document to the
COMMUICATIO FROM THE COMMISSIO TO THE EUROPEA PARLIAMET, THE COUCIL, THE EUROPEA ECOOMIC AD SOCIAL
COMMITTEE AD THE COMMITTEE OF THE REGIOS
"A renewed commitment to social Europe: Reinforcing the Open Method of Coordination for Social Protection and Social Inclusion"
Introduction
The modernisation and preservation of European welfare states is high on the political agenda in most Member States. As a recent public consultation on the social reality in Europe has demonstrated (the "Social reality stock-tacking"), European societies attach great importance and merit to their social models. This is reflected in the dominance of social spending1 in government budgets and in a high level of achievement of social objectives. Spending on health and social protection amounted to 54% of government primary expenditure in the EU25 in 2005. Increasing the efficiency and effectiveness of this component of public expenditure will have a crucial impact on the capacity to maintain the high achievements and on improving and securing the long term adequacy and fiscal sustainability of the European welfare systems. Its considerable weight in government budgets also means that small policy changes can have substantial aggregate effects on the overall performance of public finances.
New challenges and additional pressures on social spending
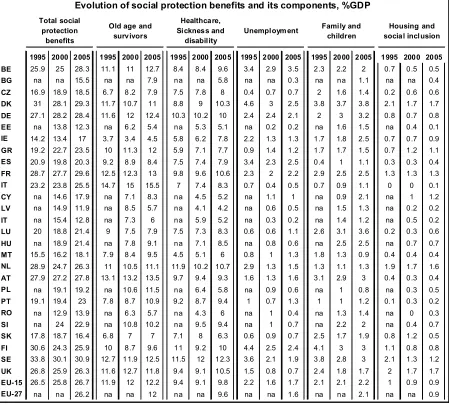
Reforms of social protection expenditures are well under way in most Member States. Spending on social protection overall has remained largely stable at around 27% in the last 10 years2. There is a trend to replace cash benefits with more spending on benefits in kind. While spending on cash benefits fell from 18.4% of GDP in 1995 to 17.6% of GDP in 2005, spending on health and social services rose from 8.1% of GDP to 9.1% of GDP in the EU-15 during the same period. There has been a shift in the funding in several Member States towards a broadening of the financing base from labour taxation to other types of taxes3.
In the coming decades, the size and age-structure of Europe’s population will undergo dramatic changes due to low fertility rates, continuous increases in life expectancy and the retirement of the baby-boom generation. Ageing populations will have profound economic,
1
The definition of 'social spending' adopted in this note includes public expenditure on: (i) old-age and survivor pensions; 'ii) healthcare, sickness and disability; (iii) family/children; (iv) unemployment; and, (v) housing and social exclusion according to Eurostat's database ESSPROSS (see also Table 1 in the statistical annex).
2
See Figure 3.
budgetary and social consequences and will severely impact on social spending, as indicated by the EPC-EC (2006) projections4. Most of the projected increase in public spending will be on pensions, health care and long-term care, becoming apparent as soon as of 2010 and with the largest increases in spending projected to take place between 2020 and 2030 (see Figures 4 and 5 in the Statistical Annex). The EPC-EC projections also indicate considerable potential for reforms, in particular aimed at increasing the retirement age and boosting labour market participation rates of women and older workers.
Over and above ageing populations, additional pressure is being put on social spending by changing life and work patterns, low productivity growth in the public sector, high demand elasticity for public services and potential demands for insurance of new risks in an environment of rapid technological change and increasing globalisation. Moreover, increasingly mobile tax bases in an integrating world, along with the disincentive effects associated with current high levels of taxation on the less mobile tax bases (labour), is making it more difficult to finance social spending.
Reaping the benefits of increased international specialisation and technological progress requires a high degree of flexibility if European economies are to move easily and consistently into new and more competitive activities. Welfare states are expected to provide appropriate social safety nets to better withstand the costs of adjustment and to facilitate the (re-)training and reallocation of workers across sectors and help to absorb external shocks. As maintaining such safety nets imposes a significant burden on the whole of society, social spending should be as efficient as possible, not least to maintain the currently high levels of political support to solidarity across European societies. It should also focus on the real needs of society, which may be difficult if existing safety nets are no longer suited to the challenges ahead. In particular, care must be taken to ensure that social safety nets do not hold back or even prevent the necessary flexibility, while at the same time providing support tothose most concerned, which is the first expression of the European commitment to solidarity in an increasingly globalised world and ageing societies. Appropriate social policies that will help to manage the challenges in this changing environment can also help to avoid political-economy constellations that may result in social conflict, resistance to change, isolationism and slower technology adoption.
The correlation between social expenditure and the reduction of income poverty and social exclusion has been established in empirical studies, which indicate that countries with high social spending tend to reduce poverty more effectively. The welfare effort is more closely correlated with the reduction of poverty rates than with the level of poverty as such. However, there is a wide variation in the relationship between social expenditure and reduction of poverty. Countries with similar levels of social expenditure achieve different levels of poverty reduction, which means that the characteristics of the national welfare arrangements play a significant role in poverty reduction and that in some countries there is room for enhancing efficiency and effectiveness of social policies. This conjecture is supported by recent empirical evidence showing sizeable differences from country to country in the effectiveness of social spending in reducing income inequality. There is also divergence in the level of maturity of social protection systems across the EU, with some countries still needing to improve their overall coverage of different risks.
4
The challenges ahead require policy responses that exploit synergies.. Policies aimed at boosting potential growth help to ensure that public finances evolve on a stable footing. Ensuring access for all citizens to e.g. education and certain public services and markets, can have positive economic implications. A specific issue may arise regarding the consistency of the broad goals of growth and employment with fair distribution and equity outcomes. An unsettled debate among scholars and policy makers focuses on whether the price of accelerating the growth potential is more unequal distribution of income. No clear-cut answer exists for such question, results being largely driven by the specific institutional context and policy framework.
To avoid possible trade-offs, it is essential that policies are carefully designed to minimise distortions and disincentive effects,so as to make social systems more supportive to growth and employment and achieve policy goals more effectively. A cross-cutting policy approach can be the right response to overcome such trade-offs. It also needs to be stressed that any trade-offs between growth and distribution may be only temporary, resulting notably from the costs associated with labour relocation across sector and regions. In these cases, temporary, targeted, incentive-compatible distribution schemes and enabling services may ease the hardship of labour relocation notably resulting from trade shocks or skill-biased technological change. Growth also tends to benefit primarily to those that are most directly involved in economic activity.
Growth and fairness can be consistent goals. Policies aimed at reducing long-term unemployment can increase the contribution of labour inputs to growth, while potentially reducing inequality. Policies targeted at improving the stock of human capital, provided they are designed to enhance the skills of the least-skilled workers, tend to boost the economy’s production potential while reducing income disparities. Financial market development and integration support growth and could reduce inequality by easing credit constraints, which tend to be felt primarily among low-income households.
In some cases, possible tensions between growth and adjustment-friendly policies and the objective of a balanced income distribution may occur. However, due consideration needs to be given to elements that may reduce this trade-off or even lead to synergies. First, a satisfactory growth performance is a necessary pre-requisite for generating the resources needed to maintain the comparatively rich social security systems that characterise European economies. Second, the possible increase in market-income inequality associated with a number of labour market reforms can be alleviated by incentive-compatible schemes to reduce displacement costs and by properly conceived active labour market policies and enabling social services enhancing the effective participation of those who can work on the labour market. Third, the effects of social security and labour market reforms on income inequality will to some extent depend on the efficiency of domestic institutions.
Rising inequality merits an appropriate policy response so as to prevent it acting as a deterrent to further progress towards growth, adjustment and sustainability. The Lisbon Strategy for Growth and Jobs forms the backbone of Europe's efforts to respond to the challenges we are facing. At its core are reforms of product, capital and labour markets, while promoting social cohesion under the Open Method of Coordination (OMC) for social protection and social inclusion. Since the review of the Lisbon Strategy in spring 2005 and the streamlining of the OMC in 2006, there has been closer interaction between Europe's policies on social protection and social inclusion and on growth and employment.
The level and composition of social expenditure vary considerably among Member States
(see Figure 2 and Table 1 in the Statistical Annex). The differences can be attributed to various reasons, in particular the different demographic situations, the level of overall socio-economic development, the exposure of the country to external shocks, and the maturity of the social protection systems. However, they also reflect the different emphasis Member States' respective social models put on the various components of social spending.5
Member States devote most resources to pensions, but their level and relative importance differ substantially. Some spend between 50% (Greece, Luxembourg and Malta) and 60% (Italy and Poland) on pensions. The concentration of social expenditure on the older population in these countries is likely to be even more pronounced given that some benefits that are classified under unemployment or disability benefits are typically payments that facilitate the transition to (early) retirement. Health care (including sickness and disability) is the second largest component after pension spending (about 36% of total social benefits and 9.5% of GDP in EU25; health care without disability: 7.5% of GDP), but there is less variance among Member States. Unemployment and support for families and children are quantitatively less important, but show substantial variance.
On average, social spending as a share of GDP increased slightly from 1995 to 2005 (see Table 2 in the Statistical Annex). The growth has been most pronounced in health care spending indicating particular spending pressures in this field. Pension spending has also increased, but less markedly. Reductions have been recorded on average on unemployment spending, largely due to the improved functioning of the labour market.
Issues related to the measurement of efficiency of social spending
The relationship between spending and outcomes is at the heart of the measurement of the efficiency of social spending. It poses the questions of how the differences in this relationship can be measured, how they are related, and how they can be explored for better policy-making.
Measuring public sector efficiency is a difficult empirical issue and the literature, particularly when it comes to aggregate and international data, is still scarce. Similarly, measuring the efficiency of social spending at the aggregate level poses important conceptual and data challenges. The availability of suitable social and health indicators for doing proper comparison of the efficiency and effectiveness of social programmes across countries is still limited and there is no methodological consensus on how to measure and compare aggregate social spending. This issue certainly deserves further consideration.
Recently, progress has been made in this regard, by shifting the focus of analysis from the resources used to the services delivered or outcomes achieved. But a greater effort is needed to monitor and evaluate social and health policies. Appropriate indicators for measuring the achievement of social policy objectives have been agreed at European level under the Open Method of Co-ordination in the field of social protection and social inclusion. Using some
5
of these indicators reveals a large variance among Member States in terms of policy outcomes.6
Main features of efficient social policies
Policy makers have different instruments at their disposal to increase the efficiency of social spending: they can affect the level, composition, structural design of social policies, and the institutional framework (public and private actors involved, role of different levels of government, etc.). But they also face technological, economic, and institutional constraints, including the cost pressures arising from the relative low labour productivity growth in the service sectors, the adverse incentive effects generated by social policies, the consequences of ageing and the peculiarities of Member States' various social models. Political constraints, e.g. resistance from vested interests, are also relevant and can be stumbling blocks in the process of enhancing the efficiency of social spending.
Given the policy objectives, the constraints and the available instruments, general guidance on efficient social spending policy, as suggested by available empirical evidence, can be sketched as follows:
Social insurance programme parameters should be chosen to ensure protection while limiting serious distortion of economic incentives. Social insurance programmes aim at protecting individuals against spells of unemployment and undesirably low levels of consumption during old age, when people can be faced with large medical bills. On the other hand, they may, if not properly designed, distort incentives and cause inefficient use of resources: low saving, unproductively long job search, early retirement and excessive consumption of medical care.
Social policies focussing on the poorest and most vulnerable will reach citizens with low consumption levels, where the utility of increased consumption is particularly high. On the other hand, poorly designed schemes may create disincentives for low-income groups to taking up work or working more, and take-up rates can be low, due to administrative complexity and stigma effects.
Social policies should support high employment levels. In this way, the tax base is broadened and the individual tax burden for financing social spending, and in particular the associated negative impact (excessive burden) of high taxation, can be reduced. Moreover, fewer people are in need of support through the public transfer system. This relates to all policies that can increase participation rates (e.g. family policies, jobs for young people, policies that encourage older workers to stay in the labour market) and reduce unemployment, which is one of the prime reasons for poverty and social exclusion and makes insufficient use of a factor of production with associated loss of output.
Policies that foster human capital formation are of the outmost importance for enhancing efficiency. Education and training are key factors in reducing the probability that individuals
6
will require public assistance. The provision of good quality education will enable people to better seize new job opportunities in a changing economic environment. Poverty risks, long-term unemployment and social inclusion are closely tied to individual education and acquired skills. Providing good quality education is an important complement to social policy because education reduces the probability that individuals will become unemployed and require social assistance, and it increases people's ability of seizing new job opportunities. To the extent that better education results in higher employment levels and higher productivity levels, it can also help to alleviate the financing pressures on social protection systems. Finally, appropriate educational policies can help to reduce the risk of low social mobility and of poverty and social exclusion being passed on from parents to their children.
The modernisation of public administration can play an important role in delivering better services, achieving better value for money and keeping government expenditure in check. Initiatives geared to performance orientation of public budgets, re-organisation of public administrations, reforms in human resource management and improved use of ICT tools will help to boost the efficiency and effectiveness of public spending.
Which Directions for efficiency-enhancing reforms?
While there is no “one-size-fits-all” approach across Europe to enhancing the efficiency and effectiveness of social spending, there are common challenges and there is a common need to act. Over the last decade Member States have undertaken reforms of their social security and health programmes in response to social and demographic challenges and fiscal consolidation pressures. However, there are still significant shortcomings with respect to complex social problems and new emerging challenges.
Building on recent achievements and ongoing reform programmes, recent experience can provide useful lessons for forging a more pro-poor and pro-efficiency pattern of outlays. Steps in this direction might include:
Reconsidering the nature of social objectives and how to achieve them. The policy discussion is now focussing on how to foster equal opportunities for all people (to start well in life and make the most of the chances offered), while guaranteeing access and solidarity7.
Redirecting rather than increasing public expenditure. Although some countries with social protection systems that did not reach maturity may need to expand their financial and human resources to ensure adequate coverage of risks for the whole population, increased spending in itself will not necessarily improve the quality of social services. Taking into account the size of the public sector in many European countries, striving for a fair and inclusive society does not necessarily mean higher taxes and higher public spending, but rather smarter taxes and more effective spending. Shifting focus and increasing spending on priority areas will, however, not be possible without proper evaluation and prioritisation and policy measures that cut back spending in other areas.
When reforming social schemes, a comprehensive approach is needed. Changes to pension systems, unemployment insurance and disability schemes should be implemented in parallel, by tightening up the eligibility criteria, revising of the incentive structure for access to social benefits and by redirecting resources towards retraining and rehabilitation. Access should be
7
limited to those who genuinely qualify, in order to avoid these schemes becoming alternative pathways to early retirement, which would lead to a permanent exit from the labour market.
Focussing on active inclusion. In the past, many policies (such as unemployment transfers and early retirement schemes) have subsidized inactivity, and involved little or no requirement to actively seek and accept jobs (or requirements were not enforced). To enhance efficiency, labour market institutions and social policies need to provide appropriate incentives for inactive persons to work and to participate in education and training as well as enabling services (e.g. child care) that allow effective participation in the labour market. Social protection needs to be targeted on people facing particular difficulties in finding a job, with a view to equality of opportunities.
Encouraging people to work longer and be more active in order to cope with the social, economic, fiscal and other challenges posed by ageing populations. This requires a coherent set of policy measures providing appropriate financial incentives for people to work beyond current actual retirement ages in most Member States. Continuing reform of public pension systems to place them on an actuarially sound footing is key, notably in countries which are late in the process of reform. Remaining financial incentives for early retirement should be withdrawn or scaled back significantly. Reforms would give governments' greater flexibility and financial resources to respond to new emerging social issues, otherwise there is a real risk that retirement pensions will crowd out alternative forms of expenditures with a higher social priority. Reforms need also to ensure intergenerational equity, so there is a balance of burden-sharing between generations. Policies to improve the employability of workers as they age, e.g. lifelong learning, promotion of occupational health and other activities of maintaining work ability, as well as targeted labour market measures, supported by the opening up of labour markets to older workers, including positive employers attitudes and more flexible working arrangements, will be needed to complement changes to social security systems.
“Making work pay” with appropriate incentives, so that tax/benefit systems do not hinder labour market dynamics and actually help facilitate structural change. Given the high rate of job creation and job destruction that characterises a growing economy, having social protection policies and labour market institutions that prevent this happening would impede structural change and economic growth. Along the lines of the flexicurity approach, the use of unemployment benefits and employment protection legislation needs to be rebalanced to reflect new risks and realities on the labour market. Shifting the focus from providing protection or job security (with employment protection) to providing security in the market place (with appropriate unemployment benefits and activation policies) will facilitate job-to-job mobility. This is particularly important in a world characterised by the gradual disappearance of life-long jobs and an increasing need for mobility. Unemployment benefit reforms should also aim at enhancing their capacity to act as automatic stabilisers. The need to enhance the capacity of tax and benefit system to favour the adjustment, in particular in case of country-specific shocks, is enhanced in the institutional setting of the economic and monetary union.
Evaluate and screen regularly the efficiency and effectiveness of social policies, with a strong emphasis on value for money and an output-oriented approach. There is a general need for developing a stronger "evaluation culture", to help assess what policies are or are not working, and to have a more objective basis for reprioritising funding from areas where provisions has become less justifiable towards areas of more pressing need. Consistent performance indicators are needed, and greater attention should be focused on measuring policy outcomes, instead of the current focus on the measurement of resources deployed. Both qualitative and quantitative performance measurement (including user satisfaction) should be introduced to measure regularly the performance of public social services.
Conclusions
Confronted with globalisation and the ageing of our populations, Europe can and should do better in order to move towards higher productivity and employment without necessarily compromising on the social dimension. All Member States will face increased demand for social services and challenges in financing them. In the face of these challenges, making welfare systems more efficient, notably by boosting incentives, making public policies in the social field more effective, and prioritising of welfare programmes, are key elements in addressing the potential imbalance between revenue requirements and growing pressures on social spending. This is a necessary condition in terms of maintaining and further developing high levels of social protection. As stressed in the Commission's contribution to the Hampton Court Meeting of Heads of State and Government in 2005, "Europe must modernise to ensure continued high quality education and health care, satisfactory jobs for all and adequate pensions. Modernisation will give the confidence to reap the benefits of globalisation."
Provided the right incentive and supporting structures are in place, it is possible to have economic dynamism while maintaining comprehensive social protection systems. The trade-off between efficiency and long-term financial sustainability of welfare systems and equality is not inevitable. On the contrary, as the experience of a number of Member States shows, well designed social protection schemes can contribute to growth and competitiveness.8 However, reconciling efficiency and social justice requires bold political decisions and resolute action on activating and forward-looking reforms, which contribute to employment and growth and lay the foundations for the long-term viability of social protection models.
8
STATISTICAL AEX
Figure 1: The composition of public spending (all government) in the EU 25, 2005
General public services 14%
Defence 3%
Public order and safety 4%
Economic affairs 8%
Environment protection 2% Housing and community
amenities 2%
Recreation, culture and religion 2% Education 11% Health 14% Social protection 40%
Source:Eurostat – COFOG
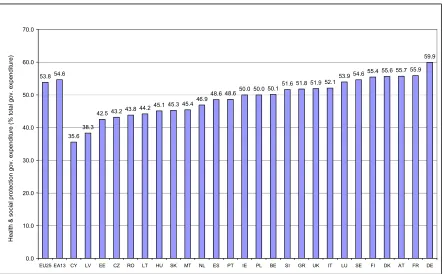
Figure 2: Government expenditure on health and social protection as % of total government expenditure, 2005
53.8 54.6
35.6 38.3
42.5 43.243.8 44.2
45.1 45.3 45.4 46.9
48.6 48.650.0 50.0 50.1
51.6 51.8 51.9 52.1
53.9 54.655.4 55.6 55.7 55.9 59.9 0.0 10.0 20.0 30.0 40.0 50.0 60.0 70.0
EU25 EA13 CY LV EE CZ RO LT HU SK MT NL ES PT IE PL BE SI GR UK IT LU SE FI DK AT FR DE
H e a lt h & s o c ia l p ro te c ti o n g o v . e x p e n d it u re ( % t o ta l g o v . e x p e n d it u re )
[image:10.595.74.517.453.727.2]Figure 3: Expenditures on social protection benefits since 1990 in EU (% of GDP)
24 24.5 25 25.5 26 26.5 27 27.5 28
1990 1991 1992 1993 1994 1995 1996 1997 1998 1999 2000 2001 2002 2003 2004 eu25
eu15
Source: ESSPROS.
Table 1: Total social expenditure and composition of social expenditure (2005)*
Social expenditure9
Social benefits10
Old age and survivors
Healthcare, sickness and
disability
Family/Children Unemployment
Housing and Social exclusion
% of GDP GDP % of % of TSB GDP % of % of TSB GDP % of % of TSB GDP % of % of TSB GDP % of % of TSB
EU27 27.2 26.2 12.0 45.8 9.6 36.6 2.1 8.0 1.6 6.1 0.9 3.4
EU25 27.4 26.3 12.1 46.0 9.6 36.5 2.1 8.0 1.6 6.1 0.9 3.4
EA13 27.8 26.6 12.3 46.2 9.5 35.7 2.2 8.3 1.8 6.8 0.8 3.0
BE 29.7 28.3 12.7 44.9 9.6 33.9 2.0 7.1 3.5 12.4 0.5 1.8
BG 16.1 15.5 7.9 51.0 5.8 37.4 1.1 7.1 0.3 1.9 0.4 2.6
CZ 19.1 18.5 7.9 42.7 8.0 43.2 1.4 7.6 0.7 3.8 0.6 3.2
DK 30.1 29.3 11.0 37.5 10.3 35.2 3.8 13.0 2.5 8.5 1.7 5.8
DE 29.4 28.4 12.4 43.7 10.0 35.2 3.2 11.3 2.1 7.4 0.8 2.8
9
It is important to note that social expenditure and social benefits presented here are recorded gross, without deduction of taxes and other compulsory levies payable on benefit income; fiscal advantages granted to households as part of social protection are excluded. If these were taken into account the ranking of countries would be affected. The impact of gross social protection spending is especially significant in the Nordic Countries, AT and the NL, where the net social expenditure in GDP would be 2 to 4 percentage points lower than the gross figure.
[image:11.595.54.550.402.666.2]EE 12.5 12.3 5.4 43.9 5.1 41.5 1.5 12.2 0.2 1.6 0.1 0.8
IE 18.2 17.0 4.5 26.5 7.8 45.9 2.5 14.7 1.3 7.6 0.9 5.3
GR 24.2 23.5 12.0 51.1 7.7 32.8 1.5 6.4 1.2 5.1 1.1 4.7
ES 20.8 20.3 8.4 41.4 7.9 38.9 1.1 5.4 2.5 12.3 0.4 2.0
FR 31.5 29.6 13.0 43.9 10.6 35.8 2.5 8.4 2.2 7.4 1.3 4.4
IT 26.4 25.5 15.5 60.8 8.3 32.5 1.1 4.3 0.5 2.0 0.1 0.4
CY 18.2 17.9 8.3 46.4 5.2 29.1 2.1 11.7 1.0 5.6 1.2 6.7
LV 12.4 11.9 5.7 47.9 4.2 35.3 1.3 10.9 0.5 4.2 0.2 1.7
LT 13.2 12.8 6.0 46.9 5.2 40.6 1.2 9.4 0.2 1.6 0.2 1.6
LU 21.9 21.4 7.9 36.9 8.3 38.8 3.6 16.8 1.1 5.1 0.6 2.8
HU 21.9 21.4 9.1 42.5 8.5 39.7 2.5 11.7 0.6 2.8 0.7 3.3
MT 18.3 18.1 9.5 52.5 6.0 33.1 0.9 5.0 1.3 7.2 0.4 2.2
NL 28.2 26.3 11.1 42.2 10.7 40.7 1.3 4.9 1.5 5.7 1.6 6.1
AT 28.8 27.8 13.5 48.6 9.3 33.5 3.0 10.8 1.6 5.8 0.4 1.4
PL 19.6 19.2 11.5 59.9 5.8 30.2 0.8 4.2 0.6 3.1 0.5 2.6
PT 24.7 23 10.9 47.4 9.4 40.9 1.2 5.2 1.3 5.7 0.2 0.9
RO 14.2 13.9 5.7 41.0 6.0 43.2 1.4 10.1 0.4 2.9 0.3 2.2
SI 23.4 22.9 10.2 44.5 9.4 41.0 2.0 8.7 0.7 3.1 0.7 3.1
SK 16.9 16.4 7.0 42.7 6.3 38.4 1.9 11.6 0.7 4.3 0.5 3.0
FI 26.7 25.9 9.6 37.1 10.0 38.6 3.0 11.6 2.4 9.3 0.8 3.1
SE 32.0 30.9 12.5 40.5 12.3 39.8 3.0 9.7 1.9 6.1 1.2 3.9
UK 26.8 26.3 11.8 44.9 10.5 39.9 1.7 6.5 0.7 2.7 1.7 6.5
Source:Eurostat – ESSPROS
Table 2: Total social benefits and its composition (in % of GDP) 1995, 2000 and 2005*
1995 2000 2005 1995 2000 2005 1995 2000 2005 1995 2000 2005 1995 2000 2005 1995 2000 2005
BE 25.9 25 28.3 11. 1 11 12.7 8.4 8.4 9.6 3.4 2.9 3.5 2.3 2.2 2 0.7 0.5 0.5
BG na na 15.5 na na 7.9 na na 5.8 na na 0.3 na na 1.1 na na 0.4
CZ 16.9 18.9 18.5 6.7 8.2 7.9 7.5 7.8 8 0.4 0.7 0.7 2 1.6 1.4 0.2 0.6 0.6
DK 31 28.1 29.3 11. 7 10.7 11 8.8 9 10.3 4.6 3 2.5 3.8 3.7 3.8 2.1 1.7 1.7
DE 27.1 28.2 28.4 11. 6 12 12.4 10.3 10.2 10 2.4 2.4 2.1 2 3 3.2 0.8 0.7 0.8
EE na 13.8 12.3 na 6.2 5.4 na 5.3 5.1 na 0.2 0.2 na 1.6 1.5 na 0.4 0.1
IE 14.2 13.4 17 3.7 3.4 4.5 5.8 6.2 7.8 2.2 1.3 1.3 1.7 1.8 2.5 0.7 0.7 0.9
GR 19.2 22.7 23.5 10 11.3 12 5.9 7.1 7.7 0.9 1.4 1.2 1.7 1.7 1.5 0.7 1.2 1.1
ES 20.9 19.8 20.3 9.2 8.9 8.4 7.5 7.4 7.9 3.4 2.3 2.5 0.4 1 1.1 0.3 0.3 0.4
FR 28.7 27.7 29.6 12. 5 12.3 13 9.8 9.6 10.6 2.3 2 2.2 2.9 2.5 2.5 1.3 1.3 1.3
IT 23.2 23.8 25.5 14. 7 15 15.5 7 7.4 8.3 0.7 0.4 0.5 0.7 0.9 1.1 0 0 0.1
CY na 14.6 17.9 na 7.1 8.3 na 4.5 5.2 na 1.1 1 na 0.9 2.1 na 1 1.2
LV na 14.9 11.9 na 8.5 5.7 na 4.1 4.2 na 0.6 0.5 na 1.5 1.3 na 0.2 0.2
IT na 15.4 12.8 na 7.3 6 na 5.9 5.2 na 0.3 0.2 na 1.4 1.2 na 0.5 0.2
LU 20 18.8 21.4 9 7.5 7.9 7.5 7.3 8.3 0.6 0.6 1.1 2.6 3.1 3.6 0.2 0.3 0.6
HU na 18.9 21.4 na 7.8 9.1 na 7.1 8.5 na 0.8 0.6 na 2.5 2.5 na 0.7 0.7
MT 15.5 16.2 18.1 7.9 8.4 9.5 4.5 5.1 6 0.8 1 1.3 1.8 1.3 0.9 0.4 0.4 0.4
NL 28.9 24.7 26.3 11 10.5 11.1 11.9 10.2 10.7 2.9 1.3 1.5 1.3 1.1 1.3 1.9 1.7 1.6
AT 27.9 27.2 27.8 13. 1 13.2 13.5 9.7 9.4 9.3 1.6 1.3 1.6 3.1 2.9 3 0.4 0.3 0.4
PL na 19.1 19.2 na 10.6 11.5 na 6.4 5.8 na 0.9 0.6 na 1 0.8 na 0.3 0.5
PT 19.1 19.4 23 7.8 8.7 10.9 9.2 8.7 9.4 1 0.7 1.3 1 1 1.2 0.1 0.3 0.2
RO na 12.9 13.9 na 6.3 5.7 na 4.3 6 na 1 0.4 na 1.3 1.4 na 0 0.3
SI na 24 22.9 na 10.8 10.2 na 9.5 9.4 na 1 0.7 na 2.2 2 na 0.4 0.7
SK 17.8 18.7 16.4 6.8 7 7 7.1 8 6.3 0.6 0.9 0.7 2.5 1.7 1.9 0.8 1.2 0.5
FI 30.6 24.3 25.9 10 8.7 9.6 11 9.2 10 4.4 2.5 2.4 4.1 3 3 1.1 0.8 0.8
SE 33.8 30.1 30.9 12. 7 11.9 12.5 11.5 12 12.3 3.6 2.1 1.9 3.8 2.8 3 2.1 1.3 1.2
UK 26.8 25.9 26.3 11. 6 12.7 11.8 9.4 9.1 10.5 1.5 0.8 0.7 2.4 1.8 1.7 2 1.7 1.7
EU-15 26.5 25.8 26.7 11. 9 12 12.2 9.4 9.1 9.8 2.2 1.6 1.7 2.1 2.1 2.2 1 0.9 0.9
EU-27 na na 26.2 na na 12 na na 9.6 na na 1.6 na na 2.1 na na 0.9
Evolution of social protection benefits and its components, %GDP
Total social protection
benefits
Old age and survivors
Healthcare, Sickness and
disability
Unemploym ent Family and
children
Housing and social incl usion
Figures 4 and 5: Age-related spending as a % of GDP in the EU Member States, 2004, 2030 and 2050
0.0 5.0 10.0 15.0 20.0 25.0 30.0 35.0 40.0 2 0 0 4 2 0 3 0 2 0 5 0 2 0 0 4 2 0 3 0 2 0 5 0 2 0 0 4 2 0 3 0 2 0 5 0 2 0 0 4 2 0 3 0 2 0 5 0 2 0 0 4 2 0 3 0 2 0 5 0 2 0 0 4 2 0 3 0 2 0 5 0 2 0 0 4 2 0 3 0 2 0 5 0 2 0 0 4 2 0 3 0 2 0 5 0 2 0 0 4 2 0 3 0 2 0 5 0 2 0 0 4 2 0 3 0 2 0 5 0 2 0 0 4 2 0 3 0 2 0 5 0 2 0 0 4 2 0 3 0 2 0 5 0 2 0 0 4 2 0 3 0 2 0 5 0 2 0 0 4 2 0 3 0 2 0 5 0 2 0 0 4 2 0 3 0 2 0 5 0
BE DK DE GR ES FR IE IT LU NL AT PT FI SE UK
Pensions Health Long-term care Unemploymet benefits Education
0.0 5.0 10.0 15.0 20.0 25.0 30.0 35.0 40.0 2 0 0 4 2 0 3 0 2 0 5 0 2 0 0 4 2 0 3 0 2 0 5 0 2 0 0 4 2 0 3 0 2 0 5 0 2 0 0 4 2 0 3 0 2 0 5 0 2 0 0 4 2 0 3 0 2 0 5 0 2 0 0 4 2 0 3 0 2 0 5 0 2 0 0 4 2 0 3 0 2 0 5 0 2 0 0 4 2 0 3 0 2 0 5 0 2 0 0 4 2 0 3 0 2 0 5 0 2 0 0 4 2 0 3 0 2 0 5 0
CY CZ EE HU LT LV MT PL SK SI
Pensions Health Long-term care Unemploymet benefits Education