Financial report 2000
180
0
0
Full text
(2)
(3) EUROPEAN UNION. FINANCIAL REPORT. 2000.
(4) A great deal of additional information on the European Union is available on the Internet. It can be accessed through the Europa server (http://europa.eu.int). Cataloguing data can be found at the end of this publication. Luxembourg: Office for Official Publications of the European Communities, 2001 ISBN 92-894-1664-5 © European Communities, 2001 Reproduction is authorised provided the source is acknowledged. Printed in Belgium.
(5) FOREWORD The 2000 budget was the first agreed under the new financial perspective, a multiannual structure setting out expenditure ceilings for different sectors. This structure was agreed by Parliament, Council and Commission in the Interinstitutional Agreement of May 1999, and covers the period 2000-06. The year 2000 is thus a transition year between the old and new perspective periods. It marks a new starting point for several major areas of Community activity, such as the Structural Funds. The adoption of the budgetary framework, allied to the reform of the common agricultural policy, has created a new environment for the agricultural budget for 2000 onwards. Market support measures are the first pillar. Support for rural development is now the second pillar of the common agricultural policy, whose budget henceforth also covers veterinary and plant health measures, as well as information activities on the agricultural policy. The Member States devoted 2000 to the preparation of their Structural Fund programmes for the new period. These were then negotiated with the Commission services, and the committees concerned consulted, before formal adoption of the programme documents. The rigour required and the complexity of this process of preparation and negotiation meant that it was not possible to finalise all the programmes in 2000. Appropriations earmarked were thus carried forward for allocation in 2001 and succeeding years. Resources for different policy areas in the Member States, the so-called internal policies, were concentrated on certain high priorities, in view of their multiplier effect on growth and employment and on the development and dissemination of new technologies. Research, trans-European transport, energy and communication networks, education, vocational training and youth policy count among these priorities. The Commission also took account of the budgetary implications of the further extension of EU competence through the Treaty of Amsterdam to justice and home affairs. Monetary support is given to the candidate countries in eastern Europe to prepare for enlargement, the so-called pre-accession strategy, through different programmes. The Phare programme was beefed up. Two new specific subsidy programmes, one for agriculture (Sapard) and the other for measures to improve the transport and environmental infrastructure (ISPA), boosted the funding available. External action received increased payment appropriations in order to help clear outstanding commitments. Cooperation with the countries of the Balkans was one of the priorities. Only about 6 % of the EU budget goes on administrative expenditure for all the institutions. This part of the budget has rigorous limits for each year up to 2006. In 2000, the Commission was preparing its reform proposals and the call on resources by other institutions was well within the limits..
(6) Two supplementary and amending budgets were required in 2000 to finance unforeseen needs arising during the year. The first covered macro-financial aid for Montenegro and grants to the European Agency for the evaluation of medicinal products for orphan drugs. The second covered certain additional costs of the European Parliament's building policy, and Council costs associated with the European common foreign and security policy. The budget 2000 payments represented 1.11 % of the gross national product of the 15 Member States, and was still well below the ceiling for payment appropriations agreed in Berlin for 2000. By the end of the year, due largely to the structural programmes not being fully implemented, a surplus of about EUR 11 billion remained, much of which went back to the Member States, in the form of reductions to their contributions to the 2001 budget. The Financial Report for 2000 is presented in a somewhat different style to previous years. Instead of blanket coverage of all activities financed by the budget, two of the most topical areas of Community intervention have been selected for a more in-depth examination. Different themes will be chosen for next year's Report. We highlight firstly, the Structural Funds (since 2000 is the start of the new programming period), and secondly, pre-accession aid for enlargement (given the progress made in 2000). The major policy areas of Community action in 2000 are then summarised according to the categories of activity based-budgeting since this reflects the budget's future structure and presentation.. Michaele SCHREYER Commissioner for the budget.
(7) CONTENTS. Page Economic situation of the European Union in 2000. 7. Financial perspectives (2000-06) Budget implementation 2000 — overview of commitments and payments as at 31 December 2000. 12. Budgetary procedure for 2000. lg. EU revenue in 2000 EU expenditure — enlargement in 2000 (Sapard, ISPA, Phare). 25 28. EU expenditure — the Structural Funds in 2000. 45. Main operational policy areas and activities (by activity-based budgeting — ABB). 53. Agriculture and rural development. 54. Economic andfinancialaffairs. 55. Enterprise. rn. Employment and social affairs. 60. Transport Ener. gy. ^ 64. Environment. <-.-. Research. ¿n. Information society. 70. Fisheries. 72. Regional policy. 74. Education and culture. 76. Media and communications. 7g. Health and consumer protection. g0. Justice and home affairs. g2. External relations. g4.
(8) Enlargement. 86. Humanitarian aid. 87. The fight against fraud. 90. Borrowing and lending activities. 92. Treasury report. 101. The ECSC's financial and budgetary activities in 2000. 104. European Development Fund: financial out-turn. 112. Annex — Consolidated accounts of the European Union. 123. Accounting principles. 124. Accounting rules and methods. 126. Consolidated revenue and expenditure account for 2000. 129. Consolidated balance sheet of the European Union at 31 December 2000. 138. — Comments on the balance sheet at 31 December 2000. 140. — Explanatory notes to the balance sheet. 141. Off-balance-sheet commitments — potential liabilities and assets at 31 December 2000. 159. — Explanatory notes to off-balance-sheet commitments — potential liabilities and assets. 162. Glossary. 170.
(9) ECONOMIC SITUATION OF THE EUROPEAN UNION IN 2000. The year 2000 was one of the best of the last decade as average GDP growth in the EU reached 3.4 % in real terms. However, when one looks at the quarterly growth profile, the year can be split into two periods. The first half of the year saw a very strong performance, prolonging the dynamics of the end of 1999. The second half of 2000 turned out much slower, with quarterly growth rates of about 0.6 %. As expected, private consumption was held back in the second half of 2000 by the loss in purchasing power triggered by the surge in oil prices. Gross fixed capital formation has also been decelerating moderately over the last few quarters, but on the whole it remained an important contributor to growth. Net exports were the other major support to growth. Double-digit annual growth rates have been recorded for both export and import volumes since the end of 1999. Indeed, if one leaves aside the somewhat subdued household consumption, all demand components have been very well oriented in 2000, which explains this record performance. Monetary conditions have been growth supportive over the year 2000. The European Central Bank raised its benchmark rate from 3 % to 4.75 %, but in the meantime inflation edged up as well, with the consequence to offset a large part of the increase in nominal rates. Contrary to short-term interest rates, long-term interest rates (10-year yields) in the euro area eased gradually throughout the year. Finally, the euro exchange rate depreciated further over the year by some 10 % against the US dollar, thereby providing an important competitiveness advantage to European exporters. Linked to the hike in oil prices and the weak euro, headline inflation, as measured by the harmonised index of consumer prices (HICP), increased further in the EU from 1.8 % in. January 2000 to 2.3 % in December 2000. An unusually large difference of three decimal points was observed at the end of the year between the EU and the euro area, due mainly to contrasting price developments in the UK. The increase in headline consumer prices is linked essentially to energy price developments, although core inflation (without energy and unprocessed food) also displayed an upward trend as past energy price increases fed through into other goods' prices. Net job creation in the EU as a whole is estimated to have grown by 1.7 % last year, the best performance since 1990. It is estimated that over the period 1998-2000 more than 5.3 million jobs have been created in the EU, and 2.8 million just over the single year 2000. Since employment grew at a higher pace than the civilian labour force, the number of unemployed declined significantly. The unemployment rate declined from 9.2 % in 1999 to 8.3 % in 2000 and prospects are for a further decline. Both in the EU as a whole and in the euro area, the unemployment rate at the end of 2000 was at its lowest level since 1991. Countries with the highest unemployment rates succeeded in reducing the number of jobless significantly, but differences within the EU remain wide. Despite the improving situation of the labour market and the hike in consumer prices, wage growth has remained subdued in 2000. In 2000, the overall general government balance for the European Union as a whole recorded a surplus of 1.2 % of GDP, compared to a deficit of 0.7 % of GDP in 1999. For the euro area the 2000 surplus amounted to 0.4 % of GDP, compared to a deficit of 1.3 % of GDP a year earlier. Universal Mobile Telecommunication Systems (UMTS) licences had an important impact on these results. The related proceeds are estimated.
(10) 8. to the tune of more than 1 % of GDP in 2000. Measured by the change in the cyclically adjusted primary balance, the fiscal stance has been neutral in 2000 at the level of the EU.. In 2000 the debt/GDP ratio is estimated to have fallen by about three percentage points to 64.5 % in EU-15. The decline in the government debt is expected to continue in the coming years..
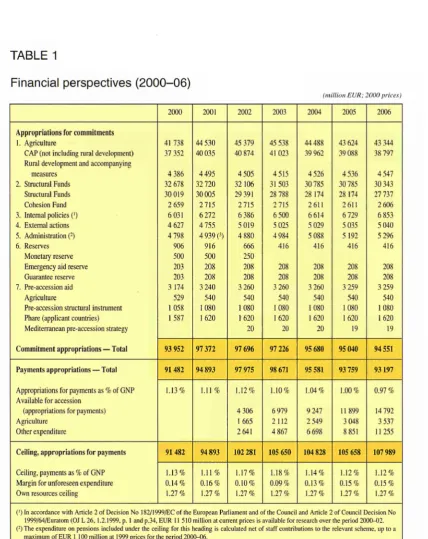
(11) FINANCIAL PERSPECTIVES (2000-06). Structure of the new financial perspective The general layout of the previous financial framework has been preserved, with a number of changes. The ceiling of Heading 1 (agriculture) is no longer the agricultural guideline, as defined by the Council decision on budgetary discipline, with growth indexed at 74 % of the increase in the Union's GNP. To make discipline even tighter, the ceiling has been set in line with estimated growth in actual expenditure, taking into account the agreed reforms. The agricultural guideline is maintained, but its scope is broadened to cover not only CAP expenditure but also agriculture-related preaccession aid and the amount earmarked in this area for the next wave of enlargement. A separate subheading has been introduced for rural development measures. As regards enlargement-related expenditure: D a new Heading 7 has been created to cover the three pre-accession instruments which have been established: the agricultural instrument (Sapard), the structural instrument (ISPA) and an enhanced Phare programme for the applicant countries; D a margin has been kept under the own resources ceiling (in payment appropriations) to finance accession-related expenditure when new Member States join the Union; D by adopting this approach and including corresponding provisions in the Interinstitutional Agreement, expenditure for the 15 current Member States and for the applicant countries can be ring-fenced. The financial perspective is set at constant 1999 prices. As before, a technical adjustment. will be made each year to take account of price increases. However, it has been agreed that a deflator of 2 % will be used for Heading 1. In accordance with the Structural Funds regulations, the annual deflator applied to programming and to the corresponding ceiling in the financial perspective is also fixed at a flat rate of 2%. The new Interinstitutional Agreement keeps the possibility of revising the financial perspective, by means of a joint decision by the two arms of the budgetary authority on a proposal from the Commission, to deal with situations which had not been foreseen originally. A new 'flexibility instrument' has also been introduced. This instrument, which is subject to an annual ceiling of EUR 200 million, is intended to cover the financing for a given financial year of clearly identified expenditure which cannot be met within the ceilings available under one or more headings. The decision to mobilise the instrument is taken jointly by the two arms of the budgetary authority on a Commission proposal.. Ceilings on expenditure 2000-06 Even allowing for the amounts placed in reserve for future waves of enlargement over this period, the financial framework leaves a substantial margin under the own resources ceiling of between 0.09 % and 0.14 % of GNP, depending on the year. Discipline is tighter for the total volume of appropriations for commitments than for total payments, as the latter must cover commitments outstanding from previous years. The Heading 1 ceiling has been set in such a way that, as an annual average at constant prices and excluding the rural development.
(12) 10. measures previously financed by the Structural Funds, the amount in question is still close to the level of expenditure entered in the 1999 budget. Accordingly, some components of the CAP reform have been scaled down or will be introduced in stages. The overall allocation for structural operations will enable aid per capita under the Structural Funds in eligible regions to be maintained at 1999 levels. Assistance for regions no longer eligible for Objective 1 or the new Objective 2 will be reduced gradually. As regards the Cohesion Fund, account has been taken of the progress made by the recipient countries towards genuine convergence over the last reference period. The ceilings for Headings 3 (internal policies), 4 (external action, excluding pre-accession aid) and 5 (administration) have been set on the basis of actual expenditure entered in the 1999 budget rather than the ceilings for that year in the previous financial perspective, which were considerably higher. Moreover, the rates of increase are lower than those initially proposed by the Commission. Table 1 shows, for the various headings, how the fixed ceilings for commitment appropriations have changed in the financial perspective for 2000-06.. Application of the financial perspective In accordance with the relevant provisions of the Interinstitutional Agreement, technical adjustments were made to the financial perspective for 2000 and 2001 to take account of price increases and the Union's GNP. When adopting the 2000 budget, the budgetary authority decided to employ the flexibility instrument to finance the Kosovo reconstruction programme under Heading 4 of the financial perspective. On 3 May 2000 the Commission tabled a proposal for the revision of the financial perspective. The aim of this proposal is to provide medium-term financing for a programme of assistance for the whole of the western Balkans by raising the Heading 4 ceiling 'External actions' for the period 2001-06, offset for 2001 and 2002 by an equivalent lowering of subheading la 'CAP' (not including rural development). The Commission also proposed the reclassification of aid to Cyprus and Malta from Heading 4, where it is at the moment, to Heading 7 'Pre-accession'. This reclassification would be neutral in its impact on the budget. The Commission presented its preliminary draft budget for 2001 taking into account these proposed changes to the financial perspective..
(13) 11. TABLE 1 Financial perspectives (2000-06) (million EUR: 2000 prices). Appropriations Tor commitments 1. Agriculture CAP (not including rural development) Rural development and accompanying measures 2. Structural Funds Structural Funds Cohesion Fund 3. Internal policies (') 4. External actions 5. Administration (2) 6. Reserves Monetary reserve Emergency aid reserve Guarantee reserve 7. Preaccession aid. 2002. 2003. 2004. 2005. 2006. 44530 40 035. 45 379 40 874. 45 538 41023. 44488 39 962. 43 624 39 088. 43 344 38 797. 4495 32720 30005 2715 6272 4755 4 939 (¡) 916 500. 4505 32106 29 391. 4515 31503 28 788. 4526 30785 28 174. 4536 30785 28174. 4547 30343 27 737. 2715. 2 715 6500 5 025 4984 416. 2611 6614 5 029 5 088 416. 2611 6 729 5 035 5 192 416. 2 606 6 853 5 040 5 296 416. 2000. 2001. 41738 37 352 4 386 32 678 30 019 2 659 6 031 4 627 4 798 906 500. 6 386 5 019 4 880 666 250. 203 203 3 174. 208 208 3 240. 208 208 3 260. 208 208 3 260. 208 208 3 260. 208 208 3259. 208 208 3 259. 529 1058 1587. 540 1080 1620. 540 1080 1620 20. 540 1080 1620 20. 540 1080 1620 20. 540 1080 1620 19. 540 1080 1620 19. Commitment appropriations — Total. 93 952. 97372. 97 696. 97226. 95680. 95040. 94551. Payments appropriations — Total. 91482. 94 893. 97975. 98 671. 95 581. 93 759. 93197. Appropriations for payments as % of GNP Available for accession (appropriations for payments). 1.13%. 1.12%. 1.10%. 1.04%. 1.00%. 0.97 %. 4 306. 6 979 2 112. 9 247. 11899. 14 792. 3 048 8 851. 3537 11 255. Agriculture Preaccession structural instrument Phare (applicant countries) Mediterranean preaccession strategy. 1.11%. Agriculture Other expenditure. 1665 2641. 4867. 2 549 6698. Ceiling, appropriations for payments. 91482. 94 893. 102281. 105 650. 104828. 105 658. 107989. Ceiling, payments as % of GNP Margin for unforeseen expenditure Own resources ceiling. 1.13 % 0.14% 1.27 %. 1.11 % 0.16% 1.27 %. 1.17 % 0.10% 1.27%. 1.18% 0.09 % 1.27%. 1.14% 0.13% 1.27%. 1.12% 0.15% 1.27%. 0.15 % 1.27%. 1.12%. (') In accordance with Article 2 of Decision No 182/1999/EC of the European Pat 1 lament and cf the Council and Article 2 of Council Cecision No 1999/64/Euratom (0J L 26,1.2.1999, p. 1 and p.34, EUR 11 510million at cut rent prices is available for ■esearch over the period 20 3002. (2)The expenditure on pensions included under the ceiling for this leading is ca culated net o ' staff contrit utions to the relevant sehe me, up to a maximum of EUR 1 100 million at 1999 prices for the period 20CKM)6. o Including EUR 163 million in staff contributions to the pension s :heme..
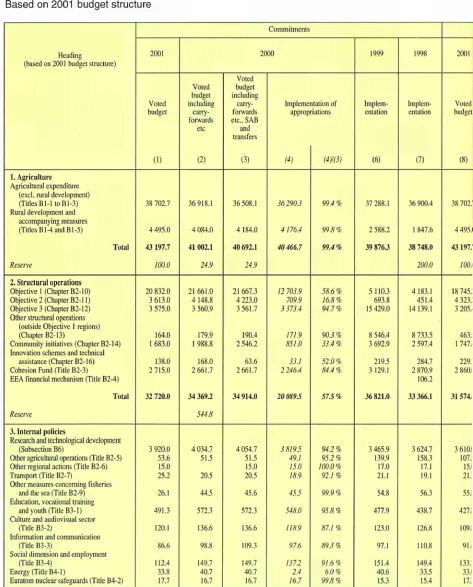
(14) 12. BUDGET IMPLEMENTATION 2000 — OVERVIEW OF COMMITMENTS AND PAYMENTS AS AT 31 DECEMBER 2000. TABLE 2 Implementation of commitments and payments as at 31 December 2000 Based on 2001 budget structure Commitments. Heading (based on 2001 budget structure). 2000. 2001. Voted budget. Voted budget including carry forwards. etc. 1. Agriculture Agricultural expenditure (excl. rural development) (TitlesBl1 loBl3) Rural development and accompanying measures (Titles Β14 and Bl5) Total Resene 2. Structural operations Objectivei (ChapterB210) Objective 2 (Chapter B211) Objective 3 (Chapter B212) Other structural operations (outside Objective 1 regions) (Chapter B213) Community initiatives (Chapter B214) Innovation schemes and technical assistance (Chapter B216) Cohesion Fund (Title B23) EEA financial mechanism (Title B24) Total. Implementation of appropriations. 1998. 2001. Implem entation. Implem entation. Voted budget. (6). (7). (8). 0). (2). (3). (4). 38 702.7. 36918.1. 36 508.1. 36 290.3. 99.4%. 37 288.1. 36 900.4. 38 702.. 4 495.0. 4 084.0. 4 184.0. 4176.4. 99.8%. 2 588.2. 1 847.6. 4 495.. 43 197.7. 41002.1. 40692.1. 40466.7. 99.4%. 39 876.3. 38748.0. 43 197.. ¡00.0. 24.9. 24.9. 200.0. 100.. 20 832.0 3 613.0 3 575.0. 21 661.0 4 148.8 3 560.9. 21 667.3 4 223.0 3 561.7. 12 703.9 709.9 3373.4. 58.6% 16.8% 94.7%. 5 110.3 693.8 15 429.0. 4183.1 451.4 14139.1. 18 745. 4323. 3 205.. 164.0 1 683.0. 179.9 1 988.8. 190.4 2 546.2. 171.9 851.0. 90.3 % 33.4%. 8 546.4 3 692.9. 8 733.5 2 597.4. 463. 1 747.·. 138.0 2 715.0. 168.0 2 661.7. 63.6 2 661.7. 33.1 2246.4. 52.0% 84.4%. 219.5 3 129.1. 284.7 2 870.9 106.2. 229. 2 860J. 32 720.0. 34 369.2. 34914.0. 20 089 J. 57J %. 36 821.0. 33366.1. 31574.. 94.2% 95.2 % 100.0% 92.1 %. 3 465.9 139.9 17.0 21.1. 3 624.7 158.3 17.1 19.1. 3 610.1 107; 15.1 21.:. (4)1(3). 544.8. Resene 3. Internal policies Research and technological development (Subsection B6) Other agricultural operations (Title B25) Other regional actions (Title B26) Transport (Title B27) Other measures concerning fisheries and the sea (Title B29) Education, vocational training and youth (Title B31) Culture and audiovisual sector (Title B32) Information and communication (Title B33) Social dimension and employment (Title B34) Energy (Title B41) Euratom nuclear safeguards (Title B42). Voted budget including carry forwards etc., SAB and transfers. 1999. 20.5. 4054.7 51.5 15.0 20.5. 3819.5 49.1 15.0 18.9. 26.1. 44.5. 45.6. 455. 99.9%. 54,8. 56.3. 55.1. 491.3. 572.3. 572.3. 548.0. 95.8%. 477.9. 438.7. 427.1. 120.1. 136.6. 136.6. 118.9. 87.1%. 123.0. 126.8. 109.;. 86.6. 98.8. 109.3. 97.6. 89 J %. 97.1. 110.8. 91.·. 112.4 33.8 17.7. 149.7 40.7 16.7. 149.7 40.7 16.7. 137.2. 91.6 % 6.0% 99.8%. 151.4 40.6 15.3. 149.4 33.5 15.4. 133.. 3 920.0 53.6 15.0 25.2. 4 034.7 51.5. 2.4 16.7. 33J 17..
(15) 13. (million EURt. Payments 2000. commitments. Payments. 1998. Implementation. Implementation. Asat 1.1.2000. Asat 31.12.2000. On pre 2000 RAL. On 2000 commitments. On pre 2000 RAL. (15). (16). (17). (18). (19). Voted budget ïcluding carryorwards etc.. Voted budget including carryforwards etc., SAB & transfers. (9). (10). (ID. (11)1(10). (13). (14). 17 023.4. 36613.4. 36329.4. 99.2 %. 37 192.1. 36962.4. 4084.0. 4 184.0. 4176.4. 99.8%. 2 588.2. 1 847.6. 11107.4. 40 797.4. 40S05.9. 993 %. 39780.3. 38 810.0. 24.9. 24.9. 9753.4 4 713.5 2 894.8. 20 103.4 4863.5 3 343.8. 15485.2 3 859 J 3 094.1. 77.0 % 79.4 % 92.5 %. 3 774.0 571.9 11 127.3. 1 056.7 3 687.4. 1 056.7 3 026.3. 980.6 2301.4. 92.8 % 76.0%. 374.4 2958.7. 227.4 2958.7. 184.7 16852. 35 438.9. 35579.8. Implementation of appropriations. Cancelled. Commitments to be paid (RAL). 1999. 105.3. 52.3. 91.7. 36 237.6. 4 176.4 105.3. 52.3. 91.7. 40 414.1. 3 521.5 407.7 11 794.6. 21 722.1 8 496.1 3 390.8. 18 587.2 5 183.2 3 647.4. 10 733.5 3 618.4 1 620.8. 4 751.7 241.2 1 473.3. 353.2 163.3 22.6. 7245.8 2059.5. 7 602.8 2271.6. 1 722.4 5 728.5. 907.8 4222.6. 920.5 2 081.7. 60.1 219.7. 5.9 55.4. 81.2% 57.0%. 169.0 1 716.0. 212.9 2448.8 106.2. 596.2 4 918.4. 392.8 5 477.7. 168.4 1 532.8. 16.3 152.4. 51.8 1.8. 77.5%. 26663.6. 28366.0. 46 574.3. 38418.7. 20676.1. 6914.7. 654.0. 200.0. 27590.8. 140.9. 4191.0 82.0 7.5 18.7. 4 085.7 84.0 17.7 16.7. 3404.0 76.4 16.8 11.9. 833% 90.9 % 95.2 % 71.4 %. 2 574.9 130.9 18.0 15.8. 3 116.3 138.3 21.2 19.3. 5 807.2 266.7 14.4 22.4. 6 100.5 207.4 6.6 28.6. 2 080.0 62.3 4.8 8.4. 1 323.9 14.0 12.0 3.5. 122.2 32.0 6.0 0.8. 34.7. 41.4. 413. 99.9 %. 35.4. 30,6. 97.8. 101.4. 39.5. 1,8. 0.6. 452.6. 547.6. 483.7. 377.6. 301.7. 409.4. 472.6. 195.6. 288.1. I.I. 125.3. 115.4. 88.2. 76.4 %. 99.1. 109.5. 111.8. 139.6. 56.3. 31.9. 2.9. 87.0. 99.7. 90.2. 903%. 90.2. 101.1. 91.2. 94.8. 48.9. 41.3. 3.8. 128.2 36.7 15.4. 127.3 36.7 19.4. 1073 28.4 18.9. 120.6 27.8 13.7. 136.9 30.2 14.2. 144.2 80.2 16.9. 139.4 52.3 13.8. 58.0 28.2 10.9. 49.3 0.2 8.0. 34.7 1.9 0.8. 883%. 84.2 % 77.4% 975%.
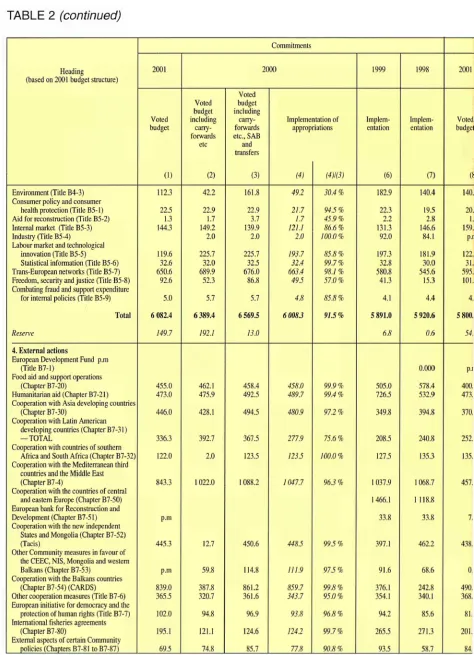
(16) 14. TABLE 2 (continued) Commitments. Heading (based on 2001 budget structure). 2000. 2001. Voted budget. Voted budget including carryforwards. etc. Environment (Title B4-3) Consumer policy and consumer health protection (Title B5-1) Aid for reconstruction (Title B5-2) Internal market (Title B5-3) Industry (Title B5-4) Labour market and technological innovation (Title B5-5) Statistical information (Title B5-6) Trans-European networks (Title B5-7) Freedom, security and justice (Title B5-8) Combating fraud and support expenditure for internal policies (Title B5-9) Total Resene 4. External actions European Development Fund p.m (Title B7-1) Food aid and support operations (Chapter B7-20) Humanitarian aid (Chapter B7-21) Cooperation with Asia developing countries (Chapter B7-30) Cooperation with Latin American developing countries (Chapter B7-31 ) — TOTAL Cooperation with countries of southern Africa and South Africa (Chapter B7-32) Cooperation with the Mediterranean third countries and the Middle East (Chapter B74) Cooperation with the countries of central and eastern Europe (Chapter B7-50) European bank for Reconstruction and Development (Chapter B7-5I) Cooperation with the new independent Stales and Mongolia (Chapter B7-52) (Tacis) Other Community measures in favour of the CEEC, NIS, Mongolia and western Balkans (Chapter B7-53) Cooperation with the Balkans countries (Chapter B7-54) (CARDS) Other cooperation measures (Title B7-6) European initiative for democracy and the protection of human rights (Title B7-7) International fisheries agreements (Chapter B7-80) External aspects of certain Community policies (Chapters B7-81 to B7-87). Voted budget including carryforwards etc., SAB and transfers. Implementation of appropriations. 1999. 1998. 2001. Implementation. Implementation. Voted budge. (6). (7). (Í. 30.4%. 182.9. 140.4. 140. 945% 45.9% 86.6% 100.0%. 22.3. 19.5. 2.2. 2.8. 131.3 92.0. 146.6 84.1. 20 1 159 p.r. 495. 85.8% 99.7% 98.1% 57.0%. 197.3 32.8 580.8 41.3. 181.9 30.0 545.6 15.3. 595. 101.. 4.8. 85.8%. 4.1. 4.4. 4.. 91.5%. 5 891.0. 5920.6. 5 800.. 6.8. 0.6. 54.. 0.000. p.i. (1). (2). (3). (4). 112.3. 42.2. 161.8. 49.2. 22.5. 22.9. 22.9. 21.7. 1.3. 1.7. 3.7. 1.7. 144.3. 149.2. 139.9. 121.1. 2.0. 2.0. 2.0. 119.6 32.6 650.6 92.6. 225.7 32.0 689.9 52.3. 225.7 32.5 676.0 86.8. 193.7 32.4 663.4. 5.0. 5.7. 5.7. 6 082.4. 6389.4. 6569.5. 749.7. 192.1. 13.0. 60083. (4)1(3). 122.. 31.. 455.0 473.0. 462.1 475.9. 458.4 492.5. 458.0 489.7. 99.9% 99.4%. 505.0 726.5. 578.4 532.9. 400. 473.. 446.0. 428.1. 494.5. 480.9. 97.2 %. 349.8. 394.8. 370.. 336.3. 392.7. 367.5. 277.9. 75.6%. 208.5. 240.8. 252.. 122.0. 2.0. 123.5. 1235. 100.0 %. 127.5. 135.3. 135.. 843.3. 1022.0. 1088.2. 1047.7. 1 037.9. 1068.7. 457.. 1466.1. 1 II X.N. 33.8. 33.8. 7.. 96.3%. p.m 445.3. 12.7. 450.6. 4485. 99.5%. 397.1. 462.2. 438,. p.m. 59.8. 114.8. 111.9. 975%. 91.6. 68.6. 0.. 839.0 365.5. 387.8 320.7. 861.2 361.6. 859.7 343.7. 99.8% 95.0%. 376.1 354.1. 242.8 340.1. 490. 368,. 102.0. 94.8. 96.9. 93.8. 96.8%. 94.2. 85.6. 81.. 195.1. 121.1. 124.6. 1242. 99.7%. 265.5. 271.3. 201.. 69.5. 74.8. 85.7. 77.8. 90.8%. 93.5. 58.7. 84..
(17) 15. (million EUR) Payments 2000. Voted budget ncluding carryorwards etc.. Voted budget including carryforwards etc., SAB & transfers. Implementation of appropriations. Commitments to be paid (RAL). 1999. 1998. Implementation. Implementation. Asat 1.1.2000. Asat 31.12.2000. Cancelled commitments. Payments. On pre 200ORAL. On 2000 commitments. On pre 2000 RAL. (9). (10). (U). (¡1)1(10). (13). (14). (15). (16). (17). (18). (19). 104.1. 150.9. 103.0. 68.2%. 121.0. 121.5. 335.4. 261.0. 79.1. 23.9. 20.6. 20.1 1.7 155.6 98.8. 20.1 3.7 155.7 103.8. 15.1 1.7 1285 103.7. 74.9 % 45.9% 825% 99.9 %. 19.0 2.2 119.8 83.8. 18.6 2.8 133.1 42.2. 20.7. 26.1. 10.6. 1.2. 206.4 164.4. 179.2 62.1. 92.8 101.7. 4.5 1.7 35.6 2.0. 19.9 0.7. 113.1 30.5 542.5 61.9. 108.0 30.5 565.5 69.8. 463 27.9 507.6 56.6. 42.9% 91.4% 89.8 % 81.1%. 116.4 27.2 445.7 30.8. 89.8 25.4 410.6 8.3. 226.0 37.8 1094.5 75.9. 370.8 40.7 1241.3 60.7. 30.4 21.3 307.1 34.8. 16.0 6.6 200.6 21.9. 2.6 1.6 8.9 8.1. 5.4. 5.4. 3.3. 61.6%. 3.2. 7.0. 4.2. 5.7. 2.0. 1.3. 0.1. 6312.8. 6405.1. 83.7%. 4473.1. 4878.5. 9 227.6. 9604.6. 3 272.7. 2 088.0. 270.7. 82.4. 11.0. 1.6. 0.4. 366.0 589.4. 439.7 547.0. 437.1 540.9. 99.4 % 98.9%. 379.5 575.0. 341.8 501.7. 1 203.8 493.5. 1 126.4 424.9. 407.8 311.3. 29.7 229.6. 97.9 17.4. 325.1. 331.3. 323.4. 97.6%. 290.6. 236.1. 2 022.6. 2 129.0. 294.7. 28.6. 51.2. 226.0. 215.0. 1952. 90.8%. 181.8. 142.8. 1 183.3. 1 225.3. 149.5. 45.6. 40.7. 91.4. 131.6. 110.1. 83.7%. 100.0. 84.5. 420.3. 433.6. 109.8. 0.3. 0.1. 437.1. 512.7. 473.0. 923%. 378.5. 421.9. 3 267.6. 3 615.9. 397.4. 75.5. 226.5. 1 170.0. 1 032.7. 55.5. 5360.8. 6.4. 6.4. 6.4. 100.0%. 5.4. 4.4. 57.7. 51.3. 6.4. 429.7. 433.4. 429.0. 99.0 %. 514.6. 399.9. 1 465.7. 1 429.9. 420.0. 8.7. 48.0. 133.5. 126.0. 94.4 %. 29.9. 69.2. 42.0. 27.9. 41.0. 85,0. 352.9 381.2. 744.9 350.1. 676.4 278.2. 90.8 % 79.5 %. 250.7 314.7. 122.4 281.6. 833.6 684.1. 1009.0 719.9. 369.6 222.2. 306.8 56.0. 7.9 29.8. 98.9. 91.9. 53.2. 57.9%. 47.0. 65.9. 187.1. 217.4. 47.7. 5.5. 10.3. 125.6. 129.4. 127.3. 98.4 %. 271.1. 272.9. 25.1. 21.1. 6.1. 121.3. 0.9. 100.2. 62.0. 41.6. 67.2 %. 48.9. 59.2. 182.1. 199.6. 31.7. 9.9. 18.6.
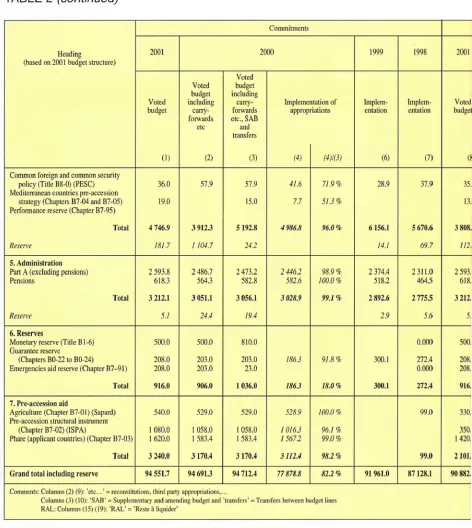
(18) 16. TABLE 2 (continued) Commitments. Heading (based on 2001 budget structure). 2000. 2001. Voted budget. Voted budget including carry forwards. etc. Common foreign and common security policy (Title B80) (PESO Mediterranean countries preaccession strategy (Chapters B704 and B705) Performance reserve (Chapter B795). Voted budget including carry forwards etc., SAB and transfers. Implementation of appropriations. (1). (2). (3). (4). 36.0. 57.9. 57.9. 41.6. 71.9%. 15.0. 7.7. 51.3%. 19.0. (4)1(3). (6). (7). 28.9. 37.9. G. 35.. 13.. 112.. 98.9% 100.0%. 2 374.4 518.2. 2311.0 464.5. 2 593. 618.. 99.1%. 2 892.6. 2 775.5. 3 212.. 24.2. 2 593.8 618.3. 2486.7 564.3. 2 473.2 582.8. 2446.2 582.6. 3 212.1. 3 051.1. 3056.1. 3028.9. 5.1. 24.4. 19.4. Monetary reserve (Title Β16) Guarantee reserve (Chapters BO22 to B024) Emergencies aid reserve (Chapter B791). 500.0. 500.0. 810.0. 208.0 208.0. 203.0 203.0. 203.0 23.0. 1863. 91.8%. Total. 916.0. 906.0. 1036.0. 186.3. 18.0%. 540.0. 529.0. 529.0. 528.9. 100.0 %. 1 080.0 1 620.0. 1 058.0 1 583.4. 1 058.0 1 583.4. 10163 1567.2. 96.1% 99.0%. 3 240.0. 3 170.4. 3170.4. 3112.4. 98.2%. 94 551.7. 94 691J. 94712.4. 77878.8. 82.2%. Resene. Voted budget. 69.7. I 104.7. Total. Implem entation. 14.1. 18Í.7. 5. Administration Part A (excluding pensions) Pensions. Implem entation. 3 808.. 5192.8. Resene. 2001. 5 670.6. 3 912 J. 4986.8. 1998. 6 156.1. 4 746.9. Total. 1999. 96.0%. 2.9. 5.6. 5.. 6. Reserves. 7. Preaccession aid Agriculture (Chapter B701) (Sapard) Preaccession structural instrument (Chapter B702) (ISPA) Phare (applicant countries) (Chapter B703). Total Grand total including reserve. Comments: Columns (2) (9): 'etc... ' = reconstit itions, third part) appropriations. Columns (3) (10): 'SAB' = Supplerr entary and amen ding budget and 'transfers' = Traiisfers between b ldget lines RAL: Columns (15) (19): 'RAL' = Reste à liquider'. o.ooo. 500.. 300.1. 272.4 0.000. 208. 208.. 300.1. 272.4. 916.. 99.0. 330. 350. 1420.. 91 961.0. 99.0. 2101,. 87128.1. 90882..
(19) 17. (million EUR) Payments 2000. Voted budget ncluding carry: orwards etc.. Voted budget including carryforwards etc., SAB & transfers. Implemet tation of appropt ¡alums. Commitments to be paid (RAL). 1999. 1998. Implementation. Implementation. Asat 1.1.2000. Asat 31.12.2000. Cancelled commitments. Payments. On pre 2000 RAL. On 2000 commitments. On pre 2000 RAL. (9). (10). (ID. (11)1(10). (13). (14). (15). (16). (17). (18). (19). 38.4. 38.4. 23.2. 605%. 28.0. 28.2. 15.3. 32.3. 3.7. 19.5. 1.5. 558.4. 7.7. 2.0. 2.3 3841.0. 12084.0. 12671.3. 2 819.0. 1022.0. 2 328.3 463.3. 233.1 0.1. 227.2 0.1. 192.5 0.0. 2 215.0 580.6. 2 835.6. 2 791.5. 233.2. 227.3. 192.6. 2 795.6. 2.9. 5.6. 91.8%. 300.1. 272.4. 186.3. 18.0%. 300.1. 272.4. 186.3. 92.1%. 4585.8. 4 067.7. 3.7. 5.1. 88.8 % 99.6 %. 2 317.6 518.0. 90.7%. 3616.2. 4169.0. 274.;. 32.4. 2724.0 564.4. 2 710.5 582.9. 2407.7 580.6. 3288.4. 3293.5. 2988.3. 24.4. 19.4. 500.0. 810.0. 203.0 203.0. 203.0 23.0. 1863. 906.0. 1036.0. ¡86.3. 200.0. 150.0. 245.0 1 254.4. 175.0 1 254.4. 25 1200.9. 15% 95.7 %. 1699.4. 1579.4. ¡ 203.4. 76.2%. 92915.8. 92947.9. 81 676.5. 87.9%. 99.0. 78 646.6. 528.9 3 042.2. 1 013.7 3 358.2. 1 114.4. 2.5 86.5. 50.3. 99.0. 3 042.2. 4900.9. 1114.4. 89.1. 50.3. 79 496.3. 71266.6. 65875.1. 28 166.5. 53 509.7. 1533.4.
(20) 18. BUDGETARY PROCEDURE FOR 2000. The preliminary draft budget On 28 April, the Commission adopted the preliminary draft budget for 2000 based on the guidelines it approved on 3 February and on which Parliament passed a resolution on 23 March. For the first year of the new financial perspective period (2000-06), the Commission took into account the Agenda 2000 priorities and the conclusions of the Berlin European Council, as well as the need to conduct a tight budgetary policy. Compared with the 1999 budget, the preliminary draft budget for 2000 represented a 4.4 % reduction in terms of commitments (EUR 92 706 million), while the increase in appropriations for payments was confined to 4.7 % (EUR 89 584 million), to cover the large volume of outstanding commitments which has built up for the Structural Funds, research and external action. Payments represented 1.11 % of the GNP of the 15 Member States, and were still around EUR 1 800 million beneath the ceiling for payment appropriations agreed in Berlin for 2000. The revenue required to finance the preliminary draft budget represented 1.11 % of GNP. In the case of agricultural expenditure (EUR 41 401 million, including the monetary reserve of EUR 500 million), budgetary discipline was tightened and the proposals in the preliminary draft complied with the subceilings for the heading, which now covers rural development (EUR 3 587 million) as well as traditional market measures (EUR 37 314 million). As 2000 is the first year of a new programming period, the commitment appropriations for structural operations (EUR 32 678 million) were lower than the exceptionally large amounts in 1999 (EUR 39000 million), whereas payment appropriations (EUR 32 000 million) were again increased (up by 5.2 %) in. order to be able to clear past commitments. EUR 1 641 million was planned for Community initiatives in accordance with the guidelines set by the Berlin European Council for the overall allocation for the Structural Funds. This did not take account of the URBAN Community initiative, which increased the percentage of the total allocation accounted for by Community initiatives from 5 % to 5.35 %. Resources for internal policies (EUR 5 937 million in commitment appropriations) were concentrated on a number of top priorities, in view of their multiplier effect on growth and employment and on the development and dissemination of new technologies. Research received EUR 3 630 million in commitment appropriations and EUR 3 600 million in payment appropriations, a sharp rise (approximately 20 %) due to the volume of outstanding commitments. The second major item of expenditure was the trans-European networks (EUR 656 million in commitment appropriations, an increase of 12.1 %), in line with recent decisions on the multiannual budget. Finally, there was also a marked increase (4.7 %) for education, vocational training and youth policy, bringing commitment appropriations to EUR 463 million. The Commission also allowed for the budgetary implications of the ratification of the Treaty of Amsterdam, in particular in the fields of justice and home affairs, for which appropriations increased by almost 36 %. In accordance with the new financial perspective, the pre-accession strategy was reflected in a new Heading 7, which had its allocation of EUR 3 167 million boosted by the creation of two specific instruments for agriculture and structural measures, the beefing-up of the Phare programme and the coordination of these operations. The appropriations for Heading 4 (external action), now without the Phare programme, came to EUR 4 479 million, a reduction of.
(21) 19. 1.2 % in commitment appropriations compared with 1999 (despite the transfer of EUR 143 million from the emergency aid reserve to humanitarian aid) but an increase of 5.4 % in payment appropriations in order to help clear outstanding commitments. A margin of EUR 147 million was left beneath the ceiling fixed by the Berlin European Council so that the financial impact of a possible fisheries agreement with Morocco could be accommodated in the autumn letter of amendment. Chapter B7-54 (Cooperation with the countries of the Balkans) was allocated EUR 279 million as against EUR 314 million in 1999, because of the gradual reduction in the programme for refugees in Bosnia-Herzegovina. This conservative evaluation of requirements was to be subsequently adjusted to take account of the Kosovo crisis.. The draft budget (first reading by Council) The draft budget established by the Council at first reading on 16 July came to EUR 92 361 million in appropriations for commitments and EUR 87 945 million in appropriations for payments. Total appropriations for payments represented 1.09 % of Community GNR Compared with the 1999 budget, these figures represented a reduction of 4.7 % in appropriations for commitments and an increase of 2.8 % in appropriations for payments. Compared with the preliminary draft budget, they represented a reduction of EUR 424 million in commitment appropriations and EUR 1 718 million in payment appropriations. A point to be stressed as regards external action was the establishment of a reserve for the reconstruction of Kosovo containing EUR 500 million in commitment appropriations and over EUR 280 million in payment appropriations. The establishment of this reserve was made possible by redeployment of funds within Heading 4, namely by making an across-the-board cut in appropriations. allocated to most of the other budget headings relating to external action.. First reading by Parliament After Parliament's first reading on 28 October, the draft budget came to EUR 93 562 million in appropriations for commitments and EUR 91 288 million in appropriations for payments, a fall of 3.4 % and an increase of 6.7 % respectively compared with the 1999 budget. Parliament considered that appropriations for the European Union's operations in response to events in Kosovo, Turkey and East Timor and for the fisheries agreement still to be concluded with Morocco should be in addition to those for the external operations already planned and that the financial perspective should be revised. It adopted a draft budget that used up virtually all the payment appropriations allowed by the financial perspective, but did not take any of these four sectors into account.. Second reading by Council The Council's second reading, on 26 November, was preceded by a conciliation meeting with Parliament. At EUR 92 520 million in appropriations for commitments and EUR 87 910 million in appropriations for payments, the Council draft was far lower than Parliament's first reading and the Commission's proposals in letter of amendment No 4. As regards external action, which was at the centre of negotiations on the 2000 budget, the Council's approach was to allocate EUR 360 million for reconstruction in Kosovo — EUR 140 million was to be financed by carrying over EUR 30 million for Obnova from 1999 and EUR 30 million for humanitarian aid, transferring EUR 60 million from Obnova to reconstruction in Kosovo and allocating.
(22) 20. EUR 20 million to humanitarian aid and the remaining EUR 220 million was to be redeployed within the heading. The Council also restored the EUR 125 million which it had decided for the fisheries agreement with Morocco at its first reading, set up a heading to cover operations in favour of East Timor and provided aid for Turkey.. Second reading by Parliament Parliament adopted the 2000 budget during its second reading, on 16 December 1999, after tough negotiations continued right up to the vote. The disagreement on how to finance reconstruction in Kosovo and the other priorities in the heading was finally resolved by an overall compromise under which the whole EUR 200 million allowed by the interinstitutional agreement would be drawn under the flexibility instrument and the question of revision of the financial perspective was to be reconsidered in the more general context of funding for the aid programme for the western Balkans over the period 2000-06. Under this compromise, Parliament reduced the level of payment appropriations by EUR 1 900 million compared with itsfirstreading. The 2000 budget totalled EUR 93 280 million in appropriations for commitments, 3.5 % less than in 1999, and EUR 89 387 million in appropriations for payments, an increase of 4.4 %. Agricultural expenditure came to EUR 40 994 million. Expenditure on market organisations had been set by the Council at EUR 36 889 million and Parliament decided on EUR 4 105 million for rural development and accompanying measures. At EUR 32 678 million, the commitment appropriations for structural operations were at the same level as the Commission proposed in its preliminary draft. However, the final figure for payment appropriations was EUR 31 802 million after Parliament eventually accepted a rate of pay-. ments on account of 3.5 % and kept the level of cover for outstanding commitments at 50%. Commitment appropriations for internal policies were kept at the same level as in Parliament's first reading, while payment appropriations for research were reduced by EUR 9.5 million. The allocation for this heading thus totalled EUR 6 027 million in commitment appropriations and EUR 5 674 million in payment appropriations. The biggest changes were for external action, the focal point of the 2000 budget procedure. Finally, the heading totalled EUR 4 805 million in commitment appropriations, 2.9 % up on 1999 (2.4 % in the preliminary draft), and EUR 3 613 million in payment appropriations. After considerable redeployment within the heading, requirements were met for aid for East Timor (EUR 20 million), Turkish earthquake victims (EUR 30 million), the pre-accession strategy for Malta and Cyprus (EUR 15 million in reserve) and the fisheries agreement with Morocco (EUR 125 million). The 2000 budget also covered immediate requirements for reconstruction in Kosovo. After the entire EUR 200 million had been drawn under the flexibility instrument, EUR 360 million have been provided. In 2000, reconstruction in Kosovo would be financed as follows: the specific budget heading has been allocated EUR 240 million, EUR 60 million have been carried over from 1999 to 2000 (EUR 30 million for Obnova and EUR 30 million for humanitarian aid), EUR 20 million from the ECHO budget was earmarked for humanitarian aid operations in Kosovo and finally EUR 40 million have been transferred in the course of the year as funds became available. As regards the pre-accession instruments, the payments for the Phare programme were reduced by EUR 66 million as proposed by the Council, the payment appropriations for the agricultural pre-accession instrument were re-.
(23) 21. duced by EUR 329 million after the appropriations allocated were differentiated, and a new heading with a token entry was entered for Malta and Cyprus (with the allocation of EUR 15 million still coming under Heading 4 of the financial perspective).. Supplementary and amending budgets The Commission adopted preliminary draft supplementary and amending budget No 1/2000 on 10 May. The Council established the draft on 16 June and Parliament adopted it on 6 July. As no changes were made to it by the Council (budget) on 20 July, it was finally adopted on 2 August. It incorporated, under the revenue section, the balance from 1999, the new estimates of own resources made in April 2000, the final calculation of the UK compensation for 1996 and the provisional calculation for 1999. Under expenditure, it covered the extra EUR 1 million for the European Agency for the Evaluation of Medicinal Products for orphan drugs, the entry of EUR 11 million for provisional civilian administrations (offset by an equivalent decrease in the appropriations set aside for an instrument to promote investment in developing countries for which the legal base is unlikely to be adopted) and EUR 20 million for macrofinancial aid for Montenegro. Finally, lines with a token entry. were created for the future rapid reaction force pending adoption of the legal base. The Commission adopted preliminary draft supplementary and amending budget No 2/2000 on 23 June 2000. The Council established the draft on 29 June and Parliament adopted it on 6 July. In the second supplementary and amending budget, EUR 15 million was added to Section I (Parliament) for its building policy, and EUR 6.6 million to Section II (Council) for the European common foreign and security policy, particularly with a view to reinforcing the staff of its General Secretariat with military experts seconded from the Member States. In a resolution adopted on 16 June, Parliament had requested a supplementary and amending statement of estimates of EUR 15 million to increase the appropriations available for the acquisition of immovable property.. Implementation of the 2000 budget Implementation of commitment and payment appropriations — 2000 outcome (summary) The following table provides the summary situation for implementation, in percentage terms, by budget heading, with the comparison to 1999..
(24) 22. Implementation of commitment appropriations. Implementation of payment appropriations. (%). (%). 1999. 2000. 1999. 2000. Heading 1. 98.6. 99.4. 98.3. 99.3. Heading 2. 94.0. 57.5. 87.0. 77.5. Heading 3. 96.0. 92.7. 85.3. 84.0. Heading 4. 94.3. 96.2. 90.1. 92.2. Heading 5. 98.0. 99.1. 89.3. 90.5. Heading 6. 35.5. 18.0. 35.5. 18.0. Total. 76.4. 98.3. Heading 7 95.7. Unutilised budget appropriations for commitments of EUR 14800 million for structural operations (out of an amount of EUR 16700 million unutilised for the total budget) is the major contributory factor to the low implementation rate of 82.4 % for the total budget. A similar, but less significant effect is also seen for payments where the unutilised payment appropriations for structural operations is responsible for EUR 8000 million of the EUR 11 200 million unutilised total budget funds, and the subsequent implementation rate of 88.0 % for the total budget.. Agriculture (Heading 1) The implementation rates for both commitments (99.4 %) and payments (99.3 %) for agriculture spending were particularly high, both for the EAGGF Guarantee operations and for rural development. For this heading, the overall situation of the agricultural markets was normal which explains why expenditure was close to the budget appropriations. As concerns rural development, most of the programmes presented by Member States could be adopted before the end of the budgetary year, and as a result, expenditure (EUR 92.4 million or 2.3 %) was slightly above the initial appropriations (but still below the. 82.4. 92.0. 88.0. Berlin ceiling). The appropriations have been reinforced by a transfer from subheading la.. Structural operations (Heading 2) Structural Funds. With regard to the low implementation rate for commitments, 2000 was the first year for the new structural operations programme (2000-06). The need to determine the framework for the various programmes is important for both the Commission and the Member States in order to ensure that a sound basis is established for the financial assistance actions during the next seven years. Because of this factor, and the introduction of revised rules and procedures for the new programme, delays were experienced in the negotiations between the Commission and the Member States, particularly for Objectives l and 2 (EUR 12500 million unutilised). For Community initiatives (EUR l 700 million unutilised), the specific difficulties to commit before year-end were related to the fact that the guidelines were only published in May. The level of anticipated commitments was therefore not possible to be made before the year-end, although the procedures on approving some programmes were close to finalisation..
(25) 23. Decisions on programmes for Objective 3 could be adopted before year-end, and resulted in a high implementation rate for this budget chapter. With regard to the unutilised appropriations for Structural Funds, EUR 8 200 million was carried forward to the 2001 budget year. An amount of EUR 6200 million will be transferred to subsequent years in excess of the ceiling of Heading 2, in conformity with Article 17 of the Interinstitutional Agreement. In summary, the overall under-implementation of payments for the Structural Funds added up to EUR 6700 million. The main component was EUR 4 200 million of payments relating to pre-2000 programmes. In addition, 'advance payments on account' were only possible for programmes approved in 2000. Practically no reimbursements were made to Member States for the new 2000-06 programming period.. entate measures and to re-examine certain actions. This applied within the Energy and Transport DG for energy policy and within the Enterprise DG for SME multiannual programmes and standardisation; D the late adoption of the legal basis for expenditures, which prevented commitments being made before year-end and was carried forward into 2001. This was seen in the Environment DG and the Justice and Home Affairs DG. The amount of unutilised payment appropriations was EUR 1 000 million with a resulting implemented rate of 84.0 %. This amount was caused by the factors discussed above for the under-implementation of commitments and also a lower level of expected payments (EUR 670 million) for the budget subsection for RTD, where the liquidation of projects from previous framework programmes and advance payments for the current year's programme were less than forecast.. Cohesion Fund. Decisions on projects for the Cohesion Fund could be adopted before year-end, with the result of a high implementation rate for commitments (91.3 %). The late approval at year-end meant that only marginal advance payments were made in 2000 and so payments were mainly made on earlier approved projects, resulting in an overall low implementation rate for payments (57 %).. Internal policies (Heading 3) The amount of unutilised commitment appropriations of some EUR 470 million within internal policies meant the implementation rate was 92.7 % mainly caused by the following factors: D certain Commission services were reorganised during the year and, as part of this exercise, the opportunity was taken to reori-. External actions (Heading 4) The implementation rate for commitment appropriations for this heading was 96.2 % and in fact the implementation rate for most budget chapters was high, for example, the rate for the chapter for cooperation with the Balkan countries was 99.8 %. One exception to the high implementation rates was the chapter for cooperation with Latin American developing countries, with EUR 90 million of unutilised appropriations, caused by difficulties in programming. The implementation rate for payment appropriations was lower at 92.2 %, or some EUR 325 million. This was caused by the late approval of commitments at year-end preventing payments being made, for example, the budget chapter for cooperation in the Balkan countries..
(26) 24. Pre-adhesion aid (Heading 7) The implementation rates for all chapters were high, resulting in an implementation rate of 98.3% for Heading 7.. The implementation rate for payments was lower at 76.4 %, due to the budget chapter for Sapard, where the precondition of an authorised paying agent in each of the beneficiary countries was not met, and for ISPA where the late commitments did not result in any advance payments before year-end..
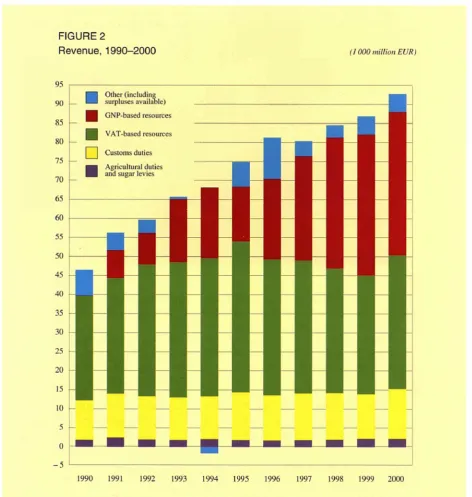
(27) EU REVENUE IN 2000. The budget of the European Union is financed from a number of sources. The breakdown of the 2000 total revenue of EUR 92700 million on the different sources is shown in the attached Figures.. Traditional own resources The EU's traditional own resources are made up of customs duties, agricultural duties and sugar levies. They are established by the Member States, which keep 10 % to cover their collection costs.. 25. levies offset expenditure of virtually the same amount. In 2000 revenue from this source amounted to EUR 1 077.1 million, practically the same as the previous year (- 0.6 %).. FIGURE 1 Revenue of the Communities, 2000 37.9 %. 14.1%. 40.5 %. Customs duties are levied on imports of nonagricultural products from third countries, at rates based on the Common Customs Tariff. These rates are often subject to reductions as a result of agreements in the framework of the World Trade Organisation (WTO), previously the General Agreement on Tariffs and Trade (GATT), and specific agreements granting preferential tariffs to certain trading partners or products. In 2000, EUR 13 111.5 million was collected and paid to the EU, which corresponds to an increase of 12.0 % compared to the previous year. The reason for this considerable increase is the surge in imports between 1999 and 2000 (over 30 %), which more than offset the decrease in the weighted average tariff.. |. Agricultural duties and sugar levies. J Customs duties I VAT-based resources J GNP-based resources J Other (including surpluses available). VAT-based own resources. Agricultural duties are charged on imports of agricultural products from third countries. In 2000, EUR 1 078.6 million was collected and paid to the EU. The yield was virtually the same as in the previous year (+ 0.9 %).. The VAT-based own resources are calculated by applying a uniform rate to the harmonised national VAT bases, which are determined in accordance with Community rules. Member States' VAT bases are capped at 50 % of their GNP. In 2000, five Member States (Greece, Spain, Ireland, Luxembourg and Portugal) benefited from this limit.. Producers of sugar, isoglucose and insulin syrup pay levies on production to cover market-support arrangements and to finance a system for the equalisation of sugar-storage costs, thus ensuring that sugar supplies reach the market steadily throughout the year. These. The uniform rate is obtained by deducting the so-called gross equivalent of the UK correction (expressed in percentage terms of the EU capped VAT base) from the maximum rate of call of VAT. In accordance with the decision on the system of the European Communities'.
(28) 26. own resources (94/728/EC, Euratom), the maximum rate is set at 1 % of the harmonised capped VAT bases. The uniform rate amounted to 0.8766 % in 2000. Payments during a given year derive from the forecasts for the VAT bases entered in the budget for that year and the negative or positive adjustments for previous years established using the out-turn figures for these bases. In 2000, the VAT resource amounted to EUR 35 192.5 million. This included net positive adjustments for previous years totalling EUR 1 004.9 million, the budget forecasts having underestimated economic growth.. GNP-based own resources A source of revenue based on GNP was introduced in 1988 to balance budget revenue and expenditure, i.e. to finance the part of the budget not covered by other revenue. It consists of a uniform rate applied to the sum of all Member States' GNP established in accordance with Community rules. The rate is fixed during the budgetary procedure and depends on the total of other revenue. In 2000, the call rate of this additional resource amounted to 0.4461 % of total EU GNP (not including the EAGGF monetary reserve, the loan guarantee reserve and the emergency aid reserve). In total, the GNP resource amounted to EUR 37 580.4 million (not including reserves). This included net positive adjustments for previous years totalling EUR 327.3 million, the budget forecasts having underestimated economic growth.. The correction in favour of the United Kingdom The UK correction was introduced to correct the imbalance between the United Kingdom's share in the payments to the Community budget and its share in Community expenditure in the Member States. This imbalance is calculated according to precise rules and the United Kingdom is reimbursed for 66 % of the difference. The cost of the correction is borne by the other Member States according to their share in Community GNP, with the exception of Germany that pays only two-thirds of its normal share. The correction for a certain year n is budgeted and financed in the following year. The result of the definitive calculation, based on final data, for the correction of year /; is budgeted in year // + 4. The provisional correction for 1999, budgeted and paid in 2000, amounted to EUR 3 636.0 million.. Other revenue The general budget is also financed by other revenue, including inter alia tax and other deductions from staff remuneration, bank interest, contributions from non-member countries to research programmes, repayments of unused aid and interest on late payments. Together, these sources generated revenue amounting to EUR 1 546.1 million. The revenue for 2000 also includes the EUR 3 209.1 million surplus carried over from 1999..
(29) 27. FIGURE 2 Revenue, 1990-2000. (1000 million EUR). 95. rtl ■ I. Other (including surpluses available). 90. GNP-based resources. 85 -. VAT-based resources 80. -. 75. -. I Customs duties Agricultural duties and sugar levies. 70 -. τ. 65 60 55 50. I I I. 45 40 35 30 25 20. III! ■ II I I I. 15 10. -5 1990. 1991. 1992. 1993. 1994. 1995. 1996. 1997. 1998. 1999. 2000.
(30) 28. EU EXPENDITURE — ENLARGEMENT IN 2000 (SAPARD, ISPA, PHARE). The European Union has set up three financial assistance programmes to help the candidate countries of central and eastern Europe (Bulgaria, the Czech Republic, Estonia, Hungary, Latvia, Lithuania, Poland, Romania, Slovakia and Slovenia) prepare for accession. Sapard (support for pre-accession measures for agriculture and rural development) focuses on modemising the structure of agricultural holdings, improving processing and distribution structures, developing inspection activities and rural development. ISPA (instrument for structural policies for pre-accession) supports infrastructure in the fields of transport — rehabilitation and construction of new infrastructure in the candidate countries and linking it to the transport infrastructure system within the Union, and environment — measures enabling the beneficiary countries to comply with the requirements of Community environmental law. Phare (originally aid to Poland and Hungary for restructuring of the economy but now greatly expanded) supports building up the. administrative and institutional capacities of the applicant countries and financing investments designed to help them comply with Community law as soon as possible. Phare funding may also be used to finance the measures in the fields of environment, transport and agricultural and rural development which form an incidental but indispensable part of integrated industrial reconstruction or regional development programmes. The Commission ensures coordination and coherence between assistance granted in the framework of the pre-accession strategy under the three instruments.. Sapard Sapard (Community support for pre-accession measures for agriculture and rural development in the applicant countries of central and eastern Europe in the pre-accession period) sets as its main priorities to contribute to the implementation of the acquis concerning the common agricultural policy and related poli-.
(31) 29. cies and to solve priority and specific problems for the sustainable adaptation of the agricultural sector and rural areas in the applicant countries. To achieve these objectives the Sapard regulation provides a menu of 15 measures. These include many that are similar to those available to Member States under Community cofinanced agricultural and rural development programmes, as well as a limited number that aim at building capacity to implement the acquis such as to improve structures for quality, veterinary and plant health controls, setting up producer groups, and land registers. In addition to the specific priorities set for Sapard, an underlying objective is to develop the institutional and administrative capacity in the applicant countries to manage Community rural development and structural measures from the date of accession. The Sapard regulation applied from 1 January 2000. By the end of 2000, although support in terms of expenditure under that regulation had not yet been granted, a considerable amount of work had been accomplished to prepare for its implementation in applicant countries. The year 2000 was mainly spent preparing the legal framework allowing Sapard to be applied on a decentralised basis, and to approve the programmes for agricultural and rural development on the basis of plans presented by the 10 applicant countries. The Commission adopted, on 29 November 2000, the texts of multiannual and annual agreements, and authorised signature on behalf of the Commission with each of the applicant countries. Sapard budgetary allocations for commitments in the 2000 budget were set at EUR 529 million of which EUR 519.1 million was for operational expenditure, and EUR 9.9 million for technical assistance. Allocations for payments were EUR 190.1 million for operations and EUR 9.9 million for technical assistance.. The Sapard instrument requires the management of a huge number of projects. As with all agricultural and rural development programmes such projects are generally small because of the size of the beneficiary enterprises. Consequently, delegation of management from the Commission to the applicant countries of such programmes is a practical necessity. Well over 1 000 national officials are expected to be employed in the applicant countries to apply Sapard.. Indicative allocation by beneficiary country of the maximum annual amount in 1999 prices (EUR). Amount. Country Bulgaria Czech Republic Estonia Hungary Latvia Lithuania Poland Romania Slovakia Slovenia. 52 124 000 22 063 000 12 137 000 38 054 000 21848 000 29 829 000 168 683 000 150 636 000 18 289 000 6 337 000. Total. 520000 000. The Sapard programmes The Commission approved the Sapard programmes for each of the applicant countries between October and December 2000. Although the balance between measures differs from programme to programme, in virtually all of them three measures dominate, namely, processing and marketing, investment in agricultural holdings and investment in rural infrastructures..
(32) 30. Improving the processing and marketing of agriculture and fishery products This measure is included in all 10 Sapard programmes. In global financial terms it is the most important one amounting to EUR 954 million (representing 26 % of the expected total Community contribution). It is the largest measure for the Czech Republic (25 %), Latvia (26 %), Poland (38 %) and Slovenia (40 %). For the remaining countries this measure always assumes the second position: Bulgaria (24 %), Estonia (18 % — exaequo with measure for diversification of economic activities), Hungary (21 %), Lithuania (21 %), Romania (17 %) and the Slovak Republic (26 %). This data provides an idea of the importance given by the applicant countries to the processing and marketing measure as a way to help the upgrading, adaptation, rebuilding or creation of foodstuff industries. This will assist these countries to restructure their agricultural sectors, to improve the quality of the relevant products (complying with the Community standards) and to compete more effectively at the Community level. Representative examples of possible eligible investments include: construction or renovation of buildings; investments in food-processing establishments to meet Community requirements; new (and subject to specific rules possibly also second hand) machinery and equipment (including computer software); milk tanks and coolers; storage facilities (including cold stores) and container washing facilities; waste and by-products treatment equipment as well as equipment for quality improvement and improved control of the production process.. Investments in agricultural holdings All 10 Sapard programmes include the measure on support for investments in agricultural holdings. This measure is programmed to absorb 22 % of the total Community contribution. It is therefore, in global financial terms (all 10 countries together), the second most important measure. It is the largest measure for several countries: Lithuania (47 %), Estonia (43 %), Bulgaria (31 %), Hungary (28 %) and the Slovak Republic (28 %). The importance of the budget earmarked for this measure in the programmes reflects the need for modernisation of agriculture and its adaptation to Community requirements. The measure aims at increasing the competitiveness of agricultural holdings, through improvements in their fixed assets and equipment, improvements in the quality of their products and redeployment of production according to market needs and to contribute to diversification of farm activities. An objective is also to help the adaptation of agricultural holdings to Community standards regarding environment, hygiene and animal welfare. Representative examples of possible eligible investments include construction or renovation of farm buildings, purchase of agricultural machines and equipment, animal wastetreatment facilities, construction or upgrading of fodder storage facilities, construction or renovation of facilities for on-farm milk or meat processing.. Development and improvement of rural infrastructure Poor infrastructure and its associated implications for economic development have been key concerns for all applicant countries. Overall, 21 % of the Community contribution will be directed towards the measure concerning.
(33) 31. the development of rural infrastructure. In both Poland and Romania, 28 % of their respective programmes will be dedicated to a range of rural infrastructure developments. In both programmes, improvements in infrastructure are seen as prerequisites for rural development. In the case of Poland, an insufficient level of technical infrastructure in rural areas constitutes one of the main barriers to development. For example, only 50 % of rural households had telephones (a significant barrier to business development); and only 5.8 % of rural households were connected to sewage networks at the end of 1998. In addition, only a third of rural households used official dumping sites. It has been estimated that a similar proportion of Poland's electricity supply network in rural areas needs urgent modernisation. In Romania, the rural population frequently has no access to piped water. The wells do not, in addition to access problems, provide an adequate quality of water. Reflecting these problems, four main types of infrastructure are covered to varying degrees by the Sapard programmes. These are investments in (i) water and waste management (ii) roads (iii) electricity supply and (iv) rural telecommunications. All the programmes (with the exception of the Slovak Republic and Slovenia) make provision for investments in water supply and waste management, and roads. In the case of the latter, the programmes for the Baltic States include provision for access roads both to farms and in some cases to rural enterprises. Reinforcement of the electricity supply network is included in the programmes for the Czech Republic (where provision is also made for the development of renewable energy sources), Estonia, Hungary, Lithuania and Poland. The last four programmes also include provision for improving rural telecommunications.. Other measures are: D forestry, including afforestation of agricultural areas, investment in forest holdings owned by private forest owners and processing and marketing of forestry products; D development and diversification of economic activities, providing for multiple activities and alternative income; D improvement of vocational training; D renovation and development of villages and the protection and conservation of the rural heritage; D agricultural production methods designed to protect the environment and maintain the countryside; D improving the structures for quality, veterinary and plant-health controls, for the quality of foodstuffs and for consumer protection; D agricultural and water resources management; D setting up producer groups; D land improvement and re-parcelling; D technical assistance for the measures covered by the Sapard Regulation (EC) No 1268/1999, including studies to assist with the preparation and monitoring of the programme, information and publicity campaigns. All Sapard programmes include at least four categories of expenditure as follows: information and publicity; monitoring of programme implementation and support for the activities of the monitoring Committee; programme evaluations and studies; training and the use of experts..
(34) 32. ISPA The 'instrument for structural policies for pre-accession', ISPA, is the European Community's financial instrument designed to assist the 10 central and east European candidate countries meet EU requirements in the fields of environment and transport. ISPA, whose budget covers the period of 2000-06, is managed by the European Commission. The year 2000 was the first operational year for ISPA. Before projects were presented to the ISPA Management Committee, candidate countries were required to prepare ISPA investment strategies for the transport and environment sectors. These documents provide guidance for the selection of ISPA projects and establish the link between investment requirements for achieving compliance with the. acquis in these sectors and the selected ISPA projects. The projects accepted in 2000, including technical assistance projects, were divided fairly equally between the environmental and transport sectors: 39 environmental projects received over 46 % of the 2000 budget, and 36 transport projects received over 53% of the 2000 budget. In the environmental sector, the focus was on investment-heavy proposals. Over 64 % of the funds in this sector are used for sewage installations and water treatment projects. In the transport sector, the focus was on rail projects, which constitute more than half of the budget for this sector. This is in accordance with community policy on transport initiatives. In addition, projects that addressed the need to enhance safety and the separation of traffic were prioritised.. Division of ISPA funds between recipient countries Estonia 2.83 Czech Republic 7.02 Bulgaria 10.43 % Lithuania 5.24 % Slovenia 1.97 %. Poland 30.77 %. Romania 23.98 %.
(35) 33. Example of ISPA intervention: Bulgaria — Environment Construction of waste water treatment plants located in the Maritsa basin (Stara Zagora, Dimitrovgrad) in Bulgaria The measure concerns the construction of new waste water treatment plants and related infrastructure to serve the cities of Stara Zagora and Dimitrovgrad which are located in south-central Bulgaria on the Maritsa river or its tributaries. It is aimed at tackling the pollution of the receiving waters of. the Maritsa river and ultimately of the Aegean Sea, as well as improving the environment of the cities concerned and their surrounding region. The measure is consistent with the Bulgarian 'national priority investment programme for construction of waste water treatment plants in settlements with a population equivalent of over 10 000', whose principles are in line with the priorities of the accession partnership 1999 and the national programme for the adoption of the acquis 2000.. Cosi and assistance (EUR). Total cost. 43 399 688. Private sector contribution. Non-eligible expenditure. Total eligible cost. ISPA grant. —. —. 43 399 688. 32 549 766. Grant rate %. 75. The measure forms part of the Maritsa basin group of projects which includes a third waste water treatment plant for the city of Haskovo. The total estimated cost of this. group is EUR 61.4 million. A loan agreement has been signed by the Bulgarian authorities and the European Investment Bank to co-finance the Maritsa basin projects.. Example of ISPA intervention: Czech Republic — Transport. The project consists of the construction of a new dual carriageway road of 5.24 km in length. The scheme also includes two intersections as well as bridge objects, a footbridge and pedestrian subway and diversions of roads and services that are a necessary consequence of construction of the new road. The demolition of 20 objects and the construction of 10 sections of anti-noise barriers are required. Design standards comply to Directive 96/53/EC, in particular to allow the operation of heavy goods vehicles with a single axe weight of 11.5 tonnes. Average annual daily traffic amounts to more than 21 000 vehicles, of which heavy vehicles represent 25 %. A significant part of present traffic (15-20 %) is international traffic.. Expressway: section of R48 expressway Frydek-Místek-Dobrá The project is part of the R48 expressway which is an 86 km long road and the continuation of the main Czech west-east route from Prague to the Polish border. The R48 is a four-lane expressway, except in six missing two-lane sections; this project addresses one of these missing sections. The project is located on European intermodal transport corridor VI, connecting Poland, the Czech Republic and Austria, within the Ostrava region..
(36) 34. Cost and assistance (EUR). Total cost 36 341990. Private sector contribution. Non-eligible expenditure. Total eligible cost. ISPA grant. —. 2 355 862. 33 986128. 20 391677. Example of ISPA intervention: Estonia — Environment Tallinn waste management—phase I The project, Tallinn waste management — phase I, concerns two separate investments within the ongoing establishment of the new landfill and the new waste treatment plant. D Construction of an access road from Peterburi Road to the landfill site (5.5 km). The access road consists of a traffic junction of 2 km and of a four-lines, two-ways asphalt road of 3.5 km. The design and the construction is in accordance with the EU standards.. Grant rate %. 60. of a new pipeline (11 km) and pumping stations thus providing for the treatment of the leachate from the landfill. The leachate has to be pumped into the Tallinn sewage system together with sewage water of Maardu, Loo and Iru settlements. In addition, Tallinn waste management — phase I also includes two components for which no ISPA assistance is required. Those two components, for a total investment cost of approximately EUR 37.4 million, are: construction of the first phase of the landfill; construction of the first part of the infiltration water system. End date: 31 December 2003.. D Connecting the landfill area with the sewage system of Tallinn City by means Cost and assistance (EUR). Total cost 7 150 000. Private sector contribution. Non-eligible expenditure. Total eligible cost. ISPA grant. —. 1 040 000. 6 110 000. 4 582 500. Grant rate %. 75. Example of ISPA intervention: Hungary — Transport. railway line (part of the pan-European corridor IV) that started in the early 1990s.. Railway: rehabilitation of the Budapest-Gyor-Hegyeshalom line (stage II). The line between Budapest and Vienna via the Austrian/Hungarian border at Hegyeshalom is the most important railway connection between the European Union and the accession countries in this part of the European continent.. The rehabilitation of the BudapestGyör-Hegyeshalom is a second phase of a modernisation programme for the Budapest.
Figure
+7


Related documents
We have audited the Investment Portfolio of the Fund as at December 31, 2001, the Statements of Net Assets as at December 31, 2001 and 2000, the Statements of Operations and Changes
Maximum theoretical annual risk 5 borne by the Union budget: operations disbursed and decided at 31 December 2005 (see Table A3 in Annex) 6.. – For 2006, the maximum
In the Court’s opinion, the attached financial statements (balance sheet at 31 December 2000, profit-and-loss account, statement of the allocation of the surplus for the financial
Long-term assets This heading includes amounts owed to the European Union by Member States and nonmember countries on loans granted either from borrowed funds or from
Morton Community College FY20 Budget Report. For 6 Month Ending December
AND CHANGES IN FUND EQUITY - BUDGET (NON-GAAP BUDGETARY BASIS) AND ACTUAL ATHENS COUNTY SOLID WASTE DISTRICT FUND. FOR THE YEAR ENDED DECEMBER
We have audited the accompanying financial statements of DEXSTA Federal Credit Union (the Credit Union), which comprise the statement of financial condition as of December 31,
The tax budget prepared for fiscal year ending December 31, 2022 projects approximately a 5.1% increase in total revenue from the current fiscal year’s budget.. This change
