Red Cell Distribution Width as Outcome Predictor in Organophosphate Poisoning
Dissertation submitted in partial fulfillment of the Requirement for the award of the Degree of
DOCTOR OF MEDICINE
BRANCH I - GENERAL MEDICINE APRIL 2019
CERTIFICATE FROM THE DEAN
This is to certify that the dissertation entitled “Red Cell Distribution Width as Outcome Predictor in
Organophosphate Poisoning ” is the bonafide work of DR. S. ARUN PRANAAV in partial fulfillment of the university regulations of the Tamil Nadu Dr. M.G.R. Medical
University, Chennai, for M.D General Medicine Branch I examination to be held in April 2019.
Dr. D.MARUTHUPANDIAN M.S., FAIS.,FICS THE DEAN, MADURAI MEDICAL COLLEGE,
CERTIFICATE FROM THE HOD
This is to certify that the dissertation entitled “Red Cell Distribution Width as Outcome Predictor in
Organophosphate Poisoning ” is the bonafide work of DR. S. ARUN PRANAAV in partial fulfillment of the university regulations of the Tamil Nadu Dr. M.G.R. Medical
University, Chennai, for M.D General Medicine Branch I examination to be held in April 2019.
Dr. V. T. PREM KUMAR, M.D., PROFESSOR AND HOD,
CERTIFICATE FROM THE GUIDE
This is to certify that the dissertation entitled “Red Cell Distribution Width as Outcome Predictor in
Organophosphate Poisoning ” is the bonafide work of DR. S. ARUN PRANAAV in partial fulfillment of the university regulations of the Tamil Nadu Dr. M.G.R. Medical
University, Chennai, for M.D General Medicine Branch I examination to be held in April 2019
Dr. C. DHARMARAJ, M.D(GM)., D.CH., PROFESSOR OF MEDICINE,
DEPARTMENT OF GENERAL MEDICINE, GOVERNMENT RAJAJI HOSPITAL,
DECLARATION
I, Dr. S. Arun Pranaav declare that, I carried out this work on “Red Cell Distribution Width as Outcome Predictor in Organophosphate Poisoning” at the Department of General Medicine, Government Rajaji Hospital, Madurai under the guidance of Dr. C.DHARMARAJ, M.D(GM)., D.CH., Professor, Department of General Medicine, Madurai medical college,Madurai.
I also declare that this bonafide work or a part of this work was not submitted by me or any others for any award,
degree, Diploma to any other University, Board either in India or abroad.
This dissertation is submitted to The Tamil Nadu Dr. M.G.R. MedicalUniversity, Chennai in partial fulfillment of the rules and regulations for theaward of Doctor of Medicine (M.D.), General Medicine Branch-I,examination to be held in
April 2018.
Place: Madurai Date:
ACKNOWLEDGEMENT I would like to thank THE DEAN
Dr.D.MARUTHUPANDIAN M.S., Madurai Medical College, for permitting me to use the hospital facilities fordissertation.
I also extend my sincere thanks to Dr. V. T.
PREMKUMAR, M.D,Head of the Department and Professor of Medicine for his constant supportduring the study.
I would like to express my deep sense of gratitude and
thanks to myunit Chief, Dr. C. DHARMARAJ, M.D(GM)., DCH, my guide andProfessor of Medicine, for his valuable suggestions and excellent guidanceduring the study.
I also sincerely thank our beloved professors Dr.
I thank the Assistant Professors of my unit
DR.A.TAMILVANAN M.D.,D.A.,DR.A.PRABHU M.D., for their help and constructive criticisms.
I offer my special thanks to Head of the department of BIO CHEMISTRY and Head of the department of
PATHOLOGY for theirunstinted support and valuable guidance.
I thank all the patients who participated in this study for their extremepatience and kind co-operation.
I wish to acknowledge all those, including my Post graduate colleagues, my parents who have directly or indirectly
helped me tocomplete this work with great success.
S.No Contents Page Number
1 ABSTRACT 1
2 INTRODUCTION 4
3 OBJECTIVE OF STUDY 8
4 REVIEW OF LITERATURE 10
5 MATERIALS AND METHODS 33
6 RESULTS AND
INTERPRETATION 40
7 DISCUSSION 77
8 SUMMARY 83
9 LIMITATION 86
10 CONCLUSION 88
Abstract: Introduction:
Suicidal poisoning by OPC is however a major clinical and public health concern Red cell distribution width measures variability in RBC size. That means it reflects anisocytosis. It can easily be assessed in a complete blood count. It is found to be elevated heart failure, acute coronary syndromes and pancreatitis.
Objectives:
To Investigate the relation between Red cell distribution width and final outcome in patients with organophosphate poisoning
Materials and Methods:
The study will be conducted on 200 patients admitted to Government Rajaji Hospital & Madurai Medical College with history of organophosphate poisoning during the study period
Title:
Red Cell Distribution Width as Outcome Predictor in Organophosphate Posioning
Suicidal poisoning by OPC is however a major clinical and public health concern Red cell distribution width measures variability in RBC size. That means it reflects anisocytosis. It can easily be assessed in a complete blood count. It is found to be elevated heart failure, acute coronary syndromes and pancreatitis.
Since RBCs have no nucleus and mitochondria they are affected first along with other hematological changes like dendritic cells inhibiton, leukocytosis
Objectives:
REVIEW OF LITERATURE:
Organophosphate (OP) compounds are a diverse group of chemicals used in both domestic and industrial settings. Examples of organophosphates include the following:
Insecticides – Malathion, parathion, diazinon, fenthion, dichlorvos, chlorpyrifos, ethion
Nerve gases – Soman, sarin, tabun, VX
Ophthalmic agents – Echothiophate, isoflurophate Antihelmintics – Trichlorfon
Herbicides – Tribufos (DEF), merphos
Industrial chemical (plasticizer) – Tricresyl phosphate
contamination of food sources. Although no clinical effects of chronic, low-level organophosphate exposure from a food source have been shown, advancements in risk assessment and preparedness are ongoing.
Mechanism of OPC action include
• OP compounds phosphonylate the active site of acetylcholinesterase (AChE), inactivating the enzyme leading to the accumulation of acetylcholine (ACh) in cholinergic synapses
• Spontaneous hydrolysis of the OP-enzyme complex allows reactivation of the enzyme.
• AChE-diethyl OP complex may take several days and reinhibition of the newly activated enzyme can occur significantly
Signs and symptoms of organophosphate poisoning can be divided into three broad categories: (1) muscarinic effects, (2) nicotinic effects, and (3) central nervous system (CNS) effects. Also classified as
2. Sub acute proximal weakness (Intermediate syndrome) 3. Organophosphate induced delayed neuropathy
(OPIDN)
4. Chronic organophosphate induced neuropsychiatric disorder (COPIND)
Acute cholinergic crisis Muscarinic effects:
• Cardiovascular - Bradycardia, hypotension
• Respiratory - Rhinorrhea, bronchorrhea, bronchospasm, cough,severe respiratory distress
• Gastrointestinal - Hypersalivation, nausea and vomiting, abdominal pain, diarrhea, fecal incontinence
• Genitourinary - Incontinence • Ocular - Blurred vision, miosis
Nicotinic effect:
• muscle fasciculations • cramping
• weakness
• diaphragmatic failure • hypertension
• tachycardia • mydriasis • pallor
CNS effects: • Anxiety
• Confusion • Ataxia • Tremors • Seizures • Coma
Intermediate syndrome
• usually occurs 24 to 96 hours after the ingestion of an OP compound
• after an initial cholinergic crisis but before the expected onset of delayed polyneuropathy.
• Approximately 10-40% of patients treated for acute poisoning develop this illness.
• Mostly seen with fenthion, dimethoate and monocrotophos,
• muscle weakness may last up to 5-14 days, the condition regresses slowly if respiratory support is available.
• exact pathogenesis is unclear, the proposed mechanisms include persistent inhibition of AChE leading to functional paralysis of neuromuscular transmission, muscle necrosis, and oxidative free radical damage to the receptors
RBC ACETYLCHOLINESTERASE
• Direct measurement of RBC acetylcholinesterase (RBC AChE) activity provides the measure of the degree of toxicity
• The test is not usually available.
Plasma (Or Pseudo) Cholinesterase Activity • is more easily performed
• does not correlate well with severity of poisoning • should not be used to guide therapy.
Biochemical Grading of Severity of Poisoning: Red cell cholinesterase activity (% normal) Grade
• 20-50% Mild
• 10-20% Moderate
• <10% Severe
RED CELL ACETYLCHOLINESTERASE ACTIVITY
• Major disadvantage: Reactions between AChE, OP compounds and Oximes will continue if blood sample left at room temperature
• Samples must be diluted and cooled immediately
• Treatment begins with decontamination. Rapid initial assessment of airways, breathing, and circulation is essential.
• Comatose or vomiting patients should be kept in lateral, preferably head down position with neck extension to reduce the risk of aspiration.
• airway should be secured with proper positioning, placement of Guedel’s airway or with endotracheal intubation. Frequent suctioning is needed
• Oxygen used liberally to reduce the potiental problem of dysarrythmias
• Gastric lavage may help to reduce the absorption of the ingested poison and should be considered in patients presenting within 1-2 hours of ingestion of poison.
• Risks of gastric lavage include aspiration,hypoxia, and laryngeal spasm.
The mainstays of pharmacological therapy include atropine, pralidoxime (2-PAM), and benzodiazepines (eg, diazepam). Initial management must focus on adequate use of atropine -
INCREMENTAL DOSE
• 1.8 to 3.0 mg Atropine by IV
• Repeat the dose every 5 min interval doubling the dose each time to point of atropinisation
BOLUS DOSE
• 2-5 mg Atropine every 10- 15 min till atropinisation • Followed by maintenance using reduced doses or increasing time duration between doses
End point of Atropinisation :
- Clear chest on auscultation with resolution of bronchorrhea
- HR>80/min - SBP>80 mm Hg - Dry axilla
- Pupils >2mm in diameter
• Tachycardia not a contra-indication to Atropine
ATROPINE Vs GLYCOPYRROLATE
• Main adverse of Atropine – anti cholinergic delerium • Glycopyrrolate - poor CNS penetration
• Ineffective in countering coma, reduced respiration. • RCT showed no significant difference in mortality or ventilation rates
• Atropine will remain the anti-muscarinic agent of choice. Characteristics of OXIMES are
• Ability to reverse AChE inhibition with oximes varies with pesticide ingested
• Diethyl OP compounds: effectively reactivated (t1/2 : 33 h) Dimethyl OP compounds: respond poorly (t1/2 : 3 h) • Difference due to variation in speed of aging induced by
• Oximes not useful for late presentation of dimethyl OPC and large consumption of OPC (re-inhibits reactivated enzymes)
Cause of Death in OPC poisoning 1. Immediate death:
– Seizures.
– Complex ventricular arrhythmias. 2. Death within 24 hours:
– Acute cholinergic crisis in untreated severe case -Respiratory failure.
3. Death within 10 days of poisoning: – Intermediate syndrome.
– Secondary to ventricular arrhythmias, including Torsades de Pointes, which may occur up to 15 days after acute intoxication.
FAT SOLUBILITY AND HALF LIFE
• Fat soluable thionate OPCs (Fenthion) distribute in large amounts to fat stores after absorption
• Reduced peak concentration and mild early cholinergic features
• Subsequent slow distribution and activation - recurrent cholinergic features lasting days or weeks
• IMS common
• Oximes beneficial for many days
Red cell distribution width (RDW) is a red blood cell parameter that measures variability of red cell volume/size (anisocytosis). Depending on the types of hematology analyzer instruments, RDW can be reported statistically as coefficient of variation (CV) and/or standard deviation (SD), RDW-CV and/or RDW-SD, respectively.
RDW-SD (express in fL) is an actual measurement of the width of the RBC size distribution histogram and is measured by calculating the width (in fL) at the 20% height level of the RBC size distribution histogram. This parameter is therefore not influenced by the average RBC size (mean corpuscular volume, MCV).
• RDW-CV (%) = 1 standard deviation of RBC volume/MCV x 100%
Determination of RDW-SD measurement. In this example, RDW-SD is 38.2 fL.
RDW can be used as a guidance for flagging samples that may need manual peripheral blood smear examination, since elevated RDW may indicate red cell fragmentation, agglutination, or dimorphic red blood cell populations.
RDW has also been associated with a poorprognosis for other diseases and conditions, including stroke,community-acquired pneumonia (CAP), pulmonary embolism, chronicobstructive pulmonary disease (COPD), septic shock, and acutepancreatitis
RDWlevels than non-ventilated patients (p=0.004 and p<0.001, respectively). The area under thereceiver-operating characteristic curve of RDW levels for predictingmechanical ventilation requirement was 0.716 (95% CI: 0.581-0.852, p=0.010). RDW had a sensitivity of 73%, specificity of 70%, and negative predictive value of91% with a cut-off value of 14.5% in predicting mechanical ventilation requirement in patients with organophosphate poisoning
Mean age was 31.32 ± 11.84 years and 58.2% of the patients were males. Mean serum pseudocholinesterase level was 5.5± 4.3 and mean RDW was 13.07± 1.67. Mortality rate was 8.9%. Non survivors had higher RDW (13.87± 2.81) when compared with survivors (12.99± 1.49). RDW had a sensitivity of 57.1%, specificity of 68.1%, and negative predictive value of 94.3% with a cut-off value of 13.5% in predicting mortality in patients with OPI poisoning.
conducted to determine the independent prognostic factors for 30-day mortality.
STUDY POPULATION: SOURCE OF DATA:
The study will be conducted on 200 patients admitted to Government Rajaji Hospital & Madurai Medical College with history of organophosphate poisoning during the study period
Inclusion Criteria
• Clinical history of ingestion of OPI poison between age 13- 60 yrs
Exclusion Criteria
• Coningestion with other poison • Prehospital cardiac arrest
• Transfer to another hospital
• Hypertension • Diabetes
• Abnormal liver function test • Abnormal renal function test • Iron deficiency anaemia
DATA COLLECTION:
Informed consent will be obtained from all patients/attenders to be enrolled for the study. In all the patients relevant information will be collected in a predesigned proforma. The patients are selected based on clinical examinations and biochemical tests.
b) Peripheral blood smear c) Liver function test
d) Renal function test e) Random blood sugar
f) PseudoCholinesterase level
DESIGN OF STUDY: Prospective study
PERIOD OF STUDY: 6 MONTHS
COLLABORATING DEPARTMENTS: DEPARTMENT OF PATHOLOGY
DEPARTMENT OF BIOCHEMISTRY
ETHICAL CLEARANCE: Applied for
CONSENT: Individual written and informed consent.
ANALYSIS: Statistical analysis will be performed using appropriate tests as required according to data.
200 patients between age 13 and 60 years who will be admitted in emergency department with history of Organophosphate poisoning with normal blood sugar , LFT and RFT, with no significant past medical illnesss, during the study period
DATA ANALYSIS:
tocompare the RDW and various parameters between two groups. Student T test was used. The ROC curve (Receiver operating curve) was used to determine the optimal cut off point for RDW for predicting mortality.
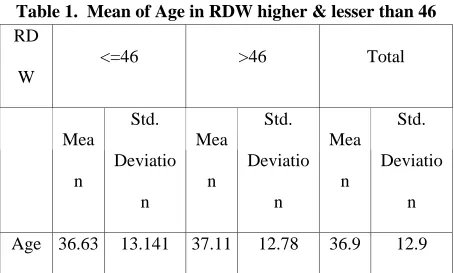
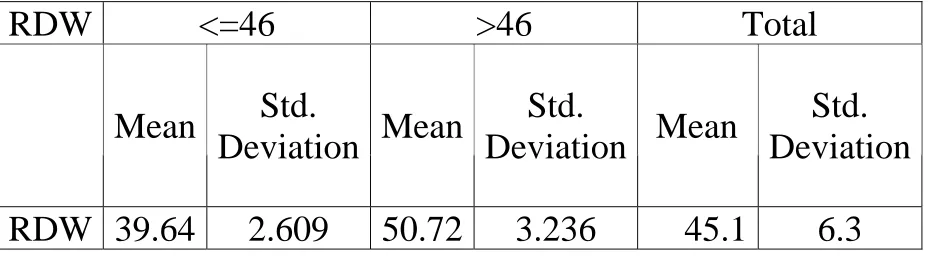
The mean age group participated was 36.63yrs with RDW lesser than 46 having Standard deviation of 13.141 and 37.11 with RDW higher than 46 having Standard deviation of 12.78 as shown in Table 1
Table 1. Mean of Age in RDW higher & lesser than 46 RD
W
<=46 >46 Total
Mea n Std. Deviatio n Mea n Std. Deviatio n Mea n Std. Deviatio n Age 36.63 13.141 37.11 12.78 36.9 12.9
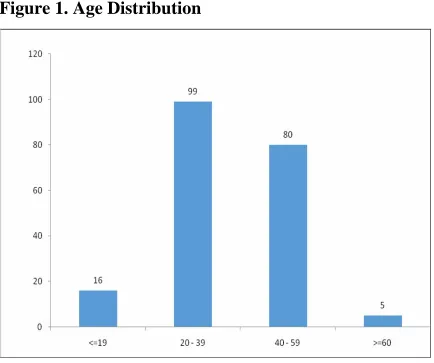
subjects(40%). In the 60-70 yrs age group there were 5 subjects(2.5%). They were plotted and the bar diagram is as in figure1.
Table 2. Comparison of Age in RDW higher and lesser than 46
Age Group Number Percent
<=19 16 8.0
20 - 39 99 49.5
40 - 59 80 40.0
Figure 1. Age Distribution
Table 3. Comparison of Sex in RDW higher and lesser than 46
Sex Number Percent
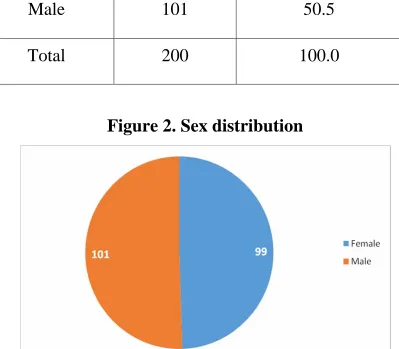
Female 99 49.5
Male 101 50.5
[image:53.612.115.514.240.589.2]Total 200 100.0
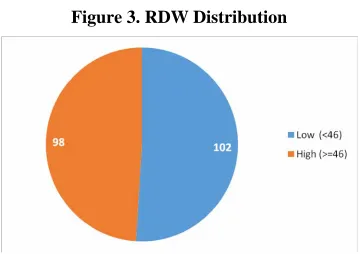
Among 200 subjects, the number of patients with RDW greater than or equal to 46 was 98(49%) and the number of patients with RDW lesser than 46 was 102(51%) as shown in table 4 and their distribution is shown in figure 3
Table 4. Comparison between RDW higher and lesser than 46
RDW Number Percent
Low (<46) 102 51.0
High (>=46) 98 49.0
Figure 3. RDW Distribution
Table 5. Mean of RDW value measured
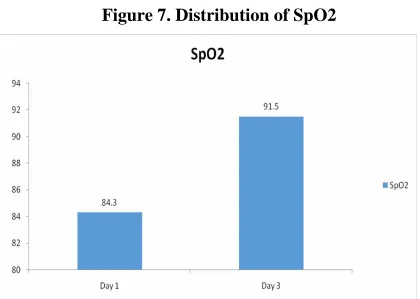
Each subjects vitals blood pressure, SpO2, pulse rate, respiratory rate were measured on day 1 and day 3. Serum Pseudocholinesterase was also measured on day 1 and Day 3 of ingestion of Organophosphate poisoning
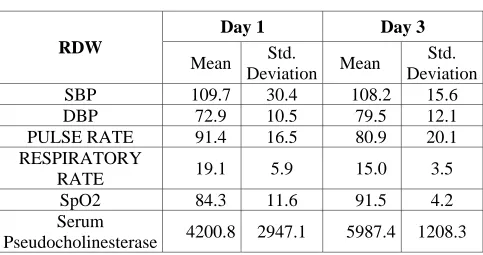
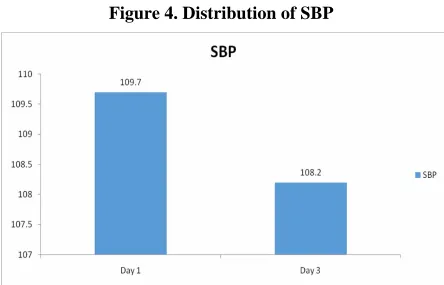
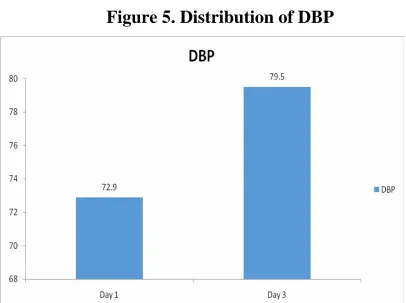
The mean of Systolic Bp, Diastolic Bp, Pulse rate , Respiratory rate, SpO2 and Serum Pseudocholinesterase were measured and shown in Table 6. Mean of SBP was 109.7 on Day 1 and 108.2 on Day 3. Mean of DBP was 72.9 on Day 1 and 79.5 on Day 3. The mean Pulse rate was 91.4
RDW <=46 >46 Total
Mean Std.
Deviation Mean
Std.
Deviation Mean
on Day 1 and 80.9 on Day 3 and respiratory rate was 19.1 on Day 1 and 15 on Day 3. The SpO2 was 84.3 on Day 1 and 91.5 on Day 3.
[image:57.612.96.579.329.584.2]The mean Serum Pseudocholinesterase was 4200.8 on day 1 and 5987.4 on day 3
Table 6. Mean of Vitals and Serum Pseudocholinesterase
Day 1 Day 3
RDW
Mean Std.
Deviation Mean
Std. Deviation
SBP 109.7 30.4 108.2 15.6
DBP 72.9 10.5 79.5 12.1
PULSE RATE 91.4 16.5 80.9 20.1
RESPIRATORY
RATE 19.1 5.9 15.0 3.5
SpO2 84.3 11.6 91.5 4.2
Serum
Pseudocholinesterase 4200.8 2947.1 5987.4 1208.3
Figure 9. Serum Pseudocholinesterase Distribution
The mean DBP on Day 1 and Day 3 were 75.2 and 80.09 in RDW lesser than 46 . In RDW greater than 46 it was 70.45 and 78.8 on Day 1 and Day 3 respectively
The mean Pulse rate on Day 1 and Day 3 were 91.06 and 68.24 in RDW lesser than 46 . In RDW greater than 46 it was 91. and 68.54 on Day 1 and Day 3 respectively
The mean Respiratory Rate on Day 1 and Day 3 were 20.01 and 16.21 in RDW lesser than 46 . In RDW greater than 46 it was 18.2 and 13.66 on Day 1 and Day 3 respectively
Table 7. Comparison of mean of Parameters on Day 1 and 3
Day 1 Day 3
RDW
Low High Total Low High Total
Parameters Mean (SD) Mean (SD) Mean (SD) Mean (SD) Mean (SD) Mean (SD)
SBP 107.43
(30.6) 112.06 (30.1) 109.7 (30.4) 118.27 (12.3) 97.61 (11.0) 108.2 (15.6 )
DBP 75.2
( 9.1) 70.45 (11.2 ) 72.9 ( 10.5) 80.09 (11.9 ) 78.8 (12.2) 79.5 (12.1)
Pulse Rate 91.06 (16.7) 91.7 (16.3) 91.4 (16.6) 92.75 (16.8) 68.54 (15.2) 80.9 (20.1)
Respiratory Rate 20.01 (5.9 ) 18.2 ( 5.6) 19.1 (5.9 ) 16.21 (3.7) 13.66 (2.6) 15.0 (3.5)
The distribution of the parameters were inputted and compared between day 1 and day 3 of RDW higher than 46 and Lesser than 46 groups and shown in Figures 10 – 15
The outcomes were measured as no adverse effects, early intubation, those needing tracheostomy and death within 30 days and tabulated as follows
[image:73.612.91.551.408.552.2]Out of 200 subjects those with no adverse effects were 104 (52%) and with adverse effects were 96(48%) as shown in table 8 and and the distribution is shown in figure 16
Table 8. Comparison of Adverse effects No Adverse
Effects Number Percent
Figure 16. Distribution of Adverse effects group
Among those with adverse effects, 32(16%) were intubated and extubated within 5 days as shown in table 9 and its distribution as in figure 17
Table 9. Comparison of Intubated and Early Extubated Intubated and
early extubated Number Percent
[image:74.612.87.550.511.687.2]Figure 17. Distribution of Intubated and Early Extubated
Table 10. Comparison of intubated and Needing Tracheostomy
Intubated needing
tracheostomy Number Percent
No 154 77.0 Yes 46 23.0 Total 200 100.0
[image:76.612.95.520.424.683.2]Of the 200, 19(9.5%) had delayed respiratory failure needing mechanical ventilation as shown in table 11 and the distribution is shown in figure 18
Table 11.Comparison of Delayed Respiratory failure within 72 hrs
Delayed respiratory failure within
72hrs
Number Percent
There were 7 deaths (3.5%) in the study population as shown in table 12 and their distribution is depicted figure 20
Table 12. Comparison of Death within 30 days Death within 30
days Number Percent
No 193 96.5 Yes 7 3.5 Total 200 100.0
Table 13. Comparision of Outcomes
Outcomes RDW Low RDW High
No Yes Total No Yes Total No adverse effects 13 89 102 91 7 98 Intubated and early
extubated 89 13 102 79 19 98
Intubated needing
tracheostomy 102 0 102 52 46 98 Delayed
respiratory failure within 72hrs
102 0 102 79 19 98 Death within 30
Comparison between the baseline parameters and RDW using Student t-test:
[image:82.612.69.578.257.624.2]The P-value <0.05 is taken as statistically significant
Table 14. Comparison of baseline parameters and RDW
RDW Low High P-value
Mean Std.
Deviation Mean
Std. Deviation
Age 36.6 13.1 37.1 12.8 0.792
SBP 107.4 30.7 112.1 30.2 0.283
DBP 75.2 9.2 70.4 11.2 0.001
PULSE RATE 91.1 16.7 91.7 16.3 0.783 RESPIRATORY
RATE 20.0 6.0 18.2 5.7 0.030
SpO2 92.7 6.6 75.5 8.8 <0.0001
Serum
From the t test we derive that the mean serum pseudocholinesterase was lower in RDW high group 1699(SD 1377.6) than the RDW low group 6603.6(SD1841.5) which is statistically significant (p<0.0001)
Also the mean SpO2 was lower in the RDW higher group 75.5 (SD 8.8) and higher in RDW 92.7 (SD 6.6) which is also statistically significant (p<0.0001)
Also the mean Respiratory Rate was lower in the RDW higher group 18.2 (SD 5.7) and higher in RDW 20 (SD 6.0) which is also statistically significant (p<0.030)
The other parameters like age, Systolic Bp Pulse Rate did not have statistical significance.
Patients with RDW high than 46 had very low Serum Pseudocholinesterase, Lower SpO2, Diastolic BP and Respiratory Rate which were statistically significant.
ROC (Receiver operating curve) was used to determine the optimal cut off point for RDW for predicting mortality.
DISCUSSION:
Organophosphate poisoning causes many hematological and biochemical changes on accidental or toxic exposure. It causes increased inflammatory cytokines particularly IL-1b, IL-8 that causes oxidative stress damaging the RBC membranes leading to anisocytosis and elevated RDW. Organophosphate poisoning also reduces certain anti-inflammatory cytokines such as IL-10 further tipping the balance between pro and anti-inflammatory state in the body leading to oxidant damage.
cholesterol and phospholipid in the RBC membrane making it unstable and prone to sheer stress and alter RBC’s shape
Also Organophosphates have redox cycling activity, i.e. they accept a free electron and transfer it to O2 causing free radical generation, thereby oxidant damage.
RBC’s are prone to damage easily as they have no nucleus and mitochondria. This makes them easily affected especially during hypoxia which is the feature of Organophosphate poisons.
This leads to RBC membrane damage and it continues as a vicious cycle until intervened.
The mean age group participated was 36.63yrs with RDW lesser than 46 having Standard deviation of 13.141 and 37.11 with RDW higher than 46 having Standard deviation of 12.78. Out of 200 subjects number of males were 101(50.5%)
In study by Shaikh Mohammed Aslam et al, the mean age was 31.32 ± 11.84 years. 58.2% of the patients were males. Mean heart rate was 102.10± 21.33 beats per minute and mean respiratory rate was 22.34±16.13 cycles per minute.
In our study, the mean Respiratory Rate on Day 1 was 20.01 in RDW lesser than 46 . In RDW greater than 46 it was 18.2 on Day 1
The mean SBP on Day 1 was 107.43 and 112.06 in RDW low and higher than 46 respectively and on Day 3 was 118.27 and 97.61 in RDW low and High groups.
In study by Changwoo Kang et al, the mean SBP (mm Hg) was 136.3 ± 37.7 with Total patients, 139.2 ± 36.5 with RDW lower groupand 127.5 ± 40.9 with RDW higher group.
In our study there were 7 deaths among 200 patients (3.5%) with all of them having elevated RDW levels. None died in the RDW lower group
SUMMARY:
A total of 200 patients Government Rajaji Hospital, Madurai were recruited for thisobservational study.
In the RDW higher than 46 group there were 7 patients with no adverse effects, 19 who were intubated and extubated early.
46 subjects were intubated and needed prolonged mechanical ventilation beyond 5 days and hence underwent elective tracheostomy.
19 had delayed respiratory failure within 72 hrs requiring mechanical ventilation and 7 died within 30 days in the RDW higher than 46 group.
Zero subjects were intubated and needed prolonged mechanical ventilation beyond 5 days
None had delayed respiratory failure within 72 hrs requiring mechanical ventilation and no one died within 30 days in the RDW lesser than 46 group.
The RDW high group had lower mean Serum Pseudocholinesterase 1699(SD 1377.6) which is statistically significant
Also RDW higher group had low SpO2 75.5 (SD 8.8), respiratory rate 18.2 (SD 5.7) and Diastolic BP 70.4 (SD 11.2) which is also statistically significant
LIMITATION:
• Our study did not involve any intervention.
• The subtype of Organophosphate poison a nd their outcomes were not studied separately.
• We did not include other types of poison like Carbamate, organochlorines
• We could not quantify the amount of exposure that occurred in each patient
• The height, weight, BMI of patients were not studied, since Organophosphate poisons are fat soluble
CONCLUSION:
Red cell distribution width is a quick, simple, easy and effective tool to risk stratify Organophosphate poisoning cases in low income, resource poor settings and in most situations where the degree of exposure to poison could not be assessed or wasn’t revealed
It can be used as an additional tool to predict complications in patients with Organophosphate poisoning and also as a criteria for discharging in-patients who are not at risk of intoxication.
1. Lippi, G., Targher, G., Montagnana, M. et al, Relation between red blood cell distribution width and inflammatory biomarkers in a large cohort of unselected outpatients. Arch Pathol Lab Med. 2009;133:628–632.
2. Churi, S., Bhakta, K., Madhan, R. Organophosphate poisoning: prediction of severity and outcome by Glasgow Coma Scale, poisoning severity score, Acute Physiology and Chronic Health Evaluation II score, and Simplified Acute Physiology Score II. J
Emerg Nurs. 2012;38:493–495
middle-aged and older adults. Arch Intern Med. 2009;169:515–523
4. Shaikh Mohammed Aslam , Akhila Arcot Vadivelan Red Cell Distribution Width as Prognostic Marker in
rganophosphorous Compound PoisoningIOSR JDMS
e-ISSN: 2279-0853, p-ISSN: 2279-0861.Volume 14,
Issue 9 Ver. III (Sep. 2015)
5. Peter JV, Thomas L, Graham PL, et al. Performance of clinical scoring systems in acute organophosphate poisoning. Clin Toxicol (Phila) 2013;51:850–4.
Physiology and Chronic Health Evaluation II score, and Simplified Acute Physiology Score II. JEmerg Nurs 2012;38:493–5.
7. Liu SH, Lin JL, Weng CH, et al. Heart rate-corrected QT interval helps predict mortality after intentional organophosphate poisoning. PLoS One 2012;7:e36576. 8. Lee JH, Lee YH, Park YH, et al. The difference in
C-reactive protein value between initial and 24 hours follow-up (D-CRP) data as a predictor of mortality in organophosphate poisoned patients. Clin Toxicol (Phila) 2013;51:29–34.
10. Yardan T, Baydin A, Acar E, et al. The role of serum cholinesterase activity and S100B protein in the evaluation of organophosphate poisoning. Hum Exp Toxicol 2013;32:1081–8.
11. Dabbah S, Hammerman H, Markiewicz W, et al. Relation between red cell distribution width and clinical outcomes after acute myocardial infarction. Am J Cardiol 2010;105:312–7.
13. Zalawadiya SK, Veeranna V, Niraj A, et al. Red cell distribution width and risk of coronary heart disease events. Am J Cardiol 2010;106:988–93.
14. Kim J, Kim K, Lee JH, et al. Red blood cell distribution width as an independent predictor of all-cause mortality in out of hospital cardiac arrest. Resuscitation 2012;83:1248–52.
15. Ani C, Ovbiagele B. Elevated red blood cell distribution width predicts mortality in persons with known stroke. J Neurol Sci 2009;277:103–8.
17. Zorlu A, Bektasoglu G, Guven FM, et al. Usefulness of admission red cell distribution width as a predictor of early mortality in patients with acute pulmonary embolism. Am J Cardiol 2012;109:128–34.
18. Seyhan EC, Ozgul MA, Tutar N, et al. Red blood cell distribution and survival in patients with chronic obstructive pulmonary disease. COPD 2013;10:416–24. 19. Jo YH, Kim K, Lee JH, et al. Red cell distribution
width is a prognostic factor in severe sepsis and septic shock. Am J Emerg Med 2013;31:545–8.
21. Patel KV, Ferrucci L, Ershler WB, et al. Red blood cell distribution width and the risk of death in middle-aged and older adults. Arch Intern Med 2009;169:515–23. 22. Perlstein TS, Weuve J, Pfeffer MA, et al. Red blood
cell distribution width and mortality risk in a community-based prospective cohort. Arch Intern Med 2009;169:588–94.
23. Pierce CN, Larson DF. Inflammatory cytokine inhibition of erythropoiesis in patients implanted with a mechanical circulatory assist device. Perfusion 2005;20:83–90.
inflammatory biomarkers in a large cohort of unselected outpatients. Arch Pathol Lab Med 2009;133:628–32. 25. Ghaffari S. Oxidative stress in the regulation of normal
and neoplastic hematopoiesis. Antioxid Redox Signal 2008;10:1923–40.
26. Hunziker S, Celi LA, Lee J, et al. Red cell distribution width improves the simplified acute physiology score for risk prediction in unselected critically ill patients. Crit Care 2012;16:R89.
28. Soltaninejad K, Abdollahi M. Current opinion on the science of organophosphate pesticides and toxic stress: a systematic review. Med Sci Monit 2009;15:RA75–90. 29. Lukaszewicz-Hussain A. Role of oxidative stress in
PROFORMA Name:
Age / Sex: Occupation:
Presenting complaints:
Past History:
H/o DM, HT, CKD, CVD, DRUG INTAKE, Thyroid disorders, Alcohol intake
Clinical Examination: General Examination: Consciousness Pallor Jaundice Clubbing Lymphadenopathy Hydration status
Signs suggestive of poisoning Salivation
Laboratory investigations: a) Hemoglobin
b) Hematocrit
c) Mean Corpuscular Volume d) MCHC
e) Peripheral Smear f) Liver function test g) Renal function test
ABBREVIATIONS
OPC/OPI – Organophosphate Ache – Acetylcholinesterase
RDW – red cell distribution width
ஆரா சி ஒ த ப வ
ெபய : ேததி:
வய :
ேநாயாளிஎ :
ஆரா சிேச ைகஎ :
இ த ஆரா சியி விவர க அத
ேநா க க ைமயாக என விள கப ட .
என விள கப ட விஷய கைள நா
ாி ெகா என மன ட ச மதி கிேற .
இ த ஆரா சியி பிறாி நி ப தமி றி எ ெசா த
வி ப தி ேபாி தா ப ெப கிேற ம
நா இ த ஆரா சியி இ எ த ேநர
பி வா கலா எ அதனா எ த பாதி
என ஏ படா எ பைத ாி ெகா ேட .
நா எ ைடய யநிைன ட ம
த திர ட இ த ம வ ஆரா சியி
CERTIFICATE
This is to certify that this dissertation titled “Red Cell Distribution Width as Outcome Predictor in Organophosphate Poisoning” of the candidate Dr.S.ARUN PRANAAV with registration number 201611101 for the award of M.D degree in the branchof GENERAL MEDICINE. Ipersonally verified the urkund.com websitefor the purpose of plagiarism check. I found that the uploaded thesis filecontains from introduction to conclusion pages and result shows 14% percentage of plagiarism in the dissertation.