Original Article
DOI: 10.22114/ajem.v0i0.257
Red Cell Distribution Width (RDW) Index as a Predictor of Severity of
Acute Ischemic Stroke: A Correlation Study
Ritin Mohindra1*, Utkarash Mishra2, Roshan Mathew3, Narender Singh Negi4
1. Department of Internal Medicine, PGIMER, Chandigarh, India.
2. Department of Neurology, VMMC & Safdarjung Hospital, New Delhi, India.
3. Department of Emergency Medicine, All India Institute of Medical Sciences, New Delhi, India. 4. Department of Medicine, VMMC & Safdarjung Hospital, New Delhi, India.
*Corresponding author: Ritin Mohindra; Email: [email protected]
Published online: 2019-12-01 Abstract
Introduction: Globally, stroke is one of the leading causes of deathand disability-adjusted life-years
(DALYs). The red cell distribution width (RDW) is a readily available and inexpensive test which is done routinely as a part of complete blood count in these patients.
Objective: In this study, we tried to correlate the RDW with severity of acute ischemic stroke (AIS).
Methods: Patients presenting to emergency department (ED) within 24 hours of the onset of clinical signs and
symptoms suggestive of AIS were assessed for Glasgow Coma Scale (GCS) and National Institutes of Health Stroke Scale (NIHSS) score followed by non-contrast computed tomography (NCCT) scan. RDW value for all the patients who were included in the study were co-related with the severity of the stroke.
Results: The median (IQR) RDW in the patients with minor stroke on the basis of GCS was 13.5 (13.3-13.5),
moderate stroke was 13.8 (13.5-14.4) and with severe stroke was 15.4 (15.1- 15.6) (p < 0.001). The median (IQR) RDW in the patients with minor stroke on the basis of NIHSS score was 13.4 (13.2 – 13.6), moderate stroke was 13.8 (13.5-14.3), and moderate to severe stroke was 14.7 (14.5-15.3) and with severe stroke was 15.5 (15.1-15.7) (p < 0.001). The median RDW in patients who were alive was 13.8 (13.5 -15.1) and in patients who expired was 15.5 (14.5 -15.7) (p = 0.048).
Conclusion: Based on the findings of this study, RDW index has statistically significant correlation with the
severity of AIS. So it can potentially be an important parameter to predict the prognosis of AIS patients.
Key words: Correlation of Data; Erythrocyte Indices; Severity of Illness Index; Stroke
Cite this article as: MohindraR, Mishra U, Mathew R, Negi NS. Red Cell Distribution Width (RDW) as a Predictor of Severity of Acute Ischemic Stroke: A Correlation Study. Adv J Emerg Med. 2020;4(2):e24.
INTRODUCTION
Stroke is an abrupt onset of a neurological deficit attributable to a focal vascular cause (1). Globally, it is one of the leading causes of death and disability-adjusted life-years (DALYs) as per the estimates from the Global Burden of Diseases, Injuries, and Risk Factors Study (2). They are broadly classified as ischemic and hemorrhagic strokes. About 85% of all strokes are ischemic, and 15% are hemorrhagic (3). Ischemic strokes result from interruption of the blood supply to the brain, while hemorrhagic strokes result from the rupture of a blood vessel or an abnormal vascular structure.
Various scoring systems such as the Glasgow Coma Scale (GCS) and National Institutes of Health Stroke Scale (NIHSS) have been validated in predicting the severity of acute ischemic stroke (AIS). GCS is a commonly used neurological scale which gives a reliable and objective way of recording the
conscious state of a stroke patient during initial and subsequent assessments (4). The NIHSS, on the other hand, evaluates patients on 11 different parameters and has been found to be an excellent predictor of patient outcomes. A baseline NIHSS score more than 16 indicates a strong probability of mortality, while a baseline NIHSS score less than 6 indicates a strong probability of a good recovery (5).
associated with a poor prognosis in acute myocardial infarction and peripheral artery disease. RDW has also been evaluated as a predictor of mortality in patients with cardiovascular disease, cancer, chronic lung disease, symptomatic chronic congestive cardiac insufficiency and acute cardiac insufficiency (7, 8). Utility of RDW in predicting stroke severity, is still being evaluated. In this study, we tried to correlate RDW with the severity of acute ischemic stroke and also tried to find out whether RDW can be used as a predictor of mortality in acute ischemic stroke.
Methods
Study Design and setting
This correlation study was conducted over a period of 2 years from 2015 to 2017 in a 3100- bedded tertiary care hospital in the city of New Delhi, India. The study was approved by the Institute Ethics Committee (IEC/VMMC/SJH/October-2015). Selection of participants
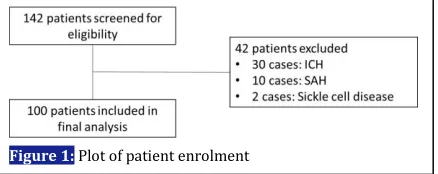
Patients aged ≥ 18 years presenting to the ED within 24 hours of the onset of clinical signs and symptoms suggestive of AIS were included. During the study period, all consecutive patients of stroke were screened for eligibility criteria and of the 142 patients presenting with AIS, 100 were included and profiled as part of this study (Figure 1). Written and informed consent was taken from all the participants in the study. A sample size of 89 was deemed adequate based on a previous study by Kim et al. (9), with anticipated mean RDW in our study group of 13.5 with alpha of 0.05 and power of 80%.
Method of measurements
A detailed history and clinical examination was done in all patients. GCS and NIHSS score was calculated for all the patients at the time of presentation after which the patients were subjected to non-contrast computed tomography (NCCT) scan and blood samples were taken for analysis. Stroke severity was measure based on NIHSS and GCS score. On the NIHSS score of a score of 0-4 is minor stroke, 5-15 is moderate stroke, 16-20 is moderate to severe stoke and > 21 is severe stroke. On the GCS scale, a score of >13 is minor stoke, 9-12 is moderate stroke and < 8 is severe
stroke.
RDW was measured for all the patients who were included in the study. For measurement of RDW, 2 ml of venous blood was collected in ethylenediaminetetraacetic acid (EDTA) vials and samples were kept at room temperature before processing and analysis. The samples were processed in automated cell counter (Pentra ES 60) within 2 hours. Patients with NCCT scan having any evidence of intra-cerebral hemorrhage (ICH), subdural hematoma (SDH), subarachnoid hemorrhage (SAH), intra-cerebral mass, or cerebrovascular damage secondary to trauma were excluded from this study. Patients with any evidence of concurrent infection or known immunological disorders or malignancy were also excluded from this study. Current use of iron, folic acid, or vitamin B12 supplements and presence of hemoglobinopathies or other conditions that may be associated with abnormal RDW such as sickle cell anemia, thalassemia and other anemia’s also made the patients ineligible for this study.
Primary data analysis
All the observations were entered in proforma for further statistical analysis. Categorical variables were presented in number and percentage (%) and continuous variables were presented as mean ± SD and median. Normality of data was tested by Kolmogorov-Smirnov test and Shapiro-Wilk test. If the normality was rejected, then non parametric test was used. Quantitative variables were compared using Kruskal-Wallils test (as the data sets were not normally distributed) between the groups. Spearman correlation coefficient was used to assess the association of GCS Score, NIHSS score and RDW. A p-value of <0.05 was considered statistically significant. The data was entered in MS EXCEL spreadsheet and analysis was done using Statistical Package for Social Sciences (SPSS) version 21.0.
RESULTS
Characteristics of study subjects
Table 1 presents the basic characteristics of the study subjects. Of the 100 patients analyzed, 64 cases were male and the rest 36 cases were female. Majority of the patients (33 cases) were in the age group of 51-60. Mean age of the patients was 60+11.9 years. A focal neurological deficit was present in 92% of the patient. When the GCS score was used to assess the severity of stroke, 31 patients had GCS between 13-15 (minor stroke) and 26 patients had GCS score ≤ 8 (severe stroke). When the severity was assessed using the NIHSS score, 32 patients (32%) had minor stroke (NIHSS
score 0-4) and 24 (24%) had severe stroke (NIHSS score 21-42). The median RDW of study cases was 13.9 (12.8-15.8).
RDW in relation to GCS and NIHSS
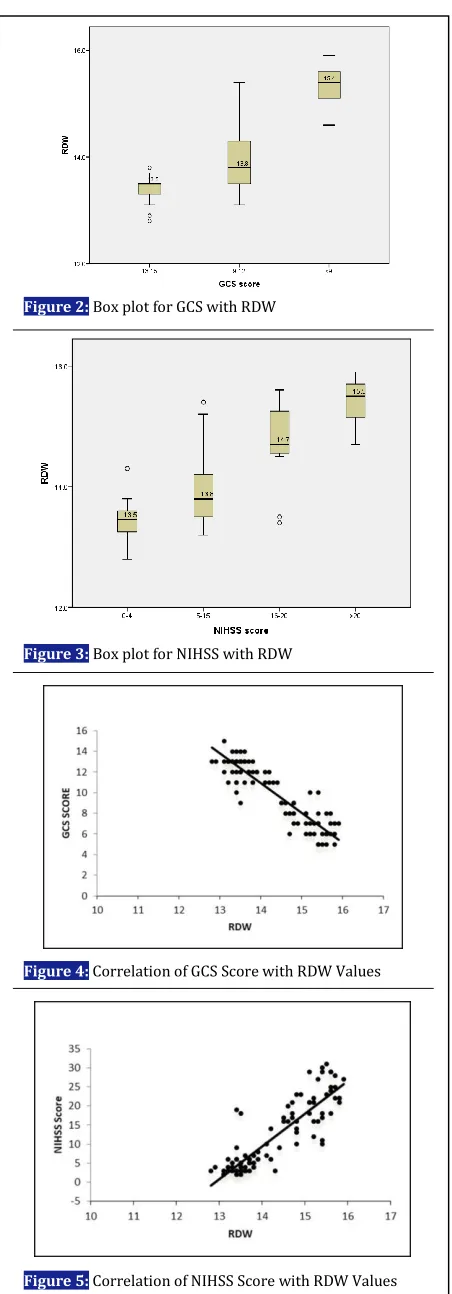
The median (IQR) RDW in the patients with minor stroke on the basis of GCS Score was 13.5 (13.3-13.5), the median (IQR), RDW in the patients with moderate stroke was 13.8 (13.5-14.4) and the median (IQR) RDW in the patients with severe stroke was 15.4 (15.1- 15.6). This distribution of RDW in relation with severity of stroke was statistically significant (p<0.001) (Figure 2). The median (IQR) RDW in the patients with minor stroke on the basis of NIHSS Score was 13.4 (13.2 – 13.6), the median (IQR) RDW in the patients with moderate stroke was13.8 (13.5-14.3), the median (IQR) RDW in the patients with moderate to severe stroke was 14.7 (14.5-15.3) and the median (IQR) RDW in the patients with severe stroke was 15.5 (15.1-15.7). This distribution of RDW in relation with severity of stroke was also statistically significant (p<0.001) (Figure 3).
In our study, the correlation coefficient of GCS with RDW was -0.858 and the p-value of this correlation
Figure 2: Box plot for GCS with RDW
Figure 3: Box plot for NIHSS with RDW
Figure 4: Correlation of GCS Score with RDW Values
Figure 5: Correlation of NIHSS Score with RDW Values
Table 1: Basic characteristics of the study subjects
Characteristics Number (%)
Age (year)
<40 41-50 51-60 61-70 >70
5 (5 %) 16 (16 %) 33 (33 %) 25 (25 %) 21 (21 %)
Sex
Male
Female 36 (36%) 64 (64%)
Presenting clinical features
Focal neurological deficit Deviation of angle of mouth Altered consciousness Difficulty in speaking Loss of consciousness Headache
Seizures Nausea Vomiting
92 (92%) 58 (58%) 40 (40%) 39 (39%) 30 (30%) 10 (10%) 9 (9%) 8 (8%) 3 (3%)
Risk factors
Hypertension Diabetes Smoking
39 (39%) 31 (31%) 23 (23%)
GCS score
13-15 (mild) 9-12 (moderate) < 9 (severe)
31 (31%) 33 (33%) 36 (36%)
NIHSS score
0-4 (mild) 5-15 (moderate)
16-20 (moderate to severe) 21-42 (severe)
was <0.001 which was statistically significant (Figure 4). The correlation coefficient of NIHSS score with RDW was 0.84 and the p-value of this correlation was <0.001 which was also statistically significant (Figure 5). We compared correlation coefficient of each groups with RDW and the results present in table 2.
Majority of the patients (96%) were discharged after a variable hospital stay of 2-8 days while 4% of the patients died. The median (IQR) RDW in the patients who were alive was 13.8 (13.5 -15.1) and the median (IQR) RDW in the patients who expired was 15.5 (14.5 -15.7). The distribution of RDW in relation to mortality was also statistically significant (p=0.048).
DISCUSSION
We observed that increased stroke severity was associated with higher RDW. A higher RDW was also associated with increased risk of mortality. Therefore, RDW may be a potential predictor for stroke severity and mortality from acute ischemic stroke.
With improving advances in stroke care, there is a felt need for a bedside test that predicts the severity of stroke and compliments the clinical diagnosis, thereby helping in prognostication (10). RDW has been studied as an inflammatory marker in acute myocardial infarction, peripheral vascular disease and stroke (7-11). We studied the correlation between RDW and stroke severity assessed by GCS and NIHSS score. The results reveal a significant correlation of increasing RDW with stroke severity.
Chronic inflammatory process leads to the development of atherosclerosis which in turn increases the risk of ischemic stroke. Furthermore, inflammation may contribute to morphologic changes in red blood cells by altering the membrane proteins (12). High oxidative stress prolongs the survival of red blood cells and causes premature release of large red blood cells into the peripheral circulation, thereby raising the RDW
(11).
In our study we found that RDW increased with increasing severity on GCS and NIHSS scores. The finding was in line with the similar studies conducted Kara et al. (13) and Ntaios et al. (14). A significant association has also been reported between NIHSS score and RDW value on ED admission by Gianni Turcato et al. who reported that both the values of RDW (14.0% versus 13.6%; p < 0.001) and the NIHSS score (12 versus 4; p < 0.001) at admission, were found to be significantly increased in patients of acute ischemic stroke with unfavorable outcome compared to those with favorable outcomes (15).
RDW has been shown powerful predictor of mortality in community-dwelling older adults with and without age-associated diseases (16). The mean age of patients in our study was 60+11.9 years with 39 patients being hypertensive. The older mean age and associated co-morbidity cab be confounding factors that could reduce RDW’s specificity for stroke. Our study also revealed that in patients who died, the RDW was high (15.12 vs 14.23, p = 0.48). A similar study by Ani et al. (11), showed that baseline RDW was higher among persons with known stroke who later died versus who remained alive (13.9% vs.13.4%, p <0.001). Studies have shown an increased risk of 30-day mortality is seen in critically ill patients who had an elevated RDW at the onset of critical care (17, 18). Limitations
Our study has the limitation of including homogenous population from single center study. We did not take control groups for comparison. An age and sex matched control group would have helped in correlating RDW values in stroke patients. Also, we could have followed up the patients proactively after discharge to look for short term mortality.
CONCLUSIONS
Based on the findings of this study, RDW index has statistically significant correlation with the severity
Table 2: Correlation of RDW and severity of stroke (GCS and NIHSS)
Severity index Correlation coefficient P-value
GCS
13-15 (mild) -0.083 0.659
9-12 (moderate) -0.485 0.004
< 9 (severe) -0.407 0.014
NIHSS
0-4 (mild) 0.211 0.246
5-15 (moderate) 0.717 <0.001
16-20 (moderate to severe) 0.153 0.586
21-42 (severe) 0.155 0.469
of AIS. So it can potentially be an important parameter to predict the prognosis of AIS patients.
ACKNOWLEDGEMENTS
We would like to thank our colleagues from department of medicine for their help in management of the cases.
AUTHORS’ CONTRIBUTION
RMo, UM, and NN conceived the study and designed the trial. RMo and NN supervised the conduct of the trial and data collection. UM, RMa and RMo undertook recruitment of patients and managed
the data, including quality control. RMa and UM provided statistical advice on study design and analyzed the data; RMo chaired the data oversight committee. RMa drafted the manuscript, and all authors contributed substantially to its revision. All authors take responsibility for the paper as a whole.
CONFLICT OF INTEREST
None declared.
FUNDING
None declared.
REFERENCES