City, University of London Institutional Repository
Citation
:
Andrienko, N., Andrienko, G. & Rinzivillo, S. (2016). Leveraging spatial
abstraction in traffic analysis and forecasting with visual analytics. Lecture Notes in
Computer Science, 9853 L, pp. 32-35. doi: 10.1007/978-3-319-46131-1_7
This is the accepted version of the paper.
This version of the publication may differ from the final published
version.
Permanent repository link:
http://openaccess.city.ac.uk/15470/
Link to published version
:
http://dx.doi.org/10.1007/978-3-319-46131-1_7
Copyright and reuse:
City Research Online aims to make research
outputs of City, University of London available to a wider audience.
Copyright and Moral Rights remain with the author(s) and/or copyright
holders. URLs from City Research Online may be freely distributed and
linked to.
adfa, p. 1, 2011.
© Springer-Verlag Berlin Heidelberg 2011
Leveraging Spatial Abstraction in Traffic Analysis and
Forecasting with Visual Analytics
Natalia Andrienko1,2, Gennady Andrienko1,2, and Salvatore Rinzivillo3
1
Fraunhofer Institute IAIS, Sankt Augustin, Germany 1stname.2nd[email protected]
2
City University London, UK
3
Istituto di Scienza e Tecnologie dell'Informazione, Area della Ricerca CNR, Pisa, Italy [email protected]
Abstract. By applying spatio-temporal aggregation to traffic data consisting of vehicle trajectories, we generate a spatially abstracted transportation network, which is a directed graph where nodes stand for territory compartments (areas in geographic space) and links (edges) are abstractions of the possible paths be-tween neighboring areas. From time series of traffic characteristics obtained for the links, we reconstruct mathematical models of the interdependencies be-tween the traffic intensity (a.k.a. traffic flow or flux) and mean velocity. Graph-ical representations of these interdependencies have the same shape as the fun-damental diagram of traffic flow through a physical street segment, which is known in transportation science. This key finding substantiates our approach to traffic analysis, forecasting, and simulation leveraging spatial abstraction. We present the process of data-driven generation of traffic forecasting and simula-tion models, in which each step is supported by visual analytics techniques.
1
Introduction
2
Approach summary
Given a set of trajectories, we apply a method [2] that derives an abstracted network consisting of territory compartments (further called cells) and links between them. In brief, the method organizes points sampled from the trajectories into groups fitting in circles of a user-specified maximal radius. The medoids of the groups are taken as generating seeds for Voronoi tessellation. Smaller or larger cells (Voronoi polygons) can be generated by varying the maximal circle radius, thus allowing traffic analysis at a chosen spatial scale. Moreover, it is possible to vary the spatial scale across the territory depending on the data density [1]. Next, the trajectories are transformed into
flows (aggregate movements) between the cells by time intervals. For each pair of
neighboring cells (Ci, Cj) and each time interval Tk, the flow is an aggregate of all
moves from Ci to Cj that ended within the interval Tk and started within either Tk or
Tk-1. The flow is characterized by the number of moves and the mean speed (velocity)
of the movement. The number of moves (traffic volume) per time interval is called
traffic intensity (a.k.a. traffic flow or flux). Since available trajectories typically cover
only a sample of vehicles that move within a network and not the entire population, the computed traffic intensities need to be appropriately scaled, to approximate real intensities. Appropriate scaling parameters or functions can be derived by comparing the computed vehicle counts with measured counts obtained from traffic sensors [7].
To study and quantify the relationships between the traffic intensities and mean speeds, the data are further transformed in the following way. Let A and B be two time-dependent attributes associated with the same link and defined for the same time steps. The value range of attribute A, which is taken as an independent variable, is divided into intervals. For each value interval, all time steps in which values from this interval occur are found, and all values of attribute B occurring in the same time steps are collected. From these values of B, summary statistics are computed: quartiles, 9th decile, and maximum. For each statistical measure, a sequence of values of B corre-sponding to the value intervals of A is constructed. These sequences are called
de-pendency series. We first take the traffic intensity as the independent variable and
derive dependency series of the mean speed. Then we take the mean speed as the independent variable and derive dependency series of the traffic intensity. Dependen-cy series may be derived using either the absolute or relative traffic intensities, the latter being the ratios or percentages of the absolute intensities to the maximal intensi-ties attained on the same links.
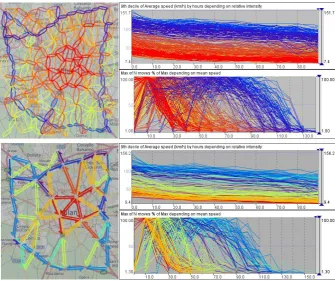
sym-bols on the map and lines in the graphs represents the cluster membership. The shapes of the dependency lines are very similar to the curves in the fundamental diagram of traffic flow describing the relationship between the flow velocity and traffic flux [5, 6] in a physical transportation network consisting of street segments. We see that the same relationships exist also in a spatially abstracted network. Moreover, we have found that the relationships conforming to the fundamental traffic diagram exist on different levels of spatial abstraction, as illustrated in Fig.1.
We have developed interactive visual tools supporting derivation of formal models from the time series of flow characteristics and from the dependency series [3]. Mod-els are built for clusters of links rather than individual links, to avoid over-fitting and reduce the impacts of noise and local outliers. Predictions made for link clusters are individually adjusted for each link based on the statistics of its original values [3]. We have also developed a novel traffic simulation algorithm that can directly work with the derived models. The main idea is following: for each link, the algorithm finds how many vehicles need to move through it in the current minute, determines the mean speed that is possible for this link load (using the dependency model from the traffic intensity to the mean speed), then determines how many vehicles will actually be able to move through the link in this minute (using the dependency model from the mean
[image:4.595.130.466.145.427.2]Fig. 1. The maps show spatially abstracted transportation networks of Milan with cell radii about 2km (top) and 4 km (bottom). The graphs to the right of each map represent the
speed to the traffic intensity), and then promotes this number of vehicles to the end place of the link and suspends the remaining vehicles in the start place of the link.
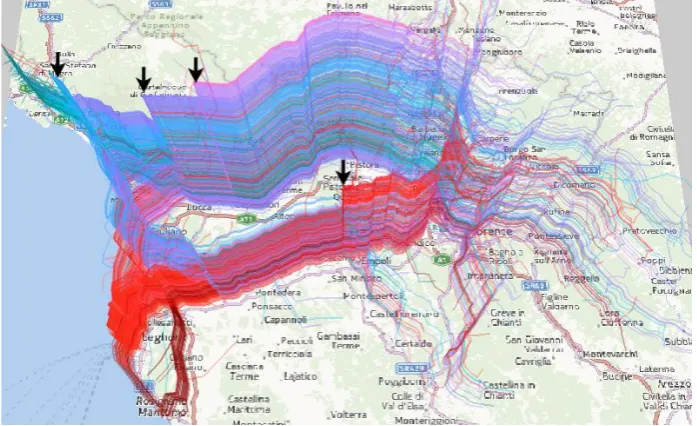
To perform a simulation, the analyst defines a scenario. A wizard guides the ana-lyst through the required steps and providing visual feedback at each step. We de-scribe the simulation of a scenario of mass evacuation from the coastal area in Tusca-ny (Italy). The appendix to the paper (http://geoanalytics.net/and/is2015/) includes a video demonstration of the process of model building, scenario definition, simulation, and exploration of results supported by interactive visual interfaces.
References
1. Andrienko, G., Andrienko, N., Bak, P., Keim, D., and Wrobel, S. Visual Analytics of
Movement. Springer, 2013.
2. Andrienko, N., Andrienko, G. Spatial Generalization and Aggregation of Massive Move-ment Data, IEEE Trans. Visualization and Computer Graphics, 17(2): 205-219, 2011. 3. Andrienko, N., Andrienko, G. A Visual Analytics Framework for Spatio-temporal
Analy-sis and Modeling, Data Mining and Knowledge Discovery, 27(1): 55-83, 2013.
4. Andrienko, N., Andrienko, G., and Rinzivillo, S. Leveraging Spatial Abstraction in Traffic Analysis and Forecasting with Visual Analytics, Information Systems, 57(1): 172-194, 2016; Appendix: http://geoanalytics.net/and/is2015/
5. Gazis, D.C. Traffic Theory, Kliwer Academic, Boston, USA, 2002. 6. http://en.wikipedia.org/wiki/Fundamental_diagram_of_traffic_flow
7. Pappalardo, L., Rinzivillo, S., Qu, Z., Pedreschi, D., and Giannotti, F. Understanding the Patterns of Car Travel. European Physics Journal Special Topics, 215, 61–73, 2013.
[image:5.595.124.473.148.361.2]Fig. 2. For a scenario of mass evacuation from the coastal areas in Tuscany (Italy), simulated car trajectories are represented in a space-time cube, where two dimensions represent