University of New Orleans University of New Orleans
ScholarWorks@UNO
ScholarWorks@UNO
University of New Orleans Theses and
Dissertations Dissertations and Theses
Spring 5-19-2017
Overwash Controls on Barrier Island Morphodynamics during
Overwash Controls on Barrier Island Morphodynamics during
Storms
Storms
Joshua H. Alarcon [email protected]
Follow this and additional works at: https://scholarworks.uno.edu/td Part of the Geology Commons
Recommended Citation Recommended Citation
Alarcon, Joshua H., "Overwash Controls on Barrier Island Morphodynamics during Storms" (2017). University of New Orleans Theses and Dissertations. 2289.
https://scholarworks.uno.edu/td/2289
This Thesis is protected by copyright and/or related rights. It has been brought to you by ScholarWorks@UNO with permission from the rights-holder(s). You are free to use this Thesis in any way that is permitted by the copyright and related rights legislation that applies to your use. For other uses you need to obtain permission from the rights-holder(s) directly, unless additional rights are indicated by a Creative Commons license in the record and/or on the work itself.
Overwash Controls on Barrier Island
Morphodynamics during Storms
A Thesis
Submitted to the Graduate Faculty of the
University of New Orleans
In partial fulfillment of the
Requirements for the degree of a
Master of Science
In
Earth and Environmental Science
By
Joshua Holland Alarcon
B.A. Tulane University, 2011
ii
Acknowledgements
This master’s thesis is considered a major personal accomplishment and hopefully will serve as a
stepping stone to further wonderful endeavors. The completion of this research would not have
been possible without the support and guidance of my committee and others who contributed to
the advancement of this research. I would first like to thank my major professor, Dr. Ioannis
Georgiou, who has led me on a path of becoming a more driven, ambitious, and curious student.
I owe my highest gratitude to Dr. Georgiou for instilling in me a higher level of knowledge and
greater sense of appreciation for the world around me. I would also like to thank my committee
members, Dr. Mark Kulp and Dr. Martin O’Connell for their continued support and guidance
throughout this research as well as the Earth and Environmental Science Program. Special
thanks also goes out to Mikkel Andersen who granted me permission to use MIKE 21 by DHI
for the purpose of this research and to Kevin Hanegan who taught me a great deal of numerical
modeling techniques in MIKE 21 that allowed me to fulfill my research requirements. Finally, I
would like to thank my friends, family and colleagues who provided me with love,
iii
Table of Contents
List of Figures ... iv
List of Tables ...v
Abstract ... vi
Introduction ...1
Background and Significance ...3
Barriers ...3
Shoreface...4
Overwash ...7
Objective ...12
Methods...13
Model setup ...13
Boundary Conditions ...13
Barrier morphology templates ...15
Experimental design...18
Metrics for evaluating barrier response ...19
Results ...22
Upper shoreface ...22
Dune ...24
Backbarrier ...33
Backbarrier lagoon ...33
Discussion ...34
Upper shoreface ...34
Dune ...36
Backbarrier ...37
Backbarrier lagoon ...38
Profile evolution...38
Summary and Conclusions ...43
Implications for barrier island restoration...44
References ...45
iv
List of Figures
Figure 1. Barrier Profile as defined by Dean and Dalrymple, 2004. ...6
Figure 2. Seven barrier responses to overwash as proposed by Donnelly, 2007 ...11
Figure 3. Time series input files. ...14
Figure 4. The process of building a bathymetry from the master definition profile (.mdf). ...16
Figure 5. Dune crest widths and shoreface slopes ...17
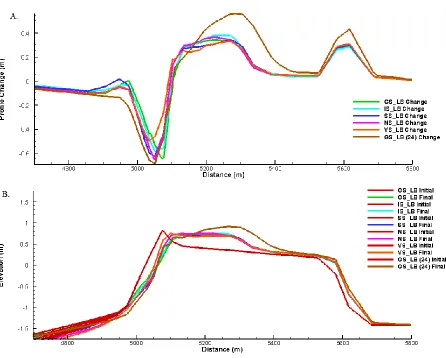
Figure 6. Profile change and Initial/Final profile for each shoreface slope on the low barrier dune crest ...23
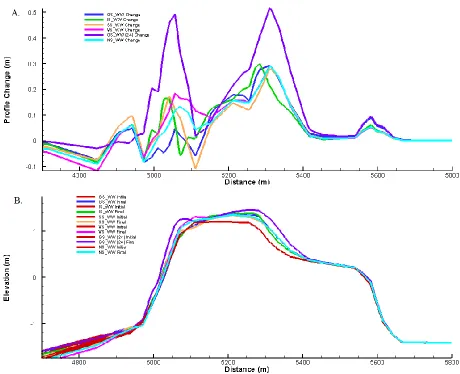
Figure 7. Profile change and Initial/Final profile for each shoreface slope on the wide barrier dune crest ...26
Figure 8. Profile change and Initial/Final profile for each dune crest width on the gentle shoreface slope ...28
Figure 9. Profile change and Initial/Final profile for each dune crest width on the very steep shoreface slope ...29
Figure 10. Profile evolutions of the low barrier and wide crest width on the gentle shoreface slope ...30
Figure 11. Profile evolutions of the low barrier and wide crest width on the very steep shoreface slope ...31
Figure 12. Profile change and Initial/Final profile for the low barrier and wide dune crest on the gentle slope for the twelve versus twenty-four day period ...32
Figure 13. Profile Evolution for the gentle shoreface slope low barrier at hours 48, 72 and 110 .39 Figure 14. Profile Evolution for the very steep shoreface slope low barrier at hours 48, 72 and 110...41
v
List of Tables
Table 1. Simulation Matrix ...19
Table 2. Shoreline erosion rates at mean sea level ...24
vi
Abstract
Overwash, shoreface retreat, and barrier migration are common processes occurring in
transgressive barrier island systems, the scale of which is exacerbated by sea level rise,
subsidence and the frequency and magnitude of tropical and extratropical storms. Barrier
morphology also clearly plays a key role in determining a morphological response to these
processes. Using a hydrodynamic and sediment transport model (MIKE21) and selected barrier
island and shoreface templates, informed by deltaic and coastal plain systems in the northern
Gulf of Mexico, I performed simulations to determine barrier morphology in response to storms.
A low dune with a gentle shoreface slope, characteristic of Louisiana deltaic barriers,
demonstrates the greatest amount of shoreline erosion, dune overwash and barrier migration in
response to a storm. Profile evolutions over time demonstrate the wider dune templates respond
mostly via dune aggradation and barrier rollover whereas the narrow or low templates respond
via dune overwash and barrier translation. Determining which barrier templates retain the most
sediment over time becomes extremely important when planning coastal restoration projects here
in Louisiana.
1
Introduction
Barrier island systems are important coastal landforms that harbor important marine life
and act as a buffer to coastal ecosystems against storm surge and wave action (Barbier et al.,
2013). The overall shape and volume of sand within barrier island systems fluctuate over time as
a response to changes in relative sea level rise, sediment supply, the incidence of storms, and
proximal substrate composition (Ritchie & Penland, 1988; List et al., 1997). The Louisiana
coastline experiences some of the highest rates of wetland loss in the United States (16.57mi² per
year from 1985 to 2010) due in part to high rates of subsidence, eustatic sea level rise, and a high
frequency of tropical and extratropical storms (Miner et al., 2009; Couvillion et al., 2011;
Georgiou et al. 2005). Currently, barrier islands in Louisiana, characteristic of low barriers with
gentle shoreface slopes, are in a transgressive phase, undergoing fragmentation due to an
ongoing rise in sea level and a lack of sediment supply. They are also subjected to frequent
erosion events from storm-induced transport including overwash and/or lateral transport. (Stone
et al., 2005; Georgiou et al., 2005; Miner et al., 2009). Barrier overwash, referred to as
washover, promotes the cross-shore landward transfer of sediment across the barrier leading to
migration of a barrier over time (Matias et al., 2009; Lorenzo-Trueba & Ashton, 2014). The
variation in barrier response produced by a storm is highly dictated by the morphology of the
shoreface slope and barrier template (Donnelly, 2007; Lorenzo-Trueba & Ashton, 2014). The
goal of this research is to a) explore the relationship between shoreface morphology and
overwash volume, leading to the landward migration of such landforms during the ongoing
transgression b) examine various nourishing templates for barriers to determine which can help
offset or reduce sediment loss from the system and help maintain subaerial extent for longer
short-2
term and decadal time-scales through the use of a morphodynamic model called MIKE 21.
MIKE 21 by DHI is a 2D process based coastal hydrodynamic and morphology model with
multiple applications and capabilities. Because Louisiana’s barriers are eroding and
disappearing at rapid rates, the importance of effective coastal protection grows exponentially
every day. Increasing the accuracy of scientific predictions will allow for improved coastal
3
Background and Significance
Barriers
The origin of barriers has been proposed and debated by a number of scientists including
DeBeaumont (1845), Gilbert (1885), McGee (1890), Shepard (1960), Hoyt (1967) and Otvos
(1970), but Short (1999) building on statements first promulgated by Swift (1975), states there is
now common agreement that barriers form at sea level on suitable substrates by the action of
waves and tides and that most modern barriers were established in the late Postglacial marine
transgression in the mid-to late Holocene. In fact, Short (1999) states that the only essential
prerequisites for barrier formation are a) accommodation space, b) ample sediment supply and c)
waves to transport the sediment offshore into the accommodation space; and that subsequently
tides, winds and sea level change will rework the sediment creating inlets and backbarrier
deposits.
Barriers may exist in different marine settings including a) regressive sea level or
progradational setting and b) transgressive sea level or retrogradational setting (Riggs, Cleary &
Snyder, 1995). Short (1999) established that during a transgressive (rising) sea level setting, four
barrier types may form depending on the rate of sea level rise, sediment supply and substrate
slope including 1) prograded barriers and strandplains which prograde due to the landward
transport of sediment from a local major sediment source, 2) retrogradational barriers which
occur on coasts experiencing relative sea level rise, 3) retrogradational coastal plains and 4)
retrogradational attached barriers. The evolution of the Mississippi River Delta Plain (MRDP)
creates unique conditions and opportunities for the formation of deltaic barriers through shifting
depocenters creating delta complexes facilitated by upriver avulsions during the Holocene. This
4
including compaction of Holocene sediments (Penland & Boyd, 1981). Penland and Boyd
(1981) suggested a cycle by which deltaic barrier islands can be formed and submerged over
time. Initially, in the abandonment phase, a delta complex is abandoned and course grained
sediments from distributary sand bodies are reworked creating an erosional headland with
flaking barriers. Second, in the detachment phase, subsidence creates an open water lagoonal
environment behind the barriers causing a separation from the mainland and creation of a
transgressive barrier island arc. During the last phase of barrier formation, the submergence
phase, continued subsidence and lack of fluvial sediments result in the transformation of barriers
to inner shelf subaqueous shoals (Penland & Boyd, 1981). The authors emphasize that unless a
reoccupation takes place where an active delta can introduce new fluvial sediments to the region,
the subaqueous shoals will continue to degrade.
Shoreface
The shoreface extends from the upper limit of wave runup on the beach seaward to the
point at which changes to the overall barrier profile are considered negligible, also termed the
Depth of Closure (DoC) (Short, 1999). When considering morphological effects along a barrier
island profile (from subaerial dunes to the toe of the shoreface) and the processes associated with
that profile (e.g., overwash on barrier island systems) it becomes evident that success of the
analysis will depend on carefully selecting the DoC which is a challenging endeavor due to its
highly variable nature. The DoC is a function of the various physical processes occurring along
the barrier island geometry over time (Nicholls, Birkemeier & Hallermeier, 1996). Due to the
difficulty in calculating the DoC, an assumption is often made concerning the exact location of
this point. Hallermeier (1981) was one of the firsts to define the DoC using the following
5
𝑑1 = 2.28𝐻𝑒 − 68.5 (𝐻𝑒2
𝑔𝑇𝑒2) (1)
where d1 represents the calculated DoC, He and Te are the local significant wave height and
wave period exceeding only 12 hours per year (0.137% of the time) and g is the acceleration due
to gravity (Sabatier, Stive & Pons, 2004). Despite the presence of this equation, difficulty in
defining the DoC leads to a difficulty in defining the gradient slope of the shoreface. The
significance of the shoreface is in the sediment exchange between the continental shelf (seaward)
and backshore beach and dunes (Short, 1999). The rate of sediment supply to the barrier from
nearby sources on the shelf alters the overall shape and response of a barrier system to physical
forces and the morphology of the dune restricts the deposition of the overwash volume
(Donnelly, Kraus & Larson, 2006). The slope of the shoreface is important in dictating the dune
crest morphological response during storm events (Short, 1999).
Niedoroda and Swift (1991) characterized the shoreface as a compound form consisting
of two concave-up elements separated by an inflection point (upper and lower shoreface). The
upper shoreface is defined as the region in which accretion and erosion result in significant (or
measurable) changes in bed elevation in a given year (Short, 1999). More specifically, the upper
shoreface ranges from the beach berm to an inflection point representative of a change in
shoreface slope and substrate composition. As change in bed elevation is largest in the vicinity
of the beach face and decreases progressively offshore, Stive and Vriend (1995) appropriately
refer to the upper shoreface as the active zone. The lower shoreface represents a change in slope
gradient and sediment grain size and extends from the lower limit of the upper shoreface to the
outer DoC (Figure 1). The lower shoreface may require millennia to evolve toward equilibrium
whereas the upper shoreface may adjust toward equilibrium within days to weeks in response to
6
According to Short (1999), shoreface equilibrium may or may not exist at all considering
the relative time scale. On a large enough time scale (>1000 years) shoreface equilibrium
becomes evident, but on a shorter timescale (<1000 years) changes in equilibrium occur as a
function of fluctuating sea level. The shoreface may exhibit a Null-point Equilibrium in which
there is a balance in forces between waves pushing sediment onshore and gravity pulling
sediment offshore. Regardless of the state of equilibrium, the most important pattern as
identified by Short (1999) is the covariation of shoreface slope and near-bed wave orbital
velocities as both decrease progressively offshore as the reduction in near-bed wave action is
attributed to the effect of increasing water depth. The slope of the shoreface then, inherently,
becomes important in not only breaking waves and dissipating energy, but defining the barrier
profile and dictating morphological responses to cross-shore transport. In fact, beaches and
barriers will only develop on slope gradients between 0.05 and 0.8 with a predicted optimum
7
gradient of 0.1 (Short, 1999). On gentle sloping shelves (<0.05), frictional wave shoaling
decreases wave energy progressively landward to the point where wave energy becomes
incapable of reworking the sediment enough to create a beach or barrier profile whereas on a
steep sloping shelf (>0.8), sediment may be transported offshore rather than onshore.
Consequently, the slope of the shoreface exhibits a morphological control on the process of
overwash and ultimately barrier migration.
Overwash
Overwash is an important physical process capable of significantly altering coastal
morphology on beach and barrier systems. Overwash is a type of cross-shore sediment transport
defined by Leatherman (1981) as “the flow of water and sediment over the crest of the beach that
does not directly return to the water body where it originated”. This occurs if either wave runup
level or storm surge level exceeds the beach crest height (Donnelly et al., 2006). Overwash can
actually result in increased elevation (height) or width of the subaerial exposure of a barrier
island through deposition of sediment directly on top of the crest or on the backbarrier
respectively; but can also result in the formation of washover fans or sheets and ultimately
leading to landward translation (migration) of a barrier profile (Short, 1999).
There have been multiple attempts to quantify the effects of overwash in a coastal
environment including the first estimation by Bruun (1956) termed the Bruun Rule, which
measured overwash based on simple barrier geometric calculations and an assumption of barrier
equilibrium via coastal profile translation (List et al., 1997). The Bruun Rule measures shoreline
retreat rates based on sea level rise (SLR) and the distance and height of the DoC to the
8
𝑠 =𝑎𝑙
ℎ (2)
where ‘s’ is shoreline retreat, ‘a’ is SLR, and ‘l’ and ‘h’ are the length (distance) and height
offshore to the DoC (List et al., 1997). Bruun also assumes an equilibrium profile over time that
is translated vertically upwards and horizontally landwards meaning the volume of barrier
sediment is maintained during translation (List et al., 1997). Finally, the biggest shortcoming for
the Bruun Rule is in assigning a single value to the DoC primarily due to the highly variable
nature of the DoC (Cooper & Pilkey, 2004).
Other long-term barrier retreat models have been proposed including Barrier Rollover by
Swift (1975) and Barrier Overstepping by Dean and Maurmeyer (1983), but these models
typically represent long-term (thousands of years to geologic scale) evolution of a barrier. A
noteworthy attempt to quantify the relationship between barrier morphology and coastal
processes via short-term evolution (high magnitude events) is Nguyen et al. (2006) who
established an empirical formula for coastal overwash volume that incorporated three main data
points 1. Maximum wave height 2. Wave period and 3. Water level during the storm. Nguyen’s
equation is based on the assumption that excess runup transports sediment landward the entire
duration of excess runup and is presented as:
𝑄 = 0.0011𝐻𝑐
𝑅 𝑡𝐷
𝑇 (𝑅 − 𝐻𝑐)
2 (3)
where ‘Hc’ is the average height of the dune crest, ‘R’ is the wave runup height, ‘T’ is the wave
period, ‘tD’ is the dune overwash duration and ‘Q’ is the total overwash sediment discharge
transported landward.
Coastal overwash is a natural and frequent process but occurs most frequently following
9
1988). Van Rijn (2013) demonstrated that during high-energy conditions with breaking waves,
the mean water level rises due to the combined effects of the tide, wind and wave forces forming
a wave setup and waves attack the beach (dunes) leading to erosional processes that transport
sediment offshore. Whereas during low-energy conditions, onshore transport related to wave
asymmetry and wave-induced streaming are dominant leading to accretional processes.
Typically, overwash can occur via two mechanisms, runup and inundation. Runup overwash
occurs when wave runup height exceeds the beach or dune crest height depositing sediment
backshore known as washover (Donnelly, Kraus & Larson, 2006). Washover is a lower
magnitude event capable of creating washover fans and terraces (Nguyen et al., 2006; Donnelly,
Kraus & Larson, 2006; and Rosati et al., 2010). Runup overwash can be categorized by three
conditions; (a) relative elevations of water level and the barrier beach, (b) the frequency of waves
that exceed the barrier beach elevation, and (c) the excess wave runup (∆R) which is the
quantitative difference between wave runup height, R, added to the storm surge height, S, minus
the elevation of the dune crest from the mean water level, dc: (Donnelly, Kraus & Larson, 2006)
𝛥𝑅 = 𝑅 + 𝑆 − 𝑑𝑐 (4)
Runup overwash can lead to two alternative effects: 1. crest accumulation (R + S ≈ dc) in
which few waves overtop the dune, so sediment is deposited either on the dune crest or in the
throat of an existing washover leading to a raising of the throat and possible halting of further
overwash and 2. crest lowering (R + S > dc) where waves have enough runup to overtop the
dunes and therefore sediment is eroded from the face of the dune and deposited backshore
(Donnelly, Kraus & Larson, 2006). Runup overwash often leads to the development of
washover fans, sediment transported through the throat deposited backshore, or even washover
10
Inundation overwash occurs when the water level, as a result of storm surge and wave
setup, exceeds the beach or dune crest submerging the barrier island (Donnelly, Kraus & Larson,
2006). The water and sediment transported landward, sluicing overwash or sheet wash, can lead
to either minor inundation (S ≈ dc) in which water flows constantly over the beach or dune crest
causing sediment to erode from the beach face and/or back barrier or complete inundation (S >
dc) in which the entire barrier becomes submerged causing erosion of the shoreline and
deposition of large amounts of sediment inland (Donnelly, Kraus & Larson, 2006). Complete
inundation can sometimes lead to channeling or temporary breaches or even full breaches in the
shoreline.
Lorenzo-Trueba and Ashton (2014) used a reduced complexity model to demonstrate that
barrier systems respond to SLR and overwash via four different mechanisms: height drowning,
width drowning, constant landward retreat, and periodic retreat. They also reported that
shoreline (landward) retreat may occur even in the absence of SLR or under constant
(non-accelerating) SLR demonstrating the complexity of barrier morphology. According to Donnelly,
(2007) overwash can cause fluctuations in volume of sediment transported alongshore but
typically, overwash causes seven types of responses (Figure 2): crest accumulation, landward
translation of dunes/berms, dune lowering, dune destruction, barrier accretion, barrier rollover,
and barrier disintegration. Crest accumulation is thought to be caused by deposition of sediment
from wave run-up as it decelerates up to and on the beach crest; however studies indicate that the
variation in surge level is the controlling factor for crest accumulation and that crest
accumulation occurs primarily at low surge levels, but can also occur at higher surge levels
depending on the width of the crest or if the run-up height is exceeded (Donnelly, Kraus &
11
Very little is known about the mechanisms driving landward translation of dunes or
berms, however migration is often observed for dunes with higher crests or multiple dune
systems and dunes that experience low run-up levels. One hypothesis is that an erosive
overwash event for a wide range of surge levels causes dune lowering followed by dune
accumulation landward restoring the dune to its original height (Donnelly, Kraus & Larson,
2006; and Donnelly, 2007). Dune lowering and dune destruction generally occur under a
threshold surge level for low relative dune widths and a wide range of run-up heights, however
dune volume is a major factor as dunes with lower volumes are more readily destroyed
12
(Donnelly, Kraus & Larson, 2006). Still, it remains difficult to determine whether a dune will be
lowered or destroyed during an overwash event.
The three barrier responses are characterized by higher surge levels, wider beach crest
widths, low crest heights, and low foreshore slopes but may occur for a large range of relative
run-up heights in the absence of a dune (Donnelly, 2007). Donnelly (2007) proposed that barrier
rollover occurs for higher surge and run-up levels than barrier accretion because larger flow
velocities are required to transport sediment into the back barrier bay and barrier disintegration
occurs for even higher surge and run-up levels (Donnelly, 2007). In general, overwash and
windblown sand that is lowered and re-accumulated landward can ultimately result in barrier
migration (Donnelly, Kraus & Larson, 2006: and Donnelly, 2007). Donnelly (2007) not only
demonstrated that morphological responses to overwash can vary as a function of surge height
and barrier geometry, but also showed the importance of dune width and average slope in
relation to defining the barrier profile in order to more accurately predict the overwash response
to a specific event like a hurricane or tropical storm.
Objective
The objective of this study is to examine the relationship of both the shoreface and the
dune morphologies on overwash and barrier landward migration as a result of a tropical storm
period. More specifically, I hypothesized that (1) as the shoreface slope increases, the overwash
and landward translation decrease and (2) as the dune crest width increases, the overwash and
landward translation decrease. I intend to show the high degree of morphological responses
produced by a dynamic environment like a barrier island and that a better understanding of these
responses will enable coastal researchers to identify more resistant barrier templates that could
13
Methods
Model Setup
To test my hypotheses, we used a two-dimensional (2D) coastal and sea model called
MIKE 21 provided by DHI to setup and run simulations of an actual storm period (with
time-dependent water level variations, storm surge, wave height) for a schematized barrier island,
formulated using various barrier island subaerial templates (eg, low-laying, narrow, wide etc).
MIKE 21 is a versatile numerical modeling tool often used for coastal modelling worldwide, and
is capable of simulating physical, chemical and biological processes in coastal or marine settings.
With a number of benefits, MIKE 21 has a suite of submodels designed to study beach and
barrier island morphodynamic responses to events as well as decadal scale evolution for deltaic
barriers in coastal Louisiana, including the following modules specifically used herein: the
Hydrodynamic (HD), Spectral Wave (SW) and Sand Transport (ST) modules. The HD module,
providing the basic computational component of the entire modeling system, can be applied to
the hydraulic processes occurring in lakes, estuaries, bays, coastal areas and seas. The SW
module is not only applicable for predication and analysis of waves on local and regional scales,
but also for the calculation of sediment transport in wave dominated environments. The ST
module enables the user to evaluate the erosion, deposition and transport of non-cohesive
sediment in coastal and offshore environments.
Boundary Conditions (The Storm)
To build our storm period, wind and wave data were obtained from the Wave Information
Study (WIS), an online database containing hourly wind and wave data collected since January
1st, 1980. An actual winter storm period was found dating from January 13th to 26th 2010, a
14
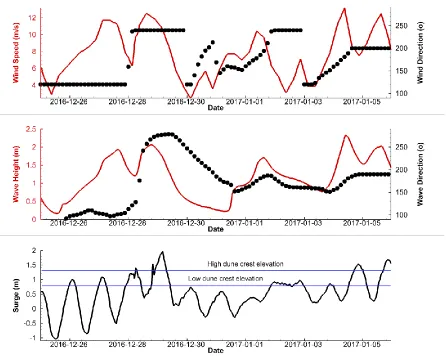
approximately 38km offshore at latitude 28.7 longitude -90.8. Wind (speed and direction) and
wave (speed, direction and spreading index) data were collected from this period to be used in
our simulations (Figures 3b and 3c). Water level data were then collected from the closest
available Tides and Currents station located near Port Fourchon, LA in order to complete our
storm profile (Figure 3a).
Figure 3: Time series input files. For the sake of standardizing all of our input files, we arbitrarily made
December 25th, 2016 at 0:00 am the beginning of the simulation period. Therefore, all of the dates for the
15
Barrier Morphology Templates
The following step was to construct our barrier templates, which in order to standardize
all templates, the same size domain: 1000m wide by 6500m long. For each shoreface profile, the
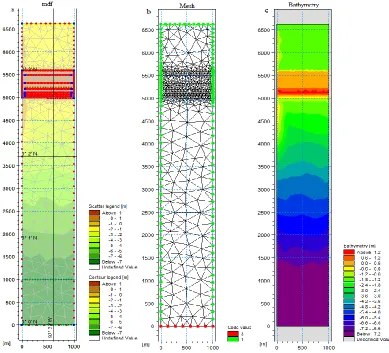
seaward boundary is defined as the open boundary (or code 3) (Figure 4b) to receive the
incoming waves and storm surge. The DoC at the lower shoreface, represented by the open
boundary, is at a depth of 8m for each profile. Regardless of the elevation of the DoC, the focus
of this research was to examine the trends of varying shoreface slopes and dune crest widths in
response to storm events. Because our objective is to specifically measure the response of a
barrier to a storm in terms of dune crest overwash and barrier landward migration, the model
domain or computational mesh was designed with a higher resolution around the dune crest and
subaerial portion of the barrier and an increasingly lower resolution moving offshore to the lower
shoreface and landward to the backbarrier lagoon (Figure 4b). In order to test the response of
various barrier templates to storm events, we varied two elements of the barrier template; the
dune crest width and the shoreface slope. Both of these elements of the barrier profile are
thought to be influencing the magnitude of the response among the various barrier templates to
16
Figure 4: The process of building a bathymetry from the master definition profile (.mdf).
The four templates for the dune crest width profiles include the Narrow Width (NW),
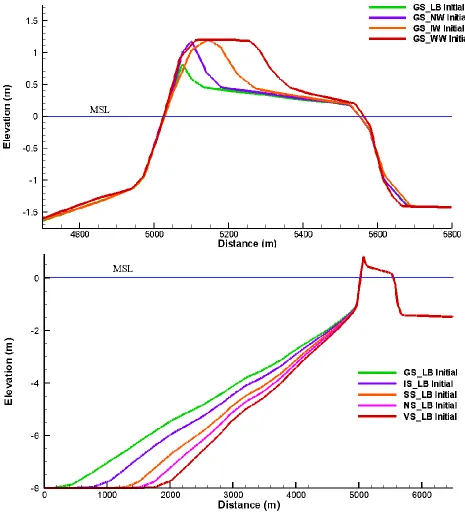
Intermediate Width (IW), Wide Width (WW) and Low Barrier (LB) in which there is essentially
a lower dune. The initial elevation of the dune crest is 1.2m above MSL for NW, IW and WW
and 0.83m above MSL for LB, a dune crest elevation that is common in deltaic barriers (Figure
5a). The templates for the shoreface slope profiles include the Gentle Slope (GS), Intermediate
Slope (IS), Steep Slope (SS), New Slope (NS), and the Very steep Slope (VS) (Figure 5b). The
NS was created after the original set of simulations in order to observe another level of
17
Figure 5: a. The dune crest widths are 50m for NW, 120m for IW, 220m for WW and 10m for LB. b. The
18
Experimental Design
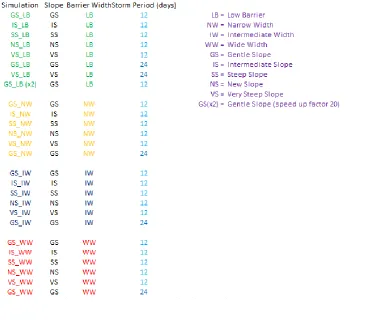
Out of necessity of organizing the number of templates and simulations, a simulation
matrix is created categorizing a total of twenty six simulations based on barrier morphology, i.e.,
the dune crest widths and shoreface slopes (Table 1). Because each simulation was run with the
same twelve day storm period, it was wise to run a sensitivity in order to see the different
responses. Therefore, this sensitivity was examined by doubling the storm period from twelve to
twenty four days simply by doubling the water level, wind and wave files. This was performed
for GS for each dune crest width as well as VS for LB (Table 1). Finally, one additional
sensitivity was examined by varying or doubling the morphological speed up factor. The
morphological speed factor re-cycles hydrodynamic and sediment transport information to infer
bed elevation and morphology changes; an upscaling of ten (10) for example would show barrier
responses resulting from ten times the forcing period, making a 24 day simulation approximately
19
Table 1: Simulation Matrix arranged by increasing dune crest width and increasing shoreface slope.
Metrics for evaluating barrier response
Comparisons of profile evolutions over time show when and how the barrier profiles
respond to the storm. The shoreline erosion rate (SER) is obtained simply by dividing the total
retreat of that profile during the simulation by the number of days in the storm period (either
twelve or twenty four days).
𝑆𝐸𝑅 (𝑚/𝑑) = 𝑡𝑜𝑡𝑎𝑙 𝑟𝑒𝑡𝑟𝑒𝑎𝑡/𝑛𝑢𝑚𝑏𝑒𝑟 𝑜𝑓 𝑑𝑎𝑦𝑠
The dune crest migration rate (DCM) is obtained similarly by dividing the total migration
20
𝐷𝐶𝑀 (𝑚/𝑑) = 𝑡𝑜𝑡𝑎𝑙 𝑚𝑖𝑔𝑟𝑎𝑡𝑖𝑜𝑛/𝑛𝑢𝑚𝑏𝑒𝑟 𝑜𝑓 𝑑𝑎𝑦𝑠
In order to compute the cumulative change in bed level along a profile, the bed level
change and integral bed level change along the profile were calculated first. The change in bed
level is calculated simply by measuring the difference between the final and initial bed level
positions at that point along the profile.
𝐶ℎ𝑎𝑛𝑔𝑒 𝑖𝑛 𝑏𝑒𝑑 𝑙𝑒𝑣𝑒𝑙 = 𝐹𝑖𝑛𝑎𝑙 𝑏𝑒𝑑 𝑙𝑒𝑣𝑒𝑙 − 𝐼𝑛𝑖𝑡𝑖𝑎𝑙 𝑏𝑒𝑑 𝑙𝑒𝑣𝑒𝑙
The integral change along a profile is then measured by multiplying the average of the
changes in bed level between the first and second point by the distance between the first and
second point
𝐼𝑛𝑡𝑒𝑔𝑟𝑎𝑙 = 𝐴𝑣𝑒𝑟𝑎𝑔𝑒(𝑐ℎ𝑎𝑛𝑔𝑒 𝐴 𝑎𝑛𝑑 𝑐ℎ𝑎𝑛𝑔𝑒 𝐵) ∗ (𝑑𝑖𝑠𝑡𝑎𝑛𝑐𝑒 𝑓𝑟𝑜𝑚 𝑝𝑜𝑖𝑛𝑡 𝐴 𝑡𝑜 𝐵)
Finally, measuring the cumulative bed level change along a profile is simple. At the first
point of the profile, the cumulative and integral are the same because that is the only change that
has occurred thus far. At the second point along the profile, the cumulative will be the sum of
the second integral point and the first cumulative point. The third cumulative will be the sum of
the third integral and the second cumulative, and so on and so forth. For example,
𝐶𝑢𝑚𝑢𝑙𝑎𝑡𝑖𝑣𝑒 #8 = 𝐼𝑛𝑡𝑒𝑔𝑟𝑎𝑙 𝑐ℎ𝑎𝑛𝑔𝑒 #8 + 𝐶𝑢𝑚𝑢𝑙𝑎𝑡𝑖𝑣𝑒 #7
There are three important limitations to this research worth mentioning. First and
foremost, the composition of our sediment was 100% sand and therefore lacks the applicability
to muddy environments. The Mud Transport (MT) module under MIKE 21 was not utilized for
this particular research as we are mostly concerned with the barrier lithesome response to storms
21
Second, the model only allows for the transport of sediment in the onshore direction neglecting
the offshore transport of sediment to the lower shoreface. Although this limitation appears
restricting, since the focus is on the subaerial barrier, this assumption can still offer good insights
and usable results. Lastly, the results of these simulations are limited to short-term high
magnitude events such as tropical and extratropical storms and up to the annual time scale and
therefore lacks information on the morphological time scale of barriers from effects due to sea
22
Results
Upper Shoreface
Gentle shoreface slopes and narrow or low dunes are characteristic of barrier islands in
Louisiana. With slopes ranging from 0.155 for the gentle slope to 0.233 for the very steep slope,
the slopes used in our simulations were considered to be all fairly gentle (much less than 0.8 as
identified by Short, 1999 as the steepest slope for barrier development), but are common for
deltaic barriers on low gradient continental shelves (Penland et al., 1988; List et al., 1999).
Results demonstrate upper shoreface erosion as waves from the storm break close to the
shoreline reworking the sediment in an onshore direction leading to shoreline erosion. As a
result of an incoming wave, the upper shoreface is the first domain of the barrier lithesome to
respond.
Results for all shoreface slopes show a fairly uniform change throughout the profile with
the exception of two specific areas; the upper shoreface and the dune crest (Figure 6 a, b).
Sediment erosion in all cases occurs at the upper shoreface followed by a distinct deposition of
sediment on the dune crest and in the back bay (Figure 6a). For the low barrier template, peak
changes in erosive processes occur on the upper shoreface (~0.1m) and shoreline (~0.5m),
whereas peak changes in depositional processes occur at the dune and lagoon, 0.3 m and 0.1 m
respectively (Figure 6a). The backbarrier also reflects a depositional change, the volume of
which, however, is very small. For the wider barrier template, peak changes in depositional
processes occur at the front and back side of the dune resulting in dune aggradation and barrier
rollover and therefore comparatively reduced change occurs in the lagoon (Figure 7a). In fact,
the low dune scenario simulations show significant shoreline erosion (between 26m and 37m)
23
Barriers with a low dune and gentle slope (GS-LB) exhibit the greatest amount of shoreline
erosion (~37m) as expected (Figure 6b), whereas barriers with wider dune crests for the same
slope (GS-WW) show reduced shoreline erosion (~2m) (Table 2). This trend is also repeated for
the steeper slopes where the barrier with a low dune (VS-LB) exhibits similarly large shoreline
erosion (~26m) compared to the wide dune (VS-WW) scenario (-3.0m) (Table 2). The landward
barrier migration trend is similar among the varying shoreface slopes (Figures 6 and 7), but
variability in the response does exist with varying dune crest widths (Figures 8 and 9).
Figure 6: A. Profile change for each shoreface slope on the low barrier dune crest. Negative (-) means
24
Table 2: Shoreline erosion rates at mean sea level (MSL) for each profile.
Dune
The dune system is subjected to the majority of morphologic change throughout
the simulation matrix, as it is highly affected by both the initial morphology of the dune crest (in
terms of both elevation and width) and the shoreface slope. Dune widths used in our simulations
vary from 10m for the low barrier dune to 220m for the wide dune crest. Because no sediment is
25
onshore in the dune and backbarrier (Figure 6b). The dune morphology then exercises control on
the amount of washover in the backbarrier and landward translation in the backbarrier lagoon.
The low dunes experience significant landward translation (Figure 6b), whereas the wider dunes
experiences less translation, more dune aggradation and thus contributing more to barrier
rollover (Figure9b). Barriers with a low dune and gentle shoreface slope (GS-LB) exhibit the
greatest amount of dune crest migration (~149m) as expected (Figure 6b) whereas barriers with
wider dune crests for the same shoreface slope (GS-WW) show reduced dune crest migration
(~96m) (Table 3). This trend is also repeated for the steeper slopes where the barrier with a low
dune (VS-LB) exhibits similarly large dune crest migration (~500m) compared to the wider dune
(VS-WW) scenario which no change was observed. Even though change in dune crest elevation
is small (cm scale) and the result of one storm, twenty five of twenty six profiles exhibited dune
crest aggradation behavior (Figures 9b, Table 3). According to these results, the intermediate
slope with an intermediate dune crest width (IS-IW) experienced the largest change in dune crest
elevation (0.45m). While there is a high degree of change occurring on the dune crest, there is
much less change occurring in the backbarrier and lagoon (see section with cumulative sediment
transport volumes in the backbarrier and lagoon; Figure 7).
Although the overall change in dune crest elevation is insignificant, the majority of the
dunes experience aggradation as a result of wave runup landward onto the dune crest. In terms
of dune crest migration, about one third (7 of 24) of the simulations experience a progradation
(seaward movement) of the dune crest while about two thirds (16 of 24) experience dune
(landward) retreat (Table 3). The low barriers experience the greatest amounts of dune crest
migration as a result of dune morphology. Rosati et al. (2010) showed that dunes with lower
26
substrates. They also show that for barriers in Louisiana where composition of compressible
substrates like mud vary, rates of barrier migration are substantially higher (Figures 10, 11).
Low barriers with gentle shoreface slopes, like those here on the Louisiana coast, have a much
lower sediment volume and therefore are undoubtedly more easily reworked and eroded.
Figure 7: A. Profile change for each shoreface slope on the wide dune crest width. Negative (-) means
27
Table 3: Dune crest migration, elevation and cumulative sediment transport volumes at the shoreface, dune, backbarrier and lagoon for each profile.
The narrow dune widths interestingly respond with a seaward translation or accretion of
the shoreline, likely due to lower wave runup overwash compared to the low dune/barrier
scenarios. As the dune crest widens, the resulting effects brought on by a storm decrease (i.e.
less overwash, migration and backbarrier deposition). The profile evolutions over time reveal a
pertubation of the upper shoreface in which first we note a deposition and seaward migration of
the shoreline followed immediately by erosion and shoreline retreat while at the same time the
dune experiences crest accumulation contibuting to barrier rollover (Figure 11). With a total of
about 26 simulations, about one third (1/3) of them experience a seaward translation of the
shoreline and the rest retreat. While the GS profiles exhibit both barrier rollover and landward
translation of the dune, they also show a variation in response during these processes (changing
28
The VS profiles demonstrate a similar pattern where the change on the dune crest resulting in
barrier rollover and landward translation is dependent upon the initial dune crest morphology
(Figure 9b).
Figure 8: A. Profile change for each dune crest width on the gentle shoreface slope. Negative (-) means
29
Figure 9: A. Profile change for each dune crest width on the very steep shoreface slope. Negative (-)
means erosion and positive (+) deposition. B. Initial and final profile for each corresponding profile.
By examining the specific profile evolutions over time, we observe variance in rates of
change. The majority of profile change as a result of the 280 hour storm occurs in the beginning
of the period before 180 hours as indicated by the blue and green colors (Figures 10 and 11). For
the low dune barrier scenario, the first profile response to the storm occuring in the first 24 to 48
hours is an erosion of the dune (~0.4 m) followed by a washover (~0.25 m thick; 200 m
penetration) and a small landward translation (~25m) of the backbarrier (Figure 10a). For the
wider dune crest scenario, the first profile response to the storm occuring in the first 24 to 48
hours is an erosion of the front of the dune (~0.1 m) followed by a washover (~0.1 m thick; ~20
30
hour 130, which is the peak of storm, both scenarios experienced landward dune migration
ranging from (~148m) for the low dune (GS-LB) to (~96m) for the wide dune (GS-WW).
(Figures 10b).
31
32
Figure 12: A. Profile change for the low barrier and wide dune crest width on the gentle shoreface slope
for the twelve and twenty-four day periods. Negative (-) means erosion and positive (+) deposition. B.
Initial and final profile for each corresponding profile.
We observe an interesting behavior in the change that occurs in the barrier lithesome
between the twelve and twenty-four day periods. Due to a morphodynamic upscaling of 10, the
12 and 24 day storm periods are adjusted to 120 and 240 day periods. The 240 day period
exposes the barrier to storm conditions for a longer duration therefore resulting in greater
amounts of shoreface erosion in turn leading to greater amounts of dune and barrier translation
landward (Figure12; Table 3). For instance, the low dune barrier with a gentle slope experiences
33
shoreface slope wide dune scenario experience lower dune crest migration, ranging from 96 m to
43m seaward migration (for 12 to 24 days) respectively.
Backbarrier
The backbarrier is where overwash is deposited as a result of wave runup onto the dune
crest depositing sediment landward often in the form on a washover fan or where inundation
overwash when the dune crest is submerged may occur. The barriers with a low dune and gentle
slope (GS-LB) exhibit the greatest volume of dune washover (~30.2 m3/m), as expected (Figures
8b, 12b), whereas barriers with wide dune fields for the same slope (GS-WW) show reduced
overwash (~5.4 m3/m) (Figures 8b, 12b). This trend was repeated for steeper slopes (Figure 9b)
where the barrier with a low dune (VS-LB) experiences similarly larger overwash volumes
(~31.6 m3/m) compared to the wide dune (VS-WW) scenario (~3.4 m3/m; Figure 9b).
Backbarrier Lagoon
The backbarrier lagoon experiences the least amount of change as a result of the storm.
Deposition rates in the lagoon varied little with respect to shoreface slope, but exhibited
significant divergence with respect to dune morphology. The deposition for the barrier with a
low dune varied from 3.0 m3/m for the gentle shoreface slope to 2.9 m3/m for the steeper
shoreface slope. Contrastingly, the barriers with wide dunes experienced deposition rates of
34
Discussion
Upper Shoreface
Results show that shoreface slope drives morphodynamic change at the shoreline and
dune of barrier islands during storms. As hypothesized, steeper shoreface slopes produce less
overwash compared to gentle shoreface slope systems during storms, with upper shoreface
erosion being proportional to shoreface slope (Figure 6). The complexity of the experimental
design, as expected, shows that erosion and migration rates can be quite variable for the several
slopes and barrier templates examined (Table 2 and 3) ranging from -11.2m to 37.3m of
shoreline erosion and -43m to 500m of dune crest migration. Regardless of this variability, an
obvious trend emerges where the steeper shoreface produces less shoreline erosion, indicating an
inverse relationship between shoreface slope and shoreline erosion (Table 2). At first, this
response appears counterintuitive, but can be explained by the lack of transfer of material
offshore as the storm peaks; although this response would be common to all simulations, hence a
meaningful comparison can still be made between model simulations. With continued erosion of
the upper shoreface, coupled with lack of wave runup overwash, sediment deposits and helps
maintain or limit erosion at the shoreline and contributes more to dune aggradation.
The storm influence of the upper shoreface and dune crest is directly proportional to
changes in shoreface slope (Figure 6), while in the backbarrier marsh and lagoon, change is
independent of shoreface slope. For example, the change in shoreface slope does in fact generate
a variable response in the backbarrier deposition (leading to dune overwash), but is not
35
A steeper shoreface suggests a larger barrier volume to be eroded to facilitate a change on
the backbarrier and lagoon. Aagaard et al. (2004) suggest that for gently sloping shorefaces,
behavior oriented models predict net onshore sediment translation in the long term and that
process-based models predict net offshore sediment translation in the long run. On the contrary,
MIKE 21 by DHI is a numerical model where we predict a net onshore sediment translation, but
on an inter-annual time scale. Our results with respect to shoreline erosion coincide with Short
(1999) in that an increasing shoreface slope tends to enhance the effect of gravity thereby
reducing the amount of onshore sand transport. This implies that while overwash still may
occur, the rates of overwash and barrier migration are low and independent of shoreface slope.
The amounts of shoreline erosion, overwash and landward migration are also related to the
morphology of the backbarrier and the frequency and magnitude of hurricanes and tropical storm
events.
There is considerable variation in shoreline erosion rates for each barrier profile; however
it becomes evident that the low barriers with low dunes experience significantly greater shoreline
erosion than the wider dune crests (Table 2), regardless of shoreface slope. This response is
expected, as low barriers are subjected to higher runup overwash, facilitating the transfer of
sediment to the back-dune and subsequently, sediment eroded from the shoreline continuously
supplies the dune with sediment during the storm. Inundation overwash at the peak of the storm
enhances this response. In the scenario where the dune system is higher, and wider (WW), the
continued erosion on the upper shoreface, coupled with reduced overwash volumes, supplies the
berm and dune toe with sediment, which reduces (initially) the shoreline erosion. This behavior,
however, is restricted to differences in the initial dune morphology, and appears to be
36
assessing cumulative sediment transport trends across the barrier for the duration of the storm
(discussed in more detail below), showing clearly that the higher shoreline erosion and dune
crest migration for the low barriers are attributed to the dune crest morphology.
Dune
Barrier island change during storms is also coupled to the dune crest morphology
controlling the overwash volume in the backbarrier. Considering dunes are highly dynamic
environments dependent on the shoreface slope and dune morphology, results demonstrate
significant changes occurring on the dune as a result of the storm. Barriers with wide dune fields
contain more subaerial sediment volume compared to barriers with narrow or low dunes and
therefore require larger amounts of washover to occur during an event to facilitate a comparable
translation of the dune and barrier profile. A low or narrow barrier experiences erosion of the
upper shoreface and deposition in the backbarrier in the form of an overwash fan or sheet and as
a result experiences higher rates of landward migration for the same events (Figure 6b). Instead
of deposition in the backbarrier, a wider barrier experiences deposition on top of the dune crest
causing crest accumulation (Figure 7b). Donnelly (2007) demonstrated that a larger crest width
restricts more erosive overwash types (Figure 8). Over time, and after several events, sediment
begins to deposit in the backbarrier leading to a translation of the barrier (Figures 10, 11). Thus,
a wider barrier is more resistant to net sediment loss than a narrow barrier during the same
high-magnitude event.
Although there appears to be no immediate pattern for the cumulative sediment transport
volumes occurring at the dune, we do, in fact, note that the values are much higher for the
twenty-four day periods (83.7m³/m to 103.7m³/m) than the twelve day periods (43.0m³/m to
37
values for the twenty-four day simulations are much higher than the twelve day simulations. For
instance, volume at the dune for the twenty-four day storm for a low barrier with a gentle
shoreface is 42.7m³/m whereas volume for the twelve day storm for the same template is
30.2m³/m. This implies that while there is a high degree of variability in response, a longer
duration of storm conditions undoubtedly results in higher volumes of dune overwash and
backbarrier translation. These variability in results at the dune crest are due, as Short, 1999
describes, to the greatest profile change occurring in amplitude and frequency at the upper
shoreface having a morphological control on the response of the dune.
Backbarrier
The cumulative sediment transport occurring in the backbarrier is directly proportional to
the initial morphology of the dune crest and the change, as a result of the storm, is reflective in
the washover volume deposited in the backbarrier. Because the dune is both lower in height and
narrower in width, the low barriers experience the greatest amount of overwash (29.1m³/m to
31.7m³/m of cumulative sediment transport) whereas wider dune crests experience progressively
reduced amounts of overwash (3.3m³/m to 5.4m³/m for the wide width dune crest) (Table 3).
This process is the result of higher dune crest migration rates for the low barriers (Tables 2 and
3). The higher dune crest migration rates are a response to higher shoreline erosion rates and
landward transfer of sediment from the shoreface onto the dune crest after which it becomes
overwashed. Wider dune fields experience lower shoreline erosion rates and lower dune crest
migration rates as a result of shoreface sediment deposited on top of the dune crest leading to
aggradation instead of rollover or overwash. As a result, we observe an inverse relationship
between dune crest width and cumulative sediment transport volumes in the backbarrier leading
38
Backbarrier Lagoon
The cumulative sediment transport volumes in the lagoon, reflective in the landward
translation of the backbarrier, display a similar inverse relationship with dune crest width. Once
again, the low barriers experience the greatest amounts of lagoon deposition (2.8m³/m to
3.1m³/m) (Table 3). Wider crests undergo a similar lagoon transformation to the narrow crest
and low barrier but at much slower rates (0.2m³/m to 0.3m³/m) (Figures 8, 9; Table 3). Because
a higher, wider dune reduces lagoon deposition whereas a low dune narrow barrier maximizes it,
lagoon deposition is perhaps again directly proportional to the overwash volume, which is
directly proportional to the dune crest width.
Profile Evolution
The profile evolutions over time serve as a useful tool to assess barrier dynamics, as they
allow for close examination and observation of exactly when, where and how the barrier profile
responds to the storm. Profile evolutions, as a result of the twelve day storm, show the majority
of change occurring within the first 130 hours (a little over 5 days) coinciding with the peak of
the storm, whereas little change is evident in the remaining period. For barriers with a low dune
and gentle shoreface slope, the storm initially generates a destructive phase causing dune
lowering and landward rollover within the first twenty four hours (Figure 15). By the second
day (48 hours), the dune begins to experience a loss in elevation or dune lowering as sediment
begins to move into the backshore. By hour seventy-two (Figure 15), the dune experiences a
total loss in elevation and the shoreline and upper shoreface experience a temporary seaward
movement, driven likely by combined runup overwash and inundation overwash, and is
characteristic of dune destruction as identified by Donnelly (2007). Up to this point in the storm,
39
constructive phase of the barrier begins. The sediment from the upper shoreface is eroded
generating landward transport initiating construction of a new dune development as a result of
barrier rollover. Deposition on the dune begins to occur leading to dune crest aggradation and
overwash processes. At this time, the majority of deposition into the lagoon occurs causing
landward translation of the barrier. Continued dune aggradation and landward translation occurs
until about 130 hours at which point very little changes occur for the remainder of the simulation
period (Figure 15).
Figure 13: Profile evolution for a low barrier with a gentle shoreface slope. Red lines indicate Initial
40
Profile evolution of a barrier with low dunes with a very steep shoreface slope
demonstrates a similar response at which a destructive phase initiates dune lowering and
eventually dune destruction. Second, the storm produces shoreline pertubations resulting in a
constructive phase where deposition of sediment from the shoreline initiates a new dune
development landward of the old dune while continually depositing sediment landward into the
backbarrier and lagoon resulting in migration of the barrier (Figure 16). In this case however,
the steeper shoreface slope prevents greater amounts of shoreline erosion, but the morphology of
the low barrier still allows for considerable dune overwash to occur resulting in barrier migration
41
Figure 14: Profile evolution for a low barrier with a very steep shoreface slope. Red lines indicate Initial
and Final profiles. Black line indicates profile at specified time. Color shows change at specific hours.
The profile evolution of the wider dune crest with a gentle slope demonstrates the resistance of a
wider barrier to a storm through a different response. Initially, runup of waves onto the dune
crest causes small amounts of dune scouring leading to a deposition of sediment on top of the
dune. Between hours 48 and 72 however, very little change occurs on the shoreface, dune,
backbarrier or lagoon (Figure 17). At 110 hours, fluctuation of the shoreline initiates a
42
and dune landward translation leading to barrier rollover (Figure 17). Overall, little to no change
occurs in the backbarrier and lagoon as a result of reduced washover volume resulting in lower
rates of barrier migration, suggesting an inverse relationship between dune crest width and
backbarrier and lagoon deposition.
Figure 15: Profile evolution for a wide dune crest with a gentle shoreface slope. Red lines indicate Initial
43
Summary and Conclusions
With a goal to accurately represent deltaic barriers in Louisiana and coastal plain barriers
in the rest of the northern Gulf of Mexico, a schematized barrier island system was utilized
including all sub-environments (e.g., shoreface – various slopes - dunes - various crest widths),
informed from field data (e.g., Miner et al., 2009) and literature (e.g., Short, 1999). The
simulation matrix ranged from environments that included gentle to very steep slopes
representative of deltaic system, and dune morphology that ranged from low and narrow dune
fields to high and wide, informed by robust barriers in Louisiana or those produced by barrier
island restoration projects. Furthermore, additional templates representing additional restoration
templates were incorporated and tested (e.g. Campbell 2005). Using observed water levels, wind
and wave data from an actual storm along the Louisiana coast, MIKE 21 by DHI was used to
gain a better understanding on the dynamic response of barrier islands during storms.
The hypothesis, that barrier systems with gentle shoreface slopes and low and narrow
dune crests are less resistant to storms, and hence experience greater amounts of upper shoreface
erosion and dune transgression compared to their steeper slopes and wider dune counterparts, is
accepted. The hydrodynamic, spectral wave and sand transport modules offered by MIKE 21
have provided exceptional data for comparing the response of various barrier templates to
low-frequency high-magnitude events such as tropical and extratropical storms. Generally, dune
aggradation in wider dune systems is a constructive process that while initially limits overwash,
eventually promotes overwash in a high dune setting, whereas in low dune systems, this function
is lost due to shoreline erosion and significant landward translation. Results show that the angle
or morphology of the shoreface slope proportionately determines the amount of shoreline
44
dune crest morphology (height and width) exerts a first order control on the washover volumes
during storms, and thus determines the amount of dune overwash, backbarrier deposition and
lagoon deposition leading to backbarrier migration; as the dune crest width increases, dune
washover, backbarrier deposition and lagoon deposition decrease.
Implications for barrier island restoration
Our results corroborate results from previous studies (Campbell, 2005; Donnelly, 2007;
Donnelly et al., 2006; and Lorenzo-Trueba and Ashton, 2014), that barriers with steeper
shoreface slopes and wider dune crests are more resistant to overwash processes and hence
backbarrier landward migration, and therefore serve as exemplary nourishing templates for
barrier island restoration projects. Having a more detailed understanding of the dynamics of
barrier systems will provide more appropriate methods for restoring or nourishing barrier islands.
Our study shows that numerical models can be effectively used to assess and test restoration
templates further for the specific setting, taking into account other environmental factors at play
including physical forcing, geomorphology etc. This becomes extremely important when
planning coastal restoration projects here in Louisiana as managing our coast during the ongoing
45
References
Aagaard, T., Davidson-Arnott, R., Greenwood, B. and Nielsen, J. (2004) "Sediment supply from shoreface to dunes: linking sediment transport measurements and long-term morphological evolution". Geomorphology 60.1: 205-224.
Ashton, A., and Murray, B. (2006) "High‐angle wave instability and emergent shoreline shapes: 1. Modeling of sand waves, flying spits, and capes." Journal of Geophysical Research: Earth Surface 111.F4.
Cowell, P., Stive, M., Niederoda. A., Swift, D., de Vriend, H., Buijsman, M., Nicholls, R., Roy, P., Kaminsky, G., Cleveringa, J., Reed, C. and de Boer, P. (2003) "The coastal-tract (part 2): Applications of aggregated modeling of lower-order coastal change." Journal of Coastal Research: 828-848.
Cooper, J. Andrew G., and Orrin H. Pilkey. (2004) "Sea-level rise and shoreline retreat: time to abandon the Bruun Rule." Global and planetary change 43.3 : 157-171.
Cowell, P., Thom, B., Jones, R., Everts, C. and Simanovic, D. (2006) "Management of
uncertainty in predicting climate-change impacts on beaches." Journal of Coastal Research: 232-245.
Dingler, John R., S. A. Hsu, and Thomas E. Reiss. (1992) "Theoretical and measured aeolian sand transport on a barrier island, Louisiana, USA". Sedimentology 39.6: 1031-1043.
Donnelly, C., Kraus, N. and Larson, M. (2006) "State of knowledge on measurement and modeling of coastal overwash." Journal of Coastal Research: 965-991.
Donnelly, C. (2007) "Morphologic change by overwash: establishing and evaluating predictors." Journal of Coastal Research SI 50 (special issue): 520-526.
Dupont, S., G. Bergametti, and Serge Simoëns. (2014) "Modeling aeolian erosion in presence of vegetation." Journal of Geophysical Research: Earth Surface119.2: 168-187.
Eke, E., Parker, G. and Shimizu, Y. (2014) "Numerical modeling of erosional and depositional bank processes in migrating river bends with self‐formed width: Morphodynamics of bar push and bank pull." Journal of Geophysical Research: Earth Surface 119.7: 1455-1483.
Fearnley, Sarah. (2008) "The soil physical and chemical properties of restored and natural back-barrier salt marsh on Isles Dernieres, Louisiana." Journal of Coastal Research: 84-94.
FitzGerald, D., Kulp, M., Hughes, Z., Georgiou, I., Miner, M., Penland, S. and Howes, N. (2007) "Impacts of rising sea level to backbarrier wetlands, tidal inlets, and barrier islands: Barataria Coast, Louisiana." Proc Coastal Sediments. Vol. 7.
46
Georgiou, Ioannis Y., and Jennifer K. Schindler. (2009) "Wave forecasting and longshore sediment transport gradients along a transgressive barrier island: Chandeleur Islands, Louisiana." Geo-Marine Letters 29.6: 467-476
Hartman, Michael, and Andrew B. Kennedy. (2016) "Depth of closure over large regions using airborne bathymetric lidar." Marine Geology 379: 52-63.
Hinton, Claire, and Robert J. Nicholls. (1998) "Spatial and temportal behavior of depth of closure along the Holland coast." Coastal Engineering Proceedings1.26.
Inman, Douglas L., and C. E. Nordstrom. (1971) "On the tectonic and morphologic classification of coasts." The Journal of geology: 1-21.
Jaffe, B. E., J. H. List, and A. H. Sallenger. (1997) "Massive sediment bypassing on the lower shoreface offshore of a wide tidal inlet—Cat Island Pass, Louisiana." Marine Geology 136.3: 131-149.
Jones, O. P., O. S. Petersen, and H. Kofoed-Hansen. (2007) "Modelling of complex coastal environments: Some considerations for best practise." Coastal Engineering 54.10: 717-733.
Judge, Elizabeth K., Margery F. Overton, and John S. Fisher. (2003) "Vulnerability indicators for coastal dunes." Journal of Waterway, Port, Coastal, and Ocean Engineering 129.6: 270-278.
List, J., Sallenger, A., Hansen, M. and Jaffe, B. (1997) "Accelerated relative sea-level rise and rapid coastal erosion:: testing a causal relationship for the Louisiana barrier islands." Marine geology 140.3: 347-365.
Lithgow, Debora, M. Luisa Martínez, and Juan B. Gallego-Fernández. (2015) "The “ReDune” index (Restoration of coastal Dunes Index) to assess the need and viability of coastal dune restoration." Ecological Indicators 49: 178-187.
Liu, James T., and Gary A. Zarillo. (1989) "Distribution of grain sizes across a transgressive shoreface." Marine Geology 87.2: 121-136.
Lorenzo-Trueba, Jorge, and Andrew D. Ashton. (2014) "Rollover, drowning, and discontinuous retreat: Distinct modes of barrier response to sea‐level rise arising from a simple morphodynamic model." Journal of Geophysical Research: Earth Surface 119.4: 779-801.
Matias, A., Vila-Concejo, A., Ferreira, O., Morris, B. and Dias, J. (2009) "Sediment dynamics of barriers with frequent overwash" Journal of Coastal Research: 768-780.
Miner, M., Kulp, M., FitzGerald, D. and Georgiou, I. (2009) "Hurricane-associated ebb-tidal delta sediment dynamics." Geology 37.9: 851-854.