1 Self-powered pressure sensor based on the triboelectric effect and its analysis using
dynamic mechanical analysis
Cristobal Garcia a *, Irina Trendafilova a, Roberto Guzmán de Villoria b, and Jose Sanchez del Rio c
a University of Strathclyde, Mechanical and Aerospace Department, 75 Montrose Street, G1 1XJ, Glasgow, UK
b FIDAMC: Foundation for the Research, Development and Application of Composite Materials, Avda. Rita Levi Montalcini 29, 28906, Getafe, Madrid, Spain
c IMDEA Materials Institute, C/ Eric Kandel 2, 28906, Getafe, Madrid, Spain
Email: [email protected]
Abstract: Since 2012 there has been a rapid rise in the development of triboelectric nanogenerators due to their potential applications in the field of energy harvesting and self-powered sensors for vibrations, accelerations, touches, pressures and other mechanical motions. This study suggests a novel triboelectric nanogenerator based on
the interaction between polyvinylidene fluoride and polyvinylpyrrolidone submicron fibers.
Polyvinylpyrrolidone is introduced as a new material for the TENG because of its tendency of losing electrons easily, while polyvinylidene fluoride is selected for its strong-electron attracting ability. Electrospinning is suggested as a fabrication method for the nanofibers due to its simplicity, versatility and low-cost. Furthermore, the paper explores the possibility to use this triboelectric nanogenerator as a self-powered pressure sensor. For this purpose, the nanogenerator is subjected to dynamic mechanic analysis which produces controlled pressure forces applied with a certain frequency. This is the first work to suggest the use of dynamic mechanical analyzer to study the relation between the applied mechanical stimulus and the electric responses of the triboelectric nanogenerator. Eventually the sensitivity of the nanogenerator to different pressures is analysed. A directly proportional relationship is found between the pressure applied and the resultant voltage and current amplitudes. The developed nanogenerator reacts to pressure in real time and as a sensor it exhibits a very high sensitivity and low experimental error for repeated measurements. The main contributions of this study are the development of a novel nanogenerator based on the triboelectric effect between polyvinylidene fluoride and polyvinylpyrrolidone electrospun fibers and the investigation for its potential use as a self-power pressure sensor. Eventually, the paper explores the advantages of dynamic mechanical analyzer for pressure analysis.
2
1. Introduction
Pressure sensors are required in thousands of everyday applications as touchscreens, touchpads, microphones and medical devices. According to their mechanism to convert the mechanical energy into electricity can be generally divided into the following categories: piezoelectric [1-2], capacitive [3], optical [4] and resistive sensors [5]. Among these approaches, the sensors based on the piezoelectric effect have attracted the most attention because they are self-powered and do not need a battery or an external power supply to power the sensor. Therefore, they can be used as sustainable sensors able to work independently without any external power supply which results in important cost-savings. However, the fabrication of piezoelectric sensors is rather complicated and requires time-consuming and cost processing steps as annealing (a heat treatment to increase the crystallinity of the sensing material) and electrical poling (the application of a high electrostatic field at elevated temperature to align the dipoles). Hence, it is highly desired to find alternative ways to fabricate self-powered pressure sensors using a low-cost technology.
In the last years, triboelectric nanogenerators (TENGs) has been widely reported for their potential applications in the field of energy harvesting [6-10] and self-powered active sensors for touches [11], vibrations [12], accelerations [13], velocities [14], wind speeds [15] and environmental changes [16-17]. More importantly, TENGs can also be utilized as self-powered pressure sensors with the advantages of easy fabrication and low-cost processing technology. For example, the authors from [18] reported a TENG which can detect pressures in the range from 0 to 10 KPa with exceptional pressure sensitivity. Other works as [19] reported TENGs which can detect pressures at high pressure regimes (>10 kPa). Currently, most of the reported TENGs have been tested using a mechanical lineal motor [20], shaker [21], or vibration platform [22] which provides limited information about the characteristics of the mechanical stimulus. In this regard, we believe that it is necessary to investigate alternative techniques to analyze the characteristics of the mechanical stimulus which can be used to have a better understanding of the nature of the electric responses and its relation with the mechanical input.
3
analyze the behavior of a TENG as pressure sensor. This is beneficial as it can be used to understand more precisely the nature of the TENG electric responses. The experimental results indicated that the developed pressure sensor has a very high sensitivity and reproducibility. Actually, very few publications have reported the pressure sensitivity of TENGs [18-19] and it can be concluded that the developed sensor is more sensitive than most reported triboelectric sensors in the 0-2000 Pa detection range.
Previous publications have reported that the ability of the materials to lose or gain electrons during the triboelectrification plays an essential role in the performance of TENGs [23-25]. Logically, the further away the materials are separated in the triboelectric series (Fig. S1), more electrons are exchanged which results in an increase of the triboelectric effect and higher electric outputs. In the design of the triboelectric nanogenerator, PVDF and PVP fibers are selected because both materials are further away from each other in the triboelectric series, which is expected to enhance the performance of the TENG. To date PVDF fibers have been widely utilized to build TENGs [26-30] due to their strong tendency to attract electrons. This is due to the large composition of fluorine in PVDF that has the highest electronegativity among all the elements and the large active surface of the nanofibers. In this paper, we suggest PVP fibers as the other triboelectric mat to design the TENG due to their strong ability to lose electrons and large contact surface. To the best of our knowledge, only a few works [27, 31] have explored the potential of PVP fibers as positive triboelectric material.
It is also well known that the performance of the TENG is largely dependent on the contact area between the frictional materials [32]. Therefore, there has been much effort to prepare triboelectric mats with large contact active surface. For example, [33-34] used patterned films and nanoparticles in the TENGs to increase contact area between the frictional mats. In this study, we utilized nanofibers to design the TENG due to their higher specific area and very high roughness, which is expected to increase the generation of triboelectric charges. For this purpose, a simple method is suggested to fabricate fibers using the technique of electrospinning. This process has the advantages of cost effective mass production, scalability and simplicity of the design and fabrication from a wide variety of triboelectric nanofibers as per example nylon [35], polystyrene [36] or poly(methyl methacrylate) [37] to mention just a few. Furthermore, the very rough surface of the fibers fabricated via electrospinning can be used to improve the performance of the triboelectric nanogenerators. Although some authors have reported triboelectric nanogenerators fabricated via electrospinning [38-39], it is important to highlight the advantages of this fabrication method and the simplicity of this process for preparation of triboelectric nanogenerators at large scale using a low-cost production technology.
4
2. Preparation of the PVDF and PVP fibers
This section explains the procedure used to prepare the fibers used in the triboelectric
nanogenerator. The submicron fibers were produced using the technique of electrospinning due to
its low cost, scalability, and simplicity for the fabrication of a wide variety of triboelectric mats. Furthermore, the large surface area and rough surface of the fibers produced via electrospinning can generate higher density of triboelectric charges through the triboelectric effect, resulting in larger electric outputs [27]. Thus, an increment of the thickness of the electrospun membranes (e.g. by using a large collection time in the electrospinning process), it is expected to increase the TENG
electric responses up to a certain point. Fig. S2 illustrates a schematic description of the
electrospinning process used to prepare the nanofibers for the TENG.
For preparing the PVDF fibers, polyvinylidene fluoride pellets with a molecular weight of
275,000 g mol-1, N, N- dimethylformamide (DMF) and acetone solvents were used as received.
Initially, a chemical solution was prepared by dissolving 2g PVDF pellets in 10 ml solvent mixture of N, N- dimethylformamide and acetone (4/6). After, the chemical solution was heated on a hot plate at 70 °C while being actively stirred to speed up the dissolution process. Finally, the homogeneous solution was inserted into a plastic syringe to be spun using the following operation conditions: A high voltage of 15 kV, a spinning distance of 15 cm and a feed rate of 1 ml/h. During the electrospinning, the equipment used (Nanon-01A) is equipped with a 21 G steel needle (inner
diameter = 0.8 mm) and a static collector. As a result, membranes of PVDF submicron fibers with
a thickness of approximately 2 mm are obtained.
Regarding the preparation of PVP fibers, PVP (MW= 360,000 g mol-1, Sigma Aldrich)
powder was used as polymer and ethanol was used as solvent. Firstly, a chemical solution was prepared by dissolving the PVP powder in a solution of ethanol at a concentration of 10% w/v. Secondly, the chemical solution is transferred to a 5 ml plastic syringe to be spun using the following conditions: applied voltage 18 kV, feed rate 0.5 ml/h, spinning distance 12 cm, 21 gauge needle and static collector. Finally, membranes of PVP submicron fibers with a thickness of around 1 mm are prepared.
3. Characterization of PVDF and PVP fibers
The aim of this section is to analyze the morphology of the fibers used in the triboelectric nanogenerator. As stated above, the performance of a TENG is affected by the contact area between the frictional materials. Additionally, the internal spaces of the triboelectric layers (e.g. porosity) also affect positively the output performance of the TENG [40]. Therefore, there has been much effort to prepare triboelectric mats with large active surface area and porosity. One of the methods to prepare mats with high active surface area and porosity is to use ultra-thin fibers in the TENG.
The morphology of the fibers was characterized based on scanning electron microscope
5 software J 1.45s. Then, the fiber diameter distribution is calculated by counting the number of fibers who possess diameters in the range selected. The analysis of the morphology for the fibers used in the TENG is presented in Fig. 1.
Fig. 1: Analysis of the morphology for the fibers used in the triboelectric nanogenerator: (a) SEM image of electrospun PVDF fibers, (b) fiber diameter distribution of PVDF fibers, (c) SEM image of electrospun PVP fibers and (d) fiber diameter distribution of PVP fibers. The SEM images were obtained using EVO MA15 scanning electron microscope at an accelerating voltage of 5 kV and probe intensity of 291 pA.
The SEM image of the PVDF submicron fibers is given in Fig. 1a and the fiber diameter distribution is presented in Fig. 1b. The SEM image shows good quality submicron fibers with different sizes distributed randomly in the membrane. The submicron fibers are separated from each other and have a smooth surface with a few bead defects. The fiber diameter histogram shows a normal distribution which is skewed to the right thus indicating that the diameter of the spun fibers is not uniform. The histogram shows that the fibers diameter is somewhere between 800 and 1000 nm with a probability of about 28 %. The average diameter of the PVDF nanofibers was 1100 nm with a standard deviation of 370 nm.
10 µm
(c) (d)
200 400 600 800 1000 1200 1400 1600 1800 2000 2200 0
10 20 30
Relative
fr
eq
ue
ncy (
%)
Fiber Diameter (nm)
200 400 600 800 1000 1200 1400 1600 1800 2000 2200 0
10 20 30
Relative
F
re
qu
en
cy (%)
Fiber Diameter (nm)
(a) (b)
[image:5.612.90.526.160.510.2]6
The SEM image of PVP fibers is given in Fig. 1c and the histogram of fiber diameter distribution is displayed in Fig. 1d. The fibers obtained are distributed in random directions without beads and other defects as indicated in SEM image. The histogram shows a normal distribution with fiber diameters between 200 and 2200 nm. The fiber diameter distribution is skewed to the left indicating that the fibers diameter is between 1400 and 1600 nm with a probability of about 17%. The average fiber diameter was 1400 ± 470 nm, indicating that PVP fibers are thicker than PVDF fibers. The wide distribution of diameters in both membranes of spun fibers (200 to 2200 nm) is explained by the Taylor cone formed during the electrospinning. As illustrated in Fig. S2, the polymer jet is only stable close to the tip of needle and after that, it becomes unstable changing in periodic directions.
4. Analysis of the crystalline phase in PVDF
PVDF is ascribed to the piezoelectric effect when there is betha crystalline phase and the ferroelectric domains of β-phase are well aligned [41]. However, PVDF is also attributed to the triboelectric effect due to their strong-electron attracting ability [26-30]. This behavior is attributed to the high percentage of fluorine in PVDF that has the highest electronegativity among all the elements which results in a strong tendency to gain negative charges when in contact with almost any other material and the large active surface area of the fibers. In this section, we investigate if the nature of the electrical signal detected from PVDF nanofibers is due to the piezoelectric effect, the triboelectric effect or a combination of both.
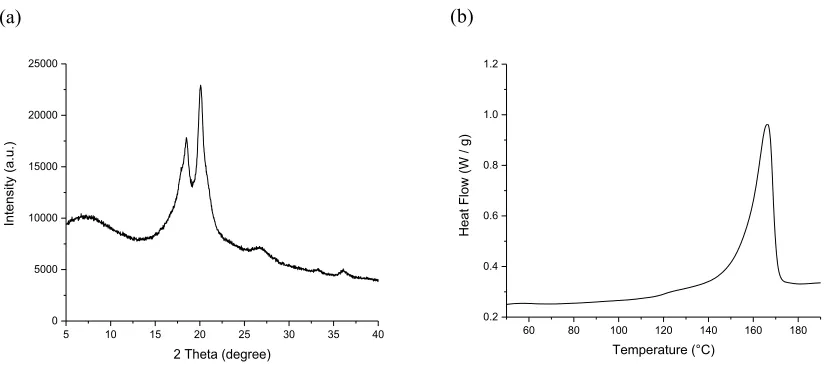
It is well known that the PVDF piezoelectric properties depend on the crystalline phase. The α crystalline phase is non-polar due to the antiparallel packing of the dipoles and in this phase PVDF exhibits no piezoelectric properties. However, the β crystalline phase is polar and in this phase PVDF can exhibit a strong piezoelectric behavior when the ferroelectric domains of the β-phase are well aligned (e.g. by the application of high electric field at elevated temperature). To find out if the electric response of the PVDF nanofibers is due to the piezoelectric effect X-ray diffraction (XRD) and differential scanning calorimetry (DSC) were carried out to identify the crystalline phase of the polyvinyl fluoride fibers. The results for the analysis of the crystalline phase are shown in Fig. 2.
Fig. 2a shows the XRD spectra of the PVDF fibers. The intense peaks at 2θ = 18.53°and 20.08° correspond to the (0 2 0) and (0 1 0) planes of the alpha crystalline phase. Furthermore, the spectra shows other two small peaks around 27° and 36° associated with (0 2 1) and (2 0 0) planes of the phase α. As reported in [42], the diffraction peaks for α and γ phase are almost coincident
7
phase of PVDF is the non-piezoelectric alpha phase. Thus, the influence of piezoelectricity on the electric output of the PVDF fibers is negligible and the electric signal detected from the PVDF fibers is only due to the triboelectric effect.
5 10 15 20 25 30 35 40
0 5000 10000 15000 20000 25000
Int
en
sity (a
.u.
)
[image:7.612.80.498.134.317.2]2 Theta (degree)
Fig. 2: Identification of the crystalline phase in PVDF fibers: (a) XRD pattern obtained on a PANalytical X-ray diffractometer with Cu radiation of 1.54 A° in reflection mode using samples scanned in the 2θ range of 5° to 40° with a step size of 0.05°. (b) DSC curve obtained using Q200 differential scanning calorimeter from TA instruments using samples heated in a temperature range from 30 to 200 °C at the heating rate of 10 °C/min.
5. Fabrication of the TENG
This section describes the process used to fabricate the triboelectric nanogenerator using the technique of electrospinning [43]. This method was chosen because of its simplicity, versatility and low-cost. Furthermore, the rougher surface of the fibers produced via electrospinning increases the effective contact area improving the output performance of the triboelectric nanogenerator [38].
The assembly process of the triboelectric nanogenerator is depicted in Fig. 3. Firstly, membranes of polyvinyl fluoride and polyvinyl pyrrolidone were electrospun on copper films as shown in Fig. 3a. The role of the copper films is to collect the submicron fibers during the electrospinning and act as electrodes for the triboelectric nanogenerator. PVDF and PVP fibers served as the sensor frictional mats due to strong tendency to gain and lose electrons. Secondly, the membranes of interconnected PVDF and PVP fibers are face to each other to assemble the triboelectric nanogenerator (Fig. 3b). Finally, the nanogenerator is sealed with polyethylene terephthalate film which acts as protection layer for the nanofibers and avoids changes in the electric responses due to humidity variations. This is also important to prevent the deliquescence of PVP nanofibers. Fig. 3c displays a digital photograph of the nanogenerator with the small size of 40 x 40 x 3.5 mm and a low weight of 4.93 g. Fig. 3b illustrates the structural design of the
(a) (b)
60 80 100 120 140 160 180 0.2
0.4 0.6 0.8 1.0 1.2
Heat
F
low (W /
g)
8
[image:8.612.85.492.202.350.2]triboelectric nanogenerator. The nanogenerator consist of two sections: (i) PVDF electrospun fibers deposited on copper electrode form the top section and (ii) PVP submicron fibers adhered on copper electrode form the bottom section. As it can be appreciated, the polyvinylidene fluoride fibers are located at the top side of the nanogenerator, while the PVP fibers are placed at the bottom side. These materials are chosen for their high tendency to gain and lose triboelectric charges respectively, as detailed in Fig. S1.
Fig. 3: Schematic illustration of the fabrication process for the triboelectric nanogenerator: (a) Preparation of the PVDF and PVP fibers via electrospinning. (b) Structure of the fully assembled triboelectric nanogenerator (c) Digital photographic of the as-fabricated TENG.
6. Application of the TENG as self-powered pressure sensor
The aim of this section is to investigate the potential of the novel TENG as self-powered pressure sensor and assess their sensitivity to different pressure levels. The purpose of the experiments performed is to verify that the electric response of the nanogenerator is dependent on the pressure applied.
As stated above, the use of the Dynamic mechanical analyzer (DMA; Q800; TA Instruments) is suggested to supply periodically applied pressures to the nanogenerator. The main benefit of using this instrument is that the mechanical stimulus applied on the nanogenerator can be monitored and record in real time. Furthermore, although this characteristic was not used in this study, this technique can also evaluate the performance of TENGs under different environmental conditions as temperature and humidity which is not possible based on conventional techniques. This can be potentially used to have a deeper understanding of the nature of the TENG electric responses. To measure the electric responses of the TENG due to the mechanical stimulus applied via DMA, the voltage and current output signals are obtained using a Tektronix 2012B commercial oscilloscope and Agilent 34410A digit multimeter.
(c) (b)
(a) Electrospinning Nanogenerator Assembly
Copper electrode PVDF fibers PVP fibers
1 cm
9
Fig. 4: A schematic diagram of the experimental set-up to measure the electric output of the nanogenerator to pressures applied through dynamic mechanical analyzer (DMA).
A schematic description of the experimental set-up is shown in Fig. 4. The pressures are applied on the top side of the TENG in a direction perpendicular to the device as shown in the figure. The pressures are generated by a constant force perpendicular to the nanogenerator
mounted in DMA equipment and applied on a circular area of 50.24 cm2. During the test, the
pressure applied was varied in the range from 200 to 2000 Pa with increments of 200 Pa. Each pressure application was repeated five times to assess the reproducibility of the electric responses for repeated applications of the same pressure. The electric outputs are shown in the results section where the effect of the pressure applied on the electric response of the nanogenerator is analyzed. From this test, the voltage and current generated by the various pressures are investigated.
7. Results and discussion
This section presents all the results obtained from the experiment described in Section 6. Initially, the working principle of the triboelectric nanogenerator is presented. Eventually, the results from the dynamic mechanical analyzer are shown and discussed
7.1. Working principle of the TENG
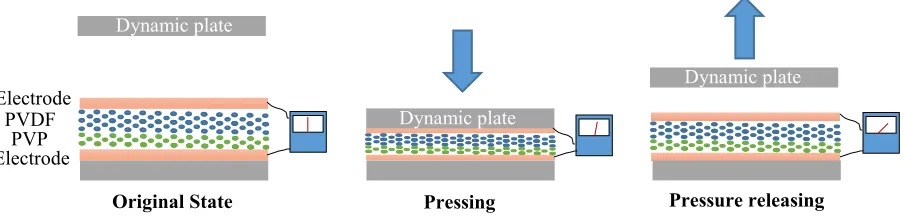
The electricity generation process of the triboelectric nanogenerator is schematically described in Fig. 5. The working mechanism is based on the coupling effect between the triboelectrification and electrostic induction. It is worth to note that the operating principle of the TENG is self-powered. But as in most practical occasions the oscilloscope and multimeter used to measure the sensor electric signals require an external power supply.
In the original state, there is no generation of triboelectric charges and no electric potential difference between the two electrodes as indicated in Fig. 5a. When a pressure is applied to the top of the nanogenerator, the PVDF and PVP submicron fibers are brought into contact with each other, which results in the generation of triboelectric charges with opposite signs as illustrated in Fig. 5b. Due to the strong electron-attracting ability of PVDF, electrons are injected from the PVP into the PVDF fibers, leaving negative charges on the PVDF fibers and positive charges on PVP fibers. As the pressure is released, the contacting surfaces will revert to their original positions
Original State Pressing Pressure releasing
Dynamic plate
Dynamic plate
Dynamic plate
Electrode PVDF
10
which results in the separation of the positive and the negative charges. At this stage, the PVP and the PVDF fibers are oppositely charged and the subsequent separation of charges induces a dipolar moment and strong electrical potential difference between the electrodes which causes electrons flow through external loads from the bottom electrode to the top electrode producing an electrical signal as indicated in Fig. 5c. Finally, the generation of triboelectric charges stops and the electrons flow back producing an opposite sign electrical signal. Thus, the triboelectric nanogenerator reverts to its original state. Fig. 5d shows the variation of current as a function of the time due to one contact-separation caused by a finger pressure.
Fig. 5: Simplified description of the generation of electricity [44-45]: (a) the original position of the nanogenerator. (b) Under a pressure, the fibers of PVDF and PVP are brought into contact which results in the generation of charges with opposite signs. (c) Once the pressure is withdrawn, the charges of PVDF and PVP are separated which results in a strong potential difference which drives the electrons from the bottom to the top electrode. (d) The variation of
current in the time domain due to one contact-separation caused by one finger tap.
7.2. Effect of the pressure on the TENG electrical response (a) Original State
0.0 0.2 0.4 0.6 0.8 -0.05
0.00 0.05 0.10 0.15 0.20 0.25
Curr
en
t (
)
Time (s)
(d)
Pressure off Pressure
on
+ + + + + + + + + +
Pressing (b)
- - -
(c) Releasing
I
+ + + +
+ + + + + + + + - - - - - - - -
- - - -
- -
[image:10.612.151.472.222.485.2]11
As mentioned in Section 6, dynamic mechanical analysis was conducted in order to evaluate the ability of the developed triboelectric nanogenerator to measure pressures. The idea is to evaluate the sensitivity of the resultant electricity signals to changes of the applied pressure with the aim to investigate the effect of the pressure on the electric output of the TENG.
Fig. 6a shows the time history of the pressures applied to the nanogenerator in the range from 200 Pa to 2000 Pa. The pressure varied with an increment of 200 Pa and each pressure was applied for five cycles. Fig. 6b shows the corresponding electric response of the TENG measured in terms of current. The results indicate that the current output increased from 0.4569 ± 0.0003 µA to 1.3939 ± 0.0016 µA as the pressure increased from 200 Pa to 2000 Pa. Fig. 6c shows the electric responses of the TENG measured in terms of voltage. It can be seen that the voltage output goes up from 5.36 ± 0.09 to 13.24 ± 0.09 V when the pressure changes between 200 Pa and 2000 Pa. It can be concluded from these results, that the performance of the TENG is strongly affected by the magnitude of the pressure applied, producing a higher voltage and current output when the nanogenerator is subjected to a higher pressure. The device exhibited a peak-to-peak voltage and maximum current output of 13.24 V and 1.3939 µA, respectively under a mechanical compression of 2 kPa. The increase of the electric output with the increase of the pressure is related to the increment of effective contact between the frictional materials under a stronger pressure. At a small pressure, the rough surfaces of electrospun fibers prevent full contact between the fibers of PVDF and PVP. Thus, small areas of PVDF fibers are in contact with PVP fibers which results in a very few amounts of triboelectric charges generated and minimum electric outputs. When a stronger pressure is applied, the deformation of the device increases producing larger contact area between the PVDF and PVP fibers and consequently, more charges are generated what results in higher voltage and current outputs.
Fig. 6d shows the maximum values of the current output as a function of the pressures. The results given are the average maximum current output and the corresponding standard deviations for the five cycles performed for each pressure. From Fig. 6d it can be appreciated that the relationship between the pressure and the maximum current can be interpolated with two straight lines one in the region from 200 to 800 Pa and another one between 800 and 2000 Pa. It is noticed that the bi-linear approximation between electric output and the pressing forces exhibits excellent linearity (R2 ≃ 0.99) for the two regions. The pressure sensitivity is 0.94 nA/Pa for the
low-amplitude pressure region from 200 to 800 Pa and it decreases to 0.37 nA/Pa for the pressure amplitude above 800 Pa.
Fig. 6e shows the average voltage amplitude and the corresponding standard deviations for five repetitions as a function of the pressures. The results display that the output voltage increases at higher pressure and finally saturates at 13.2 V, when the pressure is 1600 Pa. This can be explained by the fact that higher pressure results in more contact area and hence increase the amount of triboelectric charges of the TENG. As a result, higher output voltage is obtained until the triboelectric nanogenerator saturates at 1600 Pa and 13.2 V. It can be observed that the relationship between the pressure and the average voltage exhibits three distinct regions. When
(a)
0.0 0.5 1.0 1.5 2.0 2.5 3.0
0 200 400 600 800 1000 1200 1400 1600 1800 2000
Pressu
re
(Pa)
12
0.0 0.5 1.0 1.5 2.0 2.5 3.0
-0.4 -0.2 0.0 0.2 0.4 0.6 0.8 1.0 1.2 1.4 1.6 Curr en t ( A) Time (min)
0.0 0.5 1.0 1.5 2.0 2.5 3.0
-9 -8 -7 -6 -5 -4 -3 -2 -1 0 1 2 3 4 5 6 7 Voltag e ( V) Time (min)
0 200 400 600 800 1000 1200 1400 1600 1800 2000 2200 0.2 0.4 0.6 0.8 1.0 1.2 1.4 1.6 Curr en t ( A) Pressure (Pa)
0 200 400 600 800 1000 1200 1400 1600 1800 2000 2200 4 6 8 10 12 14 Voltag e ( V) Pressure (Pa)
Fig. 6: Influence of pressures on the triboelectric nanogenerator. (a) Pressures applied through DMA equipment. (b) Current output measured using a digit multimeter. (c) Voltage responses measured using a commercial oscilloscope and (d) current and (e) voltage output as a function of the pressures in the range from 200 to 2000 Pa.
(e) (b)
(d)
K1 = 0.94 nA/Pa
K2 = 0.37 nA/Pa
R2 = 0,988
R2 = 0,987
K1 = 8.8 mV/Pa
R2 = 0,996
K2 = 3.9 mV/Pa
R2 = 0,989
[image:12.612.76.548.128.647.2]13
pressures are below 800 Pa, the relationship voltage-pressure is nearly linear (R2= 0.996) and the
pressure sensitivity is 8.8 mV/Pa. In the region between 800 Pa and 1400 Pa, the pressure sensitivity decreases up to 3.9 mV/Pa and the relation between the generated voltage and the pressure is still very close to linear (R2= 0.989). In the region beyond 1600 Pa, the TENG reaches
a saturation point. On the basis of these results, it can be concluded that the TENG exhibits a very sensitive response to applied pressures in the range from 200 to 1600 Pa.
Currently the electric response of the developed triboelectric nanogenerator to different pressures in the range from 200 to 2000 Pa was tested. The results obtained in Fig. 6d and e reveal that the TENG is more sensitivity to pressures in the low-pressure region. This is in good agreement with previous results. For example, the triboelectric sensor published in [18] shows a pressure sensitivity of 44 mV/Pa for pressures below 150 Pa. However, the sensitivity decreases to 0.5 mV/Pa at higher pressures. The developed triboelectric nanogenerator shows a pressure sensitivity of 8.8 mV/Pa for pressures below 800 Pa while the sensitivity decreases to 3.9 mV/Pa for pressures in the range from 800 to 1600 Pa. Thus, it can be concluded that the triboelectric nanogenerator has a very high sensitivity in this range of pressures. It can also be observed that the current-pressure and the voltage-pressure relationships show a different bilinear trend. This can be explained by the fact that voltage and current are different characteristics. As mentioned in [46], the current is dependent of the capacitance (C) and voltage (V) of the TENG while the voltage is dependent of the density of triboelectric charges (𝜃), the separation distance (𝑑) and the vacuum permittivity (𝜀𝑜). We believe that these fundamental basics can explain the differences between the current-pressure and voltage-pressure relationships. In any case, further research is needed to fully understand the differences between both relationships.
Furthermore, the reproducibility of the experiments is tested to determinate the stability of the electric responses for repeated applications of the same pressure. This experiment is carried out to is to find out if the electrospun fibers can withstand the pressure without being damaged which will ensure the experiment stability and reproducibility. In order to estimate the error which is due to variations in the measurement each pressure was repeated ten times. Then the mean electric values, standard deviations and coefficient of variations over the ten realizations for each
[image:13.612.72.569.569.713.2]of the maximum current outputs and peak-to-peak voltages were calculated.
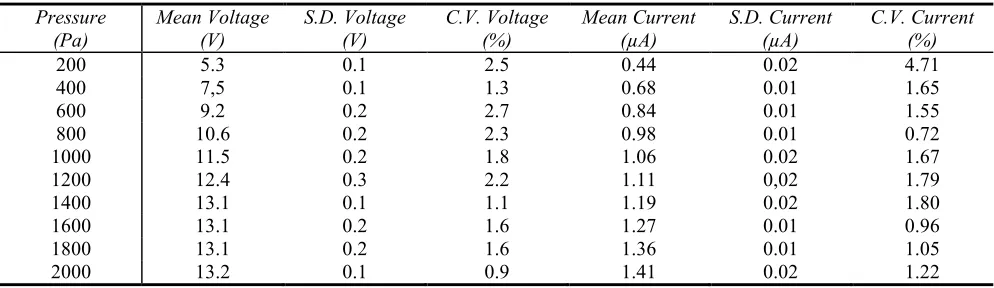
Table 1: Operational stability of TENG after ten repetitions for each pressure. Average value, standard deviation, and coefficient of variation (in percent) for voltage and current.
Pressure
(Pa) Mean Voltage (V) S.D. Voltage (V) C.V. Voltage (%) Mean Current (µA) S.D. Current (µA) C.V. Current (%)
200 5.3 0.1 2.5 0.44 0.02 4.71
400 7,5 0.1 1.3 0.68 0.01 1.65
600 9.2 0.2 2.7 0.84 0.01 1.55
800 10.6 0.2 2.3 0.98 0.01 0.72
1000 11.5 0.2 1.8 1.06 0.02 1.67
1200 12.4 0.3 2.2 1.11 0,02 1.79
1400 13.1 0.1 1.1 1.19 0.02 1.80
1600 13.1 0.2 1.6 1.27 0.01 0.96
1800 13.1 0.2 1.6 1.36 0.01 1.05
14
Table 1 shows the mean values, the standard deviations and coefficient of variation for the voltage and the current outputs as a function of the pressure. It shows the average voltage and current measured for each of the pressures. It can be observed that the electric outputs are affected by the pressure applied in the same way as demonstrated in figure 6. In addition, the standard deviations for the ten measurements of voltage and current are less than 0.3 V and 0.02 µA respectively and the average coefficients of variation are 1.8 % and 1.7 % respectively. Therefore, these results indicate that the miniscule changes in the voltages and current outputs can be considered within the range of the experimental error. Thus, it can be concluded that the electric outputs of the developed TENG are very stable and there is almost no change in the electric response of the nanogenerator under repeated applications of the same pressure. This indicates that the electrospun fibers are robust and not damaged due to the repeated application of the pressures and the developed TENG can be used as a pressure sensor
8. Conclusions
In summary, this research introduces a novel triboelectric nanogenerator prepared by PVDF and PVP fibers and tests its application as self-powered sensor, which detects and follows the pressure changes in real time.
An electrospinning method is used to fabricate the membranes of submicron fibers used in the TENG. This method was chosen because it is one of most economic, versatile and simple ways to prepare nanofibers. Additionally, electrospinning is a scalable industrial process and thus makes a promising alternative for fabrication of such devices on larger scale using a low-cost technology.
This study also establishes the working mechanism of the developed TENG and more precisely that it is associated to the triboelectric effect between the two materials used, rather than the piezoelectric properties of PVDF. The results from this study confirm the lack of piezoelectricity in the electric output produced by the TENG, which is concluded from the alpha crystalline structure of PVDF nanofibers. It is thus confirmed that the application of the developed device as a transducer is due to the triboelectric effect between PVDF and PVP fibres, caused by their strong ability exchange electrons which is enhanced by their large contact surface.
15
few publications which report the pressure sensitivity of TENGs [17], but this sensitivity is higher than the sensitivity of most reported triboelectric sensors.
Finally, the reproducibility of the electric output of the nanogenerator under the same pressure is demonstrated. The results show that the output of the fabricated TENG was very stable and the electric response of the TENG exhibits almost no change for repeated applications of the same pressure. This is a very important property for the potential applications of the developed TENG as a self-powered pressure sensor.
In our view, we believe this work will serve as an excellent initial step toward the development of a potential TENG which can be used as self-powered sensor when dynamical pressures are applied. At the same time, this work demonstrates the potential applications of TENGs for pressure monitoring with advantages of being self-powered, environmental friendly, maintenance-free, easy fabrication and low-cost as compared to conventional sensors.
9. Acknowledgments
We gratefully acknowledge the financial support from the British council and Erasmus +. The authors also wish to specially thank IMDEA Materials Institute for its valuable support in terms of materials and equipment.
10. References
1) S. Joshi, G.M. Hedge, M.M. Nayak, K. Rajanna, A novel piezoelectric thin film impact sensor:
Application in non-destructive material discrimination, Sens Actuators A Phys. 199 (2013) 272-282.
2) S. Hannah, D. Uttamchandani, H. Gleskova, Response of P(VDF-TrFE) Sensor to Force and
Temperature, IEEE Conference on Ph.D. Research in Microelectronics and Electronics (PRIME), (2015) 369-372.
3) C. Metzger et al., Flexible-foam-based capacitive sensor arrays for object detection at low
cost, Appl. Phys. Lett. 92 (2008) 013506.
4) J.S. Heo, J.H. Chung, J.J. Lee, Tactile sensor arrays using fiber Bragg grating sensors, Sens.
Actuators A Phys. 126 (2006) 312-327.
5) H. Zhang, E. So, Hybrid resistive tactile sensing. IEEE Trans. Syst. Man Cybern. Part B, 32
(2002) 57-65.
6) W. Yang, J. Chen, G. Zhu, J. Yang, P. Bai, Y. Su, Q. Jing, X. Cao, Z. L. Wang, Harvesting
16
7) W. Yang, J. Chen, Q. Jing, J. Yang, X. Wen, Y. Su, G. Zhu, P. Bai, Z. L. Wang, 3D Stack
Integrated Triboelectric Nanogenerator for Harvesting Vibration Energy, Adv Funct Mater.
24 (2014) 4090-4096.
8) Y. Su, X. Wen, G. Zhu, J. Yang, J. Chen, P. Bai, Z. Wu, Y. Jiang, Z. L. Wang, Hybrid triboelectric nanogenerator for harvesting water wave energy and as a self-powered distress signal emitter, Nano Energy, 9 (2014) 186-195.
9) T.C. Hou, Y. Yang, H. Zhang, J. Chen, L.J. Chen, Z.L. Wang, Triboelectric nanogenerator
built inside shoe insole for harvesting walking energy, Nano Energy, 2 (2013) 856-862.
10)H. Zhang, Y. Yang, Y. Su, J. Chen, K. Adams, S. Lee, C. Hu, Z. L. Wang, Triboelectric nanogenerator for harvesting vibration energy in full space and as self-powered acceleration sensor, Adv Funct Mater, 24 (2014) 1401-1407.
11)Y. Yang, H.L. Zhang, Z.H. Lin, Y.S. Zhou, Q.S. Jing, Y.J. Su, J. Yang, J. Chen, C.G. Hu, Z.L.
Wang, Human Skin Based Triboelectric Nanogenerators for Harvesting Biomechanical
Energy as Self-Powered Active Tactile Sensor System, ACS Nano, 7 (2013) 9213-9222.
12) Q. Liang, Z. Zhanga, X. Yan, Y. Gu, Y, Zhao, G. Zhang, S. Lu, Q. Liao, Y. Zhang, Functional
triboelectric generator as self-powered vibration sensor with contact mode and non-contact mode, Nano Energy, 14 (2015) 209-216.
13)C. Xiang, C. Liu, C. Hao, Z. Wang, Z. Wang, L. Che, X. Zhou, A self-powered acceleration
sensor with flexible materials based on triboelectric effect, Nano Energy 31 (2017) 469-477.
14)Q. Jing, G. Zhu, W. Wu, P. Bai, Y. Xie, R.P.S. Han, Z.L. Wang, Self-powered triboelectric
velocity sensor for dual-mode sensing of rectified linear and rotary motions, Nano Energy, 10
(2014) 305-312.
15)Y. Xi, H. Guo, Y. Zi, X. Li, J. Wang, J. Deng, S. Li, C. Hu, X. Cao, Z.L. Wang,
Multifunctional TENG for Blue Energy Scavenging and Self-Powered Wind-Speed Sensor,
Adv. Energy Mater., 7 (2017) 1602397.
16)Y. Su, G. Xie, S. Wang, H. Tai, Q. Zhang, H. Du, H. Zhang, X. Du, Y. Jiang, Novel
high-performance self-powered humidity detection enabled by triboelectric effect, Sens Actuators
B Chem., 251 (2017) 144-152.
17)Z.H. Lin, G. Zhu, Y.S. Zhou, Y. Yang, P. Bai, J. Chen, Z.L. Wang, A self-powered triboelectric nanosensor for mercury ion detection, Angew. Chem. Int. Ed., 52 (2013) 5065-5069.
18)G. Zhu, W.Q. Yang, T. Zhang, Q. Jing, J. Chen, Y.S. Zhou, P. Bai, Z.L. Wang, Self-Powered,
17
19)M.F. Lin, J. Xiong, J. Wang, k. Parida, P.S. Lee, Core-shell nanofiber mats for tactile pressure sensor and nanogenerator applications, Nano Energy, 44 (2018) 248-255.
20)K.Y. Lee, H.J. Yoon, T. Jiang, X. Wen, W. Seung, S.W. Kim, Z.L. Wang, Fully Packaged
Self-Powered Triboelectric Pressure Sensor Using Hemispheres-Array, Adv. Energy Mater.,
6 (2016) 1502566.
21) S. Wang, S. Niu, J. Yang, L. Lin, Z.L. Wang, Quantitative measurements of vibration amplitude using a contact-mode freestanding triboelectric nanogenerator, ACS Nano, 8
(2014) 12004-12013.
22)Q. Liang, Z. Zhanga, X. Yan, Y. Gu, Y. Zhao, G. Zhang, S. Lu, Q. Lia, Y. Zhang, Functional
triboelectric generator as self-powered vibration sensor with contact mode and non-contact
mode, Nano Energy, 14 (2015) 209-216.
23)F.R. Fan, Z.Q. Tian, Z.L. Wang, Flexible triboelectric generator!, Nano Energy, 1 (2012) 328-334.
24) X.S Zhang, J. Brugger, B. Kim, Nano Energy, A silk-fibroin-based transparent triboelectric
generator suitable for autonomous sensor network, Nano Energy, 20 (2016) 37-47.
25)W. Li, J. Sun, M. Chen, Nano Energy, Triboelectric nanogenerator using nano-Ag ink as
electrode material, Nano Energy, 3 (2014) 95-101.
26)Y. Zheng, L. Cheng, M. Yuan, Z. Wang, L. Zhang, Y. Qin, T. Jing, An electrospun
nanowire-based triboelectric nanogenerator and its application in a fully self-powered UV detector, Nanoscale, 6 (2014) 7842-7846.
27)B.U. Ye, B.J. Kim, J. Ryu, J.Y. Lee, J.M. Baik, K. Hong, Electrospun ion gel nanofibers for
flexible triboelectric nanogenerator: electrochemical effect on output power, Nanoscale, 7
(2015) 16189-16194.
28)Y. Hao, Y. Bin, H. Tao, W. Cheng, W. Hongzhi, Z. Meifang, Preparation and Optimization
of Polyvinylidene Fluoride (PVDF) Triboelectric Nanogenerator via Electrospinning, 15th
IEEE International Conference on Nanotechnology, (2015) 1485-1488.
29)B. Yu, H. Yu, H. Wang, Q. Zhang, M. Zhu, High-power triboelectric nanogenerator prepared
from electrospun mats with spongy parenchyma-like structure, Nano Energy 34 (2017) 69-75.
30)B. Zhang, L. Zhang, W. Deng, L. Jin, F. Chun, H. Pan, B. Gu, H. Zhang, Z. Lv, W. Yang, Z.L.
Wang, Self-Powered Acceleration Sensor Based on Liquid Metal Triboelectric Nanogenerator
for Vibration Monitoring, ACS Nano, 11 (2017) 7440-7446.
31)C. Garcia, I. Trendafilova, R. Guzman, J. Sanchez, Triboelectric Nanogenerator as
18
32)C. Xiang, C. Liu, C. Hao, Z. Wang, L. Che, X. Zhou, A self-powered acceleration sensor with
flexible materials based on triboelectric effect, Nano Energy, 31 (2017) 469-477.
33)L. Dhakar, S. Gudla, X. Shan, Z. Wang, F.E.H Tay, C.H. Heng, C. Lee, Large scale triboelectric nanogenerator and self-powered pressure sensor array using low cost roll-to-roll UV embossing, Sci. Rep. 6 (2016) 22253.
34)A. Yu, L. Chen, X. Chen, A. Zhang, F. Fan, Y. Zhan, Z. L. Wang, Triboelectric sensor as
self-powered signal reader for scanning probe surface topography imaging, Nanotechnology, 26
(2015) 165501.
35)C. Garcia, J. Wilson, I. Trendafilova, L. Yang, Vibratory behaviour of glass fibre reinforced
polymer (GFRP) interleaved with nylon nanofibers, Compos. Struc. 176 (2017) 923-932.
36)J. Lin, B. Ding, J. Yu, Y. Hsieh, ACS Appl Mater Interfaces, Direct Fabrication of Highly
Nanoporous Polystyrene Fibers via Electrospinning, 2 (2010) 521-528.
37)S. Piperno, L. Lozzi, R. Rastelli, M. Passacantando, S. Santucci, PMMA nanofibers production
by electrospinning, Appl. Surf. Sci., 252 (2006) 5583-5586.
38)F. Zhang, B. Li, J. Zheng, C. Xu, Facile fabrication of micro-nano structured triboelectric
nanogenerator with high electric output, Nanoscale Res. Lett., 10 (2015) 298.
39)T. Huang, M. Lu, H. Yu, Q. Zhang, H. Wang, M. Zhu, Enhanced Power Output of a
Triboelectric Nanogenerator Composed of Electrospun Nanofiber Mats Doped with Graphene Oxide, Sci. Rep. 5 (2015) 13942.
40)M.Lai, B. Du, H. Guo, Y. Xi, H. Yang, C. Hu, J. Wang, Z.L. Wang, Enhancing the Output
Charge Density of TENG via Building Longitudinal Paths of Electrostatic Charges in the Contact Layers, ACS Appl. Mater. Interfaces, 10 (2018) 2158-2165.
41)M. Zaccaria, D. Fabiani, A. Zucchelli, J. Belcari, O. Bocchi, T. Cramer, B. Fraboni, Electret
Behaviour of Electrospun PVDF-based fibers, IEEE Conference on Electrical Insulation and Dielectric Phenomena (CEIDP) (2016) 137-140.
42)P. Martins, A.C. Lopes, S. Lanceros-Mendez, Electroactive phases of poly(vinylidene
fluoride): Determination, processing and applications, Prog. Polym. Sci. 39 (2014) 683-706.
43)C.J. Angammana, S.H. Jayaram, Fundamental of electrospinning and processing
technologies, Part Sci Technol, 34 (2016) 72-82.
44)S. Wang, L. Lin, Z.L. Wang, Triboelectric nanogenerators as self-powered active sensors,
Nano Energy, 11 (2015) 436-462.
45)Z.L. Wang, L. Lin, J. Chen, S. Niu, Y. Zi, Triboelectric nanogenerators, Green energy and
19
46)Y. Wang, Y. Yang, Z.L. Wang, Triboelectric nanogenerators as flexible power sources, npj
Flexible Electronics, 1 (2017) 10.
Cristobal Garcia received his B.S in Chemistry in 2010 and his M.S in Materials Engineer in 2012 from University Complutense de Madrid, Spain. From 2013 to 2016, he worked in the area of research and development for two international companies. He is currently a Ph.D. candidate at the Mechanical and Aerospace Department in the Strathclyde University, United Kingdom. His main research interests are synthesis and characterization of nanomaterials, design and development of nanogenerators and self-powered nanosensors. He also works on nanocomposites with advanced properties and finite element modelling analysis.
Irina Trendafilova received her Ph.D. from Sofia University in Bulgaria. She is a reader at the University of Strathclyde in Glasgow. Her research track record is in vibrations of structures made of composites, structural dynamics and structural and machinery vibration-based health monitoring, nonlinear dynamics and signal processing methods. She has published more than 85 papers in leading international journals and 3 book chapters. She is and editor of the Elsevier Journal of Sound and Vibration, https://ees.elsevier.com/jsv/.
Roberto Guzman de Villoria received his Ph.D. from Zaragoza University in 2007. He is currently a senior researcher at Foundation for the Research, Development and Application of Composite Materials (FIDAMC). His research interests are in the area of nano-architectures, design and development of new materials and structures with tailored mechanical and functional properties. He has published more than 50 papers in peer-reviewed international journals and has participated in several industrial research projects in the field of nano-composites, hierarchical structures and nano-engineered composites for aerospace applications.


![Fig. 5: Simplified description of the generation of electricity [44-45]: (a) the original position of the nanogenerator](https://thumb-us.123doks.com/thumbv2/123dok_us/1381393.91337/10.612.151.472.222.485/fig-simplified-description-generation-electricity-original-position-nanogenerator.webp)