T h e m e 2
Economy and finance Series Β
Short-term statistics
ISSN 1024-4239
ECUEMS information
& Central bank interest rates
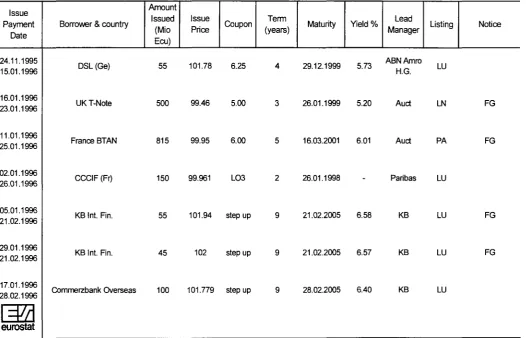
A lively start for the E C U bond market in 1996 Nine ECU bond issues took place so far this year (9/2/96), for a total amount of 2088 ECU millions. The largest issues once again came from the official sector. The United Kingdom tapped the market with a new three-year Treasury note bearing a coupon of 5%. The outstanding amount of the note should be increased in the next tenders. The French Treasury went to the ECU market three times. They issued two BTANs and one OAT representing 1183 millions of ECU. The 6% 2001 BTAN is a new line representing 815 millions.
Five bonds of limited size were issued by private names. Kredietbank lead-managed four of these nine-year issues. They present an original structure as they carry a step-up coupon, i.e. they pay a relatively low coupon in the first years and a higher coupon later on. The continued steepening trend of ECU yields is supposed to be one reason for adopting this kind of structure. A French bank issued a 150 million floating rate note.
The amount of ECU bonds repaid in the first two months of 1996 is estimated to be around 6 billions of ECU.
Bilateral fluctuations of the ERM currencies Graph 1 on page 4 portrays the evolution of the bilateral fluctuations of ERM currencies between 1 December 1995 and 31 January 1996 calculated on a daily basis.
This graph illustrates that until 31 January 1996, the IRL was at a weak position against the other ERM currencies and in particular against PTA, HFL, BLF, DM, and ÖS. It also illustrates that since 1 December the FF (despite a reversal in the trend after 4 January 1996), the ESC, and in particular the PTA have appreciated against the DM.
The graph also shows that since 2 January (except the period 26 - 30 January) the PTA has been the strongest currency in the ERM. The PTA, together with the HFL, the
BLF and the ÖS have moved close to the DM until the end of January 1996.
Graph 1 portrays that by the end of January, all ERM currencies moved within a band of 4.38%, which is narrower than at the end of the previous month. Excluding the IRL, the band was 3.20%, which is wider than at the end of December 1995 by 0.74 percentage points.
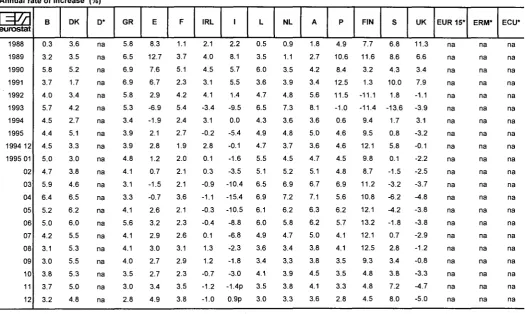
Consumer price indices in ECU
The greatest increase was recorded in the index of Sweden (8.0%) owing to the sharp appreciation of its currency against the ECU rather than to its modest inflation rate in the 12 months up to December. The indices of six ERM countries, that is, those of Denmark, France, Austria, Holland, Belgium and Luxembourg rose by 4.8%, 3.8%, 3.6%, 3.3%, 3.2% and 3.0% respectively, due partly to the appreciation of their currencies against the ECU and partly to their modest inflation rates over the 12 month period. For the same reasons, the index of Finland increased by 4.50%.
The index of Spain recorded an increase of 4.9% owing to its inflation rate rather than to the modest appreciation of the PTA against the ECU from December 1994 to December 1995.
The indices of Italy, Greece and Portugal rose by 5.7%, 2.8%, and 2.8% respectively. These increases in the national CPIs expressed in ECU reflect increases in the corresponding inflation rates which were partly offset by the rate of depreciation of the LIT, DR and ESC against the ECU, from December 1994 to December 1995.
The index of the United Kingdom recorded a decrease of 5.0% due to the larger depreciation of the UKL against the ECU relative to the rate of growth of the CPI in national currency over the 12 month period. For the same reason the index of Ireland decreased by 1.0%.
eurostat
OFICINA ESTADÍSTICA DE LAS COMUNIDADES EUROPEAS DE EUROPÆISKE FÆLLESSKABERS STATISTISKE KONTOR STATISTISCHES AMT DER EUROPÄISCHEN GEMEINSCHAFTEN ΣΤΑΤΙΣΤΙΚΗ ΥΠΗΡΕΣΙΑ ΤΩΝ ΕΥΡΩΠΑΪΚΩΝ ΚΟΙΝΟΤΗΤΩΝ STATISTICAL OFFICE OF THE EUROPEAN COMMUNITIES OFFICE STATISTIQUE DES COMMUNAUTÉS EUROPÉENNES ISTITUTO STATISTICO DELLE COMUNITÀ EUROPEE
BUREAU VOOR DE STATISTIEK DER EUROPESE GEMEENSCHAPPEN SERVIÇO DE ESTATÍSTICA DAS COMUNIDADES EUROPEIAS
L-2920 Luxembourg - Tél. 43 01-1 - Télex COMEUR LU 3423 B-1049 Bruxelles, rue de la Loi 200 - Tél. 299 11 11
Note
For any information on the statistics
TEL:
FAX:
+352 346991-337
+352
+352
346991-334 or 341
4301- 32929
in
F.
S
this bulletin contact Luxembourg:
GARCIA-VALERO / R.
WARTON-WOODS / 0
SCHMITZ
. DELOBBE (Central Bank Interest Rates)
EUROSTAT
Monetary and Financial Statistics
Jean Monnet Building
APC C4/04
L-2920 Luxembourg
© ECSC-EC-EAEC, Brussels · Luxembourg, 1996
Reproduction is authorized, except for commercial purposes, provided the source is acknowledged.
TABLE OF CONTENTS
COMMENTS 1
GRAPHS
1. BILATERAL FLUCTUATIONS OF THE ERM CURRENCIES 4
2. DIVERGENCE INDICATOR 4
TABLE I
ECU BOND ISSUES 5
TABLE II
LAST MONTH'S ECU BOND ISSUES 5
TABLE III
CONSUMER PRICE INDICES IN NATIONAL CURRENCY 6
TABLE IV
CONSUMER PRICE INDICES IN ECU 7
TABLE V
ECU EXCHANGE RATES 8
TABLE VI
CENTRAL RATES AND INTERVENTION LIMIT RATES, IN FORCE SINCE 6th MARCH 1995,
FOR THE CURRENCIES PARTICIPATING IN THE EMS EXCHANGE RATE MECHANISM 10
TABLE VII
OPERATION RATES OF THE EMI AND INTEREST RATES AND YIELDS OF
ECU INVESTMENTS 11
DAILY RATES 12
TABLE VIII
CENTRAL BANK INTEREST RATES 13
GRAPHS
EVOLUTION OF CENTRAL BANK INTEREST RATES OVER THE LAST 12 MONTHS 15
Graph 1 : BILATERAL FLUCTUATIONS OF THE ERM CURRENCIES
7.5% τ
15.12.95 3.1.96 17.1.96 31.1.96
Graph 2: DIVERGENCE INDICATOR
75 τ
TABLE I
ECU BOND ISSUES (Mio ECU) *
l=M
eurostat1989 1990
1991 1992 1993 1994 1995
1994 I II III IV
1995 I II III IV
1995 11 12 1996 01
TOTAL EURO
11 127
15 040 27 163 19 242
6 870
6 485
5 596
2 410
1 815 945
1 315
2 375 281
2 375 565
100 115 205
European Union
Total
6 461 10 525
19 266 11 675
5 020 5 010 5 046
2 285 1 215
595 915
2 075 31 2 375 565
100 115 205
Business sector 4 400 3 990
6 581 4 870 1 565 1 825 956
910 415 150 350
525 31 50 350
0 0 205
Govern-ments
500 5 000
7 900 2 475 250 1 300 3 075
1 150 0 150 0
900 0 2 175 0
0 0 0
Institu-tions 1 561 1 535
4 785
4 330 3 205 1 885 1 015
225 800 295 565
650 0 150 215
100 115 0
Non-European Union
Total
4 666 4 515
7 897 7 567 1 850 1 475 550
125 600 350 400
300 250 0 0
0 0 0
Business sector 4 141 3 565
3 932 3 902 250 1 075
550
125 200 350 400
300 250 0 0
0 0 0
Govern-ments
425 550
3 790 2 850 1 600
400 0
0 400 0 0
0 0 0 0
0 0 0
Organi-sations 100 400
175 815 0 0 0
1 0 0 0
0 0 0 0
0 0 0
Domestic**
1 652 2 857
3 134 4 151 6 508 7 311 6 784
2 498 2 559 1 221 1 033
2 939 1 075 2 050
720
470 0 1 315
EURO + DOMESTIC
12 779 17 897
30 297 23 393 13 378 13 796 12 380
4 908
4 374 2 166 2 348
5 314 1 356 4 425 1 285
570 115
1 520
(*) Recording based on the payment date (**) Only domestic issues which can be assimilated with Eurobonds
TABLE II
LAST MONTH'S ECU BOND ISSUES
Issue Payment
Date
24.11.1995 15.01.1996
16.01.1996 23.01.1996
11.01.1996 25.01.1996
02.01.1996 26.01.1996
05.01.1996 21.02.1996
29.01.1996 21.02.1996
17.01.1996 28.02.1996
\=VA
eurostatBorrower & country
DSL (Ge)
UKT-Note
France BTAN
CCCIF (Fr)
KB Int. Fin.
KB Int. Fin.
Commerzbank Overseas
Amount Issued (Mio Ecu)
55
500
815
150
55
45
100
Issue Price
101.78
99.46
99.95
99.961
101.94
102
101.779
Coupon
6.25
5.00
6.00
L03
step up
step up
step up Term (years)
4
3
5
2
9
9
9
Maturity
29.12.1999
26.01.1999
16.03.2001
26.01.1998
21.02.2005
21.02.2005
28.02.2005
Yield %
5.73
5.20
6.01
-6.58
6.57
6.40
Lead Manager
ABNAmro KG.
Auct
Auct
Paribas
KB
KB
KB
Listing
LU
LN
PA
LU
LU
LU
LU
Notice
FG
FG
FG
TABLE III
CONSUMER PRICE INDICES IN NATIONAL CURRENCY
1985=100
Wr
eurostat 1988 1989 1990 1991 1992 1993 1994 1995 1994 12 1995 01 02 03 04 05 06 07 08 09 10 11 12 Β 104.1 107.3 111.0 114.6 117.4 120.6 123.5 125.3 124.0 124.5 124.8 124.7 124.9 124.9 125.0 125.7 126.0 125.7 125.4 125.8 125.8 DK 112.7 118.1 121.2 124.1 126.7 128.3 130.9 133.6 132.0 132.1 132.7 133.1 133.5 134.0 133.8 133.2 133.4 134.2 134.2 134.5 134.4 D* na na na na na na na na na na na na na na na na na na na na na GR 162.6 184.9 222.6 266.0 308.1 352.6 391.1 427.4 411.9 410.2 408.5 420.2 425.2 428.1 431.9 421.8 422.1 434.8 439.7 440.7 445.2 E 120.0 128.2 136.8 145.0 153.5 160.6 168.1 176.0 171.1 172.9 173.7 174.8 175.7 175.7 176.0 176.0 176.4 177.2 177.5 178.0 178.4 F 108.7 112.5 116.5 120.2 123.0 125.6 127.8 129.9 128.3 128.7 129.2 129.5 129.6 129.9 129.9 129.6 130.2 130.7 130.8 130.9 131.0 IRL 109.4 113.9 117.6 121.3 125.1 126.9 129.8 133.2 131.8 133.1 133.8 133.9 I 116.5 123.8 131.8 140.0 147.3 153.8 160.0 168.3 162.8 163.4 164.8 165.8 166.6 167.5 168.7 169.0 169.5 169.9 170.6 171.6p 172.0p L 101.7 105.1 109.0 112.4 115.9 120.1 122.7 125.1 124.1 124.5 124.7 124.8 124.8 125.0 125.1 125.2 125.1 125.3 125.5 125.6 125.6 NL 100.7 101.7 104.2 108.3 111.7 114.6 117.8 120.1 118.5 118.8 119.4 120.0 120.2 120.0 119.8 119.8 120.0 121.0 120.9 120.9 120.4 A 105.1 107.8 111.3 115.1 119.7 124.0 127.7 130.6 128.1 129.1 129.7 130.1 130.2 130.2 130.7 131.6 132.3 131.1 130.7 130.6 130.5 Ρ 133.9 151.0 170.9 189.6 206.7 220.0 231.5 241.1 234.7 237.5 239.2 240.4 241.3 241.1 240.4 240.4 241.6 242.1 243.0 243.2 242.7 FIN 112.6 120.0 127.4 132.8 136.7 139.7 141.2 142.6 142.0 141.9 142.4 142.4 142.5 142.6 143.1 143.0 142.8 142.9 142.9 142.5 142.4 S 114.9 122.3 135.1 147.8 151.1 158.2 161.6 165.7 162.9 163.5 164.1 164.8 165.9 166.1 165.9 165.7 165.5 166.6 167.1 167.0 166.5 UK 113.0 121.8 133.3 141.1 146.4 148.7 152.4 157.6 154.3 154.3 155.3 155.9 157.5 158.1 158.4 157.6 158.5 159.2 158.4 158.4 159.3 EUR 15* na na na na na na na na na na na na na na na na na na na na na ERM* na na na na na na na na na na na na na na na na na na na na naAnnual rate of increase (%)
l=fr
eurostat 1988 1989 1990 1991 1992 1993 1994 1995 1994 12 1995 01 02 03 04 05 06 07 08 09 10 11 12 Β 1.2 3.1 3.5 3.2 2.4 2.8 2.4 1.5 1.9 1.9 1.8 1.7 1.7 1.4 1.3 1.2 1.3 1.2 1.2 1.5 1.5 DK 4.5 4.8 2.6 2.4 2.1 1.3 2.0 2.1 2.3 2.3 2.3 2.5 2.4 2.4 2.1 1.8 1.6 2.1 1.9 1.9 1.8 D* na na na na na na na na na na na na na na na na na na na na na GR 13.5 13.7 20.4 19.5 15.9 14.5 10.9 9.3 10.8 11.1 10.4 10.3 9.9 9.8 9.7 8.9 8.7 8.4 8.3 8.2 8.1 E 4.8 6.8 6.7 6.0 5.9 4.6 4.7 4.7 4.3 4.4 4.8 5.2 5.2 5.0 5.1 4.7 4.3 4.4 4.4 4.3 4.3 F 2.7 3.5 3.5 3.2 2.4 2.1 1.7 1.8 1.6 1.7 1.7 1.8 1.6 1.6 1.6 1.5 1.9 2.0 1.8 1.9 2.1 IRL 2.2 4.1 3.3 3.2 3.1 1.4 2.3 2.6 2.6 2.6 2.5 2.4 I 5.1 6.2 6.5 6.3 5.2 4.5 4.0 5.2 4.0 3.9 4.3 4.7 5.0 5.1 5.6 5.5 5.7 5.6 5.5 5.7p 5.7p L 1.4 3.4 3.7 3.1 3.2 3.6 2.2 1.9 2.0 2.3 2.2 2.3 2.2 2.2 2.3 1.9 1.8 1.6 1.6 1.3 1.3 NL 0.9 1.1 2.5 3.9 3.2 2.6 2.8 1.9 2.6 2.5 2.4 2.3 2.3 2.1 2.2 1.8 1.5 1.5 1.3 1.6 1.6 A 1.9 2.6 3.3 3.3 4.0 3.6 3.0 2.2 2.6 2.6 2.4 2.4 2.6 2.4 2.6 2.2 2.1 2.0 1.9 1.9 1.8 Ρ 9.7 12.8 13.2 10.9 9.0 6.4 5.2 4.1 4.0 4.4 4.6 4.8 4.6 4.3 3.8 3.7 4.1 4.0 4.0 3.9 3.4 FIN 5.1 6.6 6.1 4.3 2.9 2.2 1.1 1.0 1.6 1.8 1.8 1.6 1.5 1.5 1.0 0.8 0.5 0.4 0.3 0.3 0.3 S 6.1 6.6 10.4 9.7 2.6 4.7 2.3 2.9 2.6 2.9 2.9 3.0 3.3 3.2 3.0 2.9 2.7 2.5 2.7 2.7 2.6 UK 4.9 7.8 9.5 5.9 3.7 1.6 2.5 3.4 2.9 3.3 3.4 3.5 3.3 3.4 3.5 3.5 3.6 3.9 3.2 3.1 3.2EUR 15*
na na na na na na na na na na na na na na na na na na na na na ERM* na na na na na na na na na na na na na na na na na na na na na ρ = provisional
TABLE IV
CONSUMER PRICE INDICES IN ECU 1985=100
l=M
eurostat 1988 1989 1990 1991 1992 1993 1994 19951994 12
1995 01
02 03 04 05 06 07 08 09 10 11 12 Β 107.6 111.1 117.5 121.9 126.7 133.8 139.8 146.0 141.7 142.8 144.1 146.5 147.3 146.5 146.6 147.0 146.1 145.6 146.4 146.5 146.2 DK 113.7 117.7 123.7 125.8 130.1 135.5 139.1 146.2 141.3 141.4 142.6 143.8 146.7 147.6 147.4 146.8 146.4 147.2 148.2 148.4 148.0 D* na na na na na na na na na na na na na na na na na na na na na GR 101.0 107.5 115.0 122.9 129.9 136.7 141.3 146.8 145.2 144.4 143.1 145.1 146.6 147.8 149.2 144.8 145.2 148.9 148.8 148.1 149.2 E 112.5 126.8 136.4 145.5 149.6 139.3 136.4 139.3 137.2 135.5 136.4 133.1 135.9 139.2 140.2 140.9 141.5 141.3 141.3 142.4 143.9 F 105.0 108.9 114.5 117.1 122.1 128.7 131.8 135.4 132.5 133.0 133.5 134.1 135.4 134.1 134.8 135.5 136.5 136.6 136.0 137.5 137.5 IRL 100.9 104.9 109.6 113.0 117.6 113.6 117.0 116.8 118.0 118.3 117.1 114.4 115.6 116.7 116.6 116.7 117.8 118.1 116.9 116.3 116.8 I 109.6 118.6 125.2 132.1 133.9 121.0 120.9 114.4 118.6 118.3 117.0 107.8 105.0 111.0 111.8 112.9 117.1 118.1 116.2 117.7p 119.6p L 105.2 108.9 115.4 119.6 125.2 133.3 139.0 145.8 141.8 142.8 143.9 146.5 147.1 146.6 146.7 146.4 145.1 145.2 146.5 146.2 146.0 NL 108.3 109.4 113.2 117.7 123.3 132.3 137.1 143.7 139.1 139.9 141.5 145.1 145.5 144.7 144.2 143.8 142.8 143.9 144.9 144.5 143.7 A 112.7 115.8 120.6 124.7 131.7 142.4 147.5 155.0 149.0 150.9 152.5 156.0 156.2 155.6 155.9 156.7 156.2 154.7 155.3 154.8 154.3 Ρ 102.3 113.1 122.6 137.9 153.8 152.1 152.8 159.7 155.6 157.4 159.0 160.2 160.2 159.9 159.0 159.2 160.8 160.2 160.4 160.7 160.0 FIN 106.9 119.4 123.1 124.8 110.9 98.0 107.2 117.3 113.1 113.3 114.4 115.8 116.7 117.3 117.4 117.6 119.5 119.0 118.9 119.1 118.2 S 103.5 112.3 117.2 128.8 131.0 113.2 115.1 116.0 116.2 115.0 115.0 112.1 109.7 112.2 111.9 111.9 114.4 118.1 120.7 124.7 125.5 UK 100.1 106.5 110.0 118.5 117.2 112.2 115.6 111.9 116.4 115.2 114.1 111.5 111.1 111.8 111.6 110.0 112.1 113.2 111.2 110.0 110.6
EUR 15*
na na na na na na na na na na na na na na na na na na na na na ERM* na na na na na na na na na na na na na na na na na na na na na ECU* na na na na na na na na na na na na na na na na na na na na na
Annual rate of increase
I =tør
eurostat 1988 1989 1990 1991 1992 1993 1994 19951994 12
1995 01 02 03 04 05 06 07 08 09 10 11 12 Β 0.3 3.2 5.8 3.7 4.0 5.7 4.5 4.4 4.5 5.0 4.7 5.9 6.4 5.2 5.0 4.2 3.1 3.0 3.8 3.7 3.2 DK 3.6 3.5 5.2 1.7 3.4 4.2 2.7 5.1 3.3 3.0 3.8 4.6 6.5 6.2 6.0 5.5 5.3 5.5 5.3 5.0 4.8 (%) D* na na na na na na na na na na na na na na na na na na na na na GR 5.8 6.5 6.9 6.9 5.8 5.3 3.4 3.9 3.9 4.8 4.1 3.1 3.3 4.1 5.6 4.1 4.1 4.0 3.5 3.0 2.8 E 8.3 12.7 7.6 6.7 2.9 -6.9 -1.9 2.1 2.8 1.2 0.7 -1.5 -0.7 2.6 3.2 2.9 3.0 2.7 2.7 3.4 4.9 F 1.1 3.7 5.1 2.3 4.2 5.4 2.4 2.7 1.9 2.0 2.1 2.1 3.6 2.1 2.3 2.6 3.1 2.9 2.3 3.5 3.8 IRL 2.1 4.0 4.5 3.1 4.1 -3.4 3.1 -0.2 2.8 0.1 0.3 -0.9 -1.1 -0.3 -0.4 0.1 1.3 1.2 -0.7 -1.2 -1.0 I 2.2 8.1 5.7 5.5 1.4 -9.5 0.0 -5.4 -0.1 -1.6 -3.5 -10.4 -15.4 -10.5 -8.8 -6.8 -2.3 -1.8 -3.0 -1.4p 0.9p L 0.5 3.5 6.0 3.6 4.7 6.5 4.3 4.9 4.7 5.5 5.1 6.5 6.9 6.1 6.0 4.9 3.6 3.4 4.1 3.5 3.0 NL 0.9 1.1 3.5 3.9 4.8 7.3 3.6 4.8 3.7 4.5 5.2 6.9 7.2 6.2 5.8 4.7 3.4 3.3 3.9 3.8 3.3 A 1.8 2.7 4.2 3.4 5.6 8.1 3.6 5.0 3.6 4.7 5.1 6.7 7.1 6.3 6.2 5.0 3.8 3.8 4.5 4.1 3.6 Ρ 4.9 10.6 8.4 12.5 11.5 -1.0 0.6 4.6 4.6 4.5 4.8 6.9 5.6 6.2 5.7 4.1 4.1 3.5 3.5 3.3 2.8 FIN 7.7 11.6 3.2 1.3 -11.1 -11.4 9.4 9.5 12.1 9.8 8.7 11.2 10.8 12.1 13.2 12.1 12.5 9.3 4.8 4.8 4.5 S 6.8 8.6 4.3 10.0 1.8 -13.6 1.7 0.8 5.8 0.1 -1.5 -3.2 -6.2 -4.2 -1.8 0.7 2.8 3.4 3.8 7.2 8.0 UK 11.3 6.6 3.4 7.9 -1.1 -3.9 3.1 -3.2 -0.1 -2.2 -2.5 -3.7 -4.8 -3.8 -3.8 -2.9 -1.2 -0.8 -3.3 -4.7 -5.0
EUR 15*
na na na na na na na na na na na na na na na na na na na na na ERM* na na na na na na na na na na na na na na na na na na na na na ECU* na na na na na na na na na na na na na na na na na na na na na
ρ = provisional
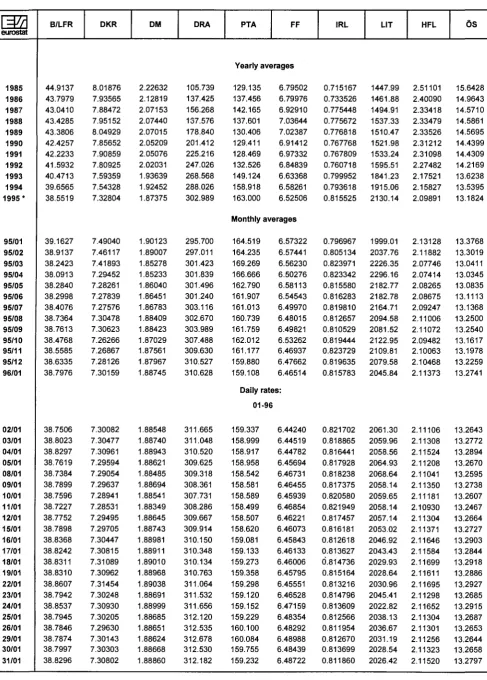
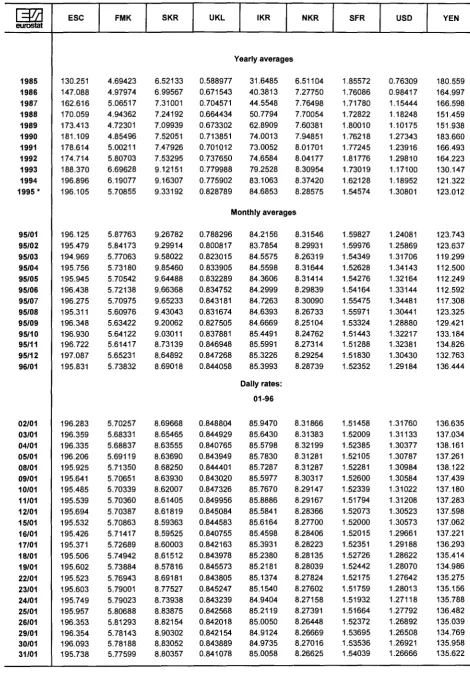
[image:7.595.34.560.416.730.2]TABLE V
ECU EXCHANGE RATES
l=M
eurostat 1985 1986 1987 1988 1989 1990 1991 1992 1993 1994 1995* B/LFR 44.9137 43.7979 43.0410 43.4285 43.3806 42.4257 42.2233 41.5932 40.4713 39.6565 38.5519 DKR 8.01876 7.93565 7.88472 7.95152 8.04929 7.85652 7.90859 7.80925 7.59359 7.54328 7.32804 DM 2.22632 2.12819 2.07153 2.07440 2.07015 2.05209 2.05076 2.02031 1.93639 1.92452 1.87375 DRA 105.739 137.425 156.268 137.576 178.840 201.412 225.216 247.026 268.568 288.026 302.989PTA FF
Yearly averages 129.135 137.456 142.165 137.601 130.406 129.411 128.469 132.526 149.124 158.918 163.000 6.79502 6.79976 6.92910 7.03644 7.02387 6.91412 6.97332 6.84839 6.63368 6.58261 6.52506 IRL 0.715167 0.733526 0.775448 0.775672 0.776818 0.767768 0.767809 0.760718 0.799952 0.793618 0.815525 LIT 1447.99 1461.88 1494.91 1537.33 1510.47 1521.98 1533.24 1595.51 1841.23 1915.06 2130.14 HFL 2.51101 2.40090 2.33418 2.33479 2.33526 2.31212 2.31098 2.27482 2.17521 2.15827 2.09891
ÖS
15.6428 14.9643 14.5710 14.5861 14.5695 14.4399 14.4309 14.2169 13.6238 13.5395 13.1824 95/01 95/02 95/03 95/04 95/05 95/06 95/07 95/08 95/09 95/10 95/11 95/12 96/01 02/01 03/01 04/01 05/01 08/01 09/01 10/01 11/01 12/01 15/01 16/01 17/01 18/01 19/01 22/01 23/01 24/01 25/01 26/01 29/01 30/01 31/01 39.1627 38.9137 38.2423 38.0913 38.2840 38.2998 38.4076 38.7364 38.7613 38.4768 38.5585 38.6335 38.7976 38.7506 38.8023 38.8297 38.7619 38.7384 38.7899 38.7596 38.7227 38.7752 38.7898 38.8368 38.8242 38.8311 38.8310 38.8607 38.7942 38.8537 38.7945 38.7846 38.7874 38.7997 38.8296 7.49040 7.46117 7.41893 7.29452 7.28261 7.27839 7.27576 7.30478 7.30623 7.26266 7.26867 7.28126 7.30159 7.30082 7.30477 7.30961 7.29594 7.29054 7.29637 7.28941 7.28531 7.29495 7.29705 7.30447 7.30815 7.31089 7.30962 7.31454 7.30248 7.30930 7.30205 7.29630 7.30143 7.30303 7.30802 1.90123 1.89007 1.85278 1.85233 1.86040 1.86451 1.86783 1.88409 1.88423 1.87029 1.87561 1.87967 1.88745 1.88548 1.88740 1.88943 1.88621 1.88485 1.88694 1.88541 1.88349 1.88645 1.88743 1.88981 1.88911 1.89010 1.88968 1.89038 1.88691 1.88999 1.88685 1.88651 1.88624 1.88668 1.88860 295.700 297.011 301.423 301.839 301.496 301.240 303.116 302.670 303.989 307.488 309.630 310.527 310.628 311.665 311.048 310.520 309.625 309.318 308.361 307.731 308.286 309.667 309.914 310.150 310.348 310.134 310.763 311.064 311.532 311.656 312.120 312.535 312.678 312.530 312.182 Monthly averages 164.519 164.235 169.269 166.666 162.790 161.907 161.013 160.739 161.759 162.012 161.177 159.880 159.108 6.57322 6.57441 6.56230 6.50276 6.58113 6.54543 6.49970 6.48015 6.49821 6.53262 6.46937 6.47662 6.46514 Daily rates: 01-96 159.337 158.999 158.917 158.958 158.542 158.581 158.589 158.499 158.507 158.620 159.081 159.133 159.273 159.358 159.298 159.120 159.152 159.229 160.100 160.084 159.755 159.232 6.44240 6.44519 6.44782 6.45694 6.46731 6.46455 6.45939 6.46854 6.46221 6.46073 6.45843 6.46133 6.46006 6.45795 6.45551 6.46528 6.47159 6.48354 6.48292 6.48988 6.48439 6.48722 0.796967 0.805134 0.823971 0.823342 0.815580 0.816283 0.819810 0.812657 0.810529 0.819444 0.823729 0.819635 0.815783 0.821702 0.818865 0.816441 0.817928 0.818238 0.817375 0.820580 0.821949 0.817457 0.816181 0.812618 0.813627 0.814736 0.815164 0.813216 0.814796 0.813609 0.812566 0.811954 0.812670 0.813699 0.811860 1999.01 2037.76 2226.35 2296.16 2182.77 2182.78 2164.71 2094.58 2081.52 2122.95 2109.81 2079.58 2045.84 2061.30 2059.96 2058.56 2064.93 2068.64 2058.14 2059.65 2058.14 2057.14 2053.02 2046.92 2043.43 2029.93 2028.64 2030.96 2045.41 2022.82 2038.13 2036.67 2031.19 2028.54 2026.42 2.13128 2.11882 2.07746 2.07414 2.08265 2.08675 2.09247 2.11006 2.11072 2.09482 2.10063 2.10468 2.11373 2.11106 2.11308 2.11524 2.11208 2.11041 2.11350 2.11181 2.10930 2.11304 2.11371 2.11646 2.11584 2.11699 2.11611 2.11695 2.11298 2.11652 2.11304 2.11301 2.11256 2.11323 2.11520 13.3768 13.3019 13.0411 13.0345 13.0835 13.1113 13.1368 13.2500 13.2540 13.1617 13.1978 13.2259 13.2741 13.2643 13.2772 13.2894 13.2670 13.2595 13.2738 13.2607 13.2467 13.2664 13.2727 13.2903 13.2844 13.2918 13.2886 13.2927 13.2685 13.2915 13.2687 13.2653 13.2644 13.2658 13.2797TABLE V
ECU EXCHANGE RATES
l=M
eurostat 1985 1986 1987 1988 1989 1990 1991 1992 1993 1994 1995* 95/01 95/02 95/03 95/04 95/05 95/06 95/07 95/08 95/09 95/10 95/11 95/12 96/01 02/01 03/01 04/01 05/01 08/01 09/01 10/01 11/01 12/01 15/01 16/01 17/01 18/01 19/01 22/01 23/01 24/01 25/01 26/01 29/01 30/01 31/01 ESC 130.251 147.088 162.616 170.059 173.413 181.109 178.614 174.714 188.370 196.896 196.105 196.125 195.479 194.969 195.756 195.945 196.438 196.275 195.311 196.348 196.930 196.722 197.087 195.831 196.283 196.359 196.335 196.206 195.925 195.641 195.485 195.539 195.694 195.532 195.426 195.371 195.506 195.602 195.523 195.603 195.749 195.957 196.353 196.354 196.093 195.738 FMK 4.69423 4.97974 5.06517 4.94362 4.72301 4.85496 5.00211 5.80703 6.69628 6.19077 5.70855 5.87763 5.84173 5.77063 5.73180 5.70542 5.72138 5.70975 5.60976 5.63422 5.64122 5.61417 5.65231 5.73832 5.70257 5.68331 5.68837 5.69119 5.71350 5.70651 5.70339 5.70360 5.70387 5.70863 5.71417 5.72689 5.74942 5.73884 5.76943 5.79001 5.79023 5.80688 5.81293 5.78143 5.78188 5.77599 SKR 6.52133 6.99567 7.31001 7.24192 7.09939 7.52051 7.47926 7.53295 9.12151 9.16307 9.33192 9.26782 9.29914 9.58022 9.85460 9.64488 9.66368 9.65233 9.43043 9.20062 9.03011 8.73139 8.64892 8.69018 8.69668 8.65465 8.63555 8.63690 8.68250 8.63930 8.62007 8.61405 8.61819 8.59363 8.59525 8.60003 8.61512 8.57816 8.69181 8.77527 8.73938 8.83875 8.82154 8.90302 8.83052 8.80357UKL IKR NKR
Yearly averages 0.588977 0.671543 0.704571 0.664434 0.673302 0.713851 0.701012 0.737650 0.779988 0.775902 0.828789 31.6485 40.3813 44.5548 50.7794 62.8909 74.0013 73.0052 74.6584 79.2528 83.1063 84.6853 6.51104 7.27750 7.76498 7.70054 7.60381 7.94851 8.01701 8.04177 8.30954 8.37420 8.28575 Monthly averages 0.788296 0.800817 0.823015 0.833905 0.832289 0.834752 0.843181 0.831674 0.827505 0.837881 0.846948 0.847268 0.844058 0.848804 0.844929 0.840765 0.843949 0.844401 0.843020 0.847326 0.849956 0.845084 0.844583 0.840755 0.842163 0.843978 0.845573 0.843805 0.845247 0.843239 0.842568 0.842018 0.842154 0.843889 0.841078 84.2156 83.7854 84.5575 84.5598 84.3606 84.2999 84.7263 84.6393 84.6669 85.4491 85.5991 85.3226 85.3993 Daily rates: 01-96 85.9470 85.6430 85.5798 85.7830 85.7287 85.5977 85.7670 85.8886 85.5841 85.6164 85.4598 85.3931 85.2380 85.2181 85.1374 85.1540 84.9404 85.2119 85.0050 84.9124 84.9735 85.0058 8.31546 8.29931 8.26319 8.31644 8.31414 8.29839 8.30090 8.26733 8.25104 8.24762 8.27314 8.29254 8.28739 8.31866 8.31383 8.32199 8.31281 8.31287 8.30317 8.29147 8.29167 8.28366 8.27700 8.28406 8.28223 8.28135 8.28039 8.27824 8.27602 8.27158 8.27391 8.26448 8.26669 8.27016 8.26625 SFR 1.85572 1.76086 1.71780 1.72822 1.80010 1.76218 1.77245 1.81776 1.73019 1.62128 1.54574 1.59827 1.59976 1.54349 1.52628 1.54276 1.54164 1.55475 1.55971 1.53324 1.51443 1.51288 1.51830 1.52352 1.51458 1.52009 1.52385 1.52105 1.52281 1.52600 1.52339 1.51794 1.52073 1.52000 1.52015 1.52351 1.52726 1.52442 1.52175 1.51759 1.51932 1.51664 1.52372 1.53695 1.53536 1.54039 USD 0.76309 0.98417 1.15444 1.18248 1.10175 1.27343 1.23916 1.29810 1.17100 1.18952 1.30801 1.24081 1.25869 1.31706 1.34143 1.32164 1.33144 1.34481 1.30441 1.28880 1.32217 1.32381 1.30430 1.29184 1.31760 1.31133 1.30377 1.30787 1.30984 1.30584 1.31022 1.31208 1.30523 1.30573 1.29661 1.29188 1.28622 1.28070 1.27642 1.28013 1.27118 1.27792 1.26892 1.26508 1.26921 1.26666 YEN 180.559 164.997 166.598 151.459 151.938 183.660 166.493 164.223 130.147 121.322 123.012 123.743 123.637 119.299 112.500 112.249 112.592 117.308 123.325 129.421 133.184 134.826 132.763 136.444 136.635 137.034 138.161 137.261 138.122 137.439 137.180 137.283 137.598 137.062 137.221 136.293 135.414 134.986 135.275 135.156 135.788 136.482 135.039 134.769 135.958 135.622
TABLE VI
CENTRAL RATES AND INTERVENTION LIMIT RATES, IN FORCE SINCE 6TH MARCH 1995, FOR THE CURRENCIES OF COUNTRIES PARTICIPATING IN THE EMS EXCHANGE RATE MECHANISM.
I=W
eurostat
BLF
DKR
DM
PTA
FF
IRL
HFL
ÖS
ESC
DR
LIT
UKL
1 ECU =
39.3960
7.28580
1.91007
162.493
6.40608
0.792214
2.15214
13.4383
195.792
292.867
(notional) 2106.15
(notional) 0.786652
(notional) +
= + = + = + = + = + = + = + = + =
100 BLF=
21.4747
18.4938 15.9266
5.63000 4.84837
4.17500 478.944
412.461
355.206 18.8800
16.2608
14.0050 2.33503
2.01090 1.73176
6.34340 5.46286
4.70454
39.6089 34.1107
29.3757
577.090 496.984
- 428.000
1 The th
se sellin
100 DKR =
627.880
540.723 465.665
30.4450 26.2162
22.5750 2589.80
2230.27
1920.70 102.100
87.9257
75.7200 12.6261
10.8734 9.36403
34.3002 29.5389
25.4385 214.174
184.444
158.841
3120.50 2687.31
2314.30
se buying ane
s German ane
ling rate Fl. 1 g rate DM 10C
100 DM =
2395.20
2062.55 1776.20 442.968
381.443 328.461
9878.50
8507.18
7326.00 389.480
335.386
288.810 48.1696
41.4757 35.7143
130.834 1 112.673
97.0325 1 816.927
703.550
605.877
11903.3 10250.5
8827.70
selling rate I the Dutch r
DO in Frankfi in Amsterd.
100 PTA =
28.1525 24.2447
20.8795 5.20640
4.48376 3.86140
1.36500 1.17548
1.01230 4.57780
3.94237
3.39510 0.566120
0.487537 0.419859
1.53793 1.32445
1.14060
9.60338
8.27008 7.12200
139.920 120.493
103.770
100 FF =
714.030 614.977
529.660 132.066
113.732 97.9430
34.6250 29.8164
25.6750 2945.40
2536.54
2184.40 14.3599
12.3666
10.6500 39.0091
33.5953 28.9381
243.586
209.773 180.654
3549.00 3056.35
2632.10
s will not be operational,
nonetary authorities, the rt: DM 90.7700; buying r
)m: Fl. 115.235; buying r
1 IRL =
57.7445
49.7289 42.8260 10.6792
9.19676 7.92014
2.80000 2.41105
2.07600 238.175
205.113
176.641 9.38950
8.08631
6.96400 3.15450 2.71662
2.33952
19.6971
16.9629 14.6082
286.983 247.145
212.838
100 HFL =
2125.60
1830.54 1576.45 393.105
338.537 291.544
103.058 1 88.7526
76.4326 1 8767.30
7550.30
6502.20 345.650
297.661
256.350 42.7439
36.8105
31.7007 725.065
624.417 537.740
10564.0 9097.55
7834.70
100 ÖS =
340.420
293.163 252.470
62.9561 54.2170 46.6910
16.5050
14.2136 12.2410
1404.10 1209.18
1041.30 55.3545
47.6706
41.0533 6.84544
5.89521
5.07688 18.5963
16.0149 13.7918
1691.80
1456.97 1254.70
Reflecting a bilateral agreement betwee
Following rates will continue to apply: ate Fl. 100 in
äteDMIOOii
Frankfurt: DM 86.7800;
ι Amsterdam: Fl. 110.167Í
100 ESC =
23.3645 20.1214
17.3285 4.32100 3.72119
3.20460 1.13280
0.975561
0.840100 96.3670
82.9927 71.4690
3.79920
3.27188
2.81770 0.469841
0.404620 0.348453
1.27637 1.09920
0.946611
7.97000
6.86356 5.91086
n
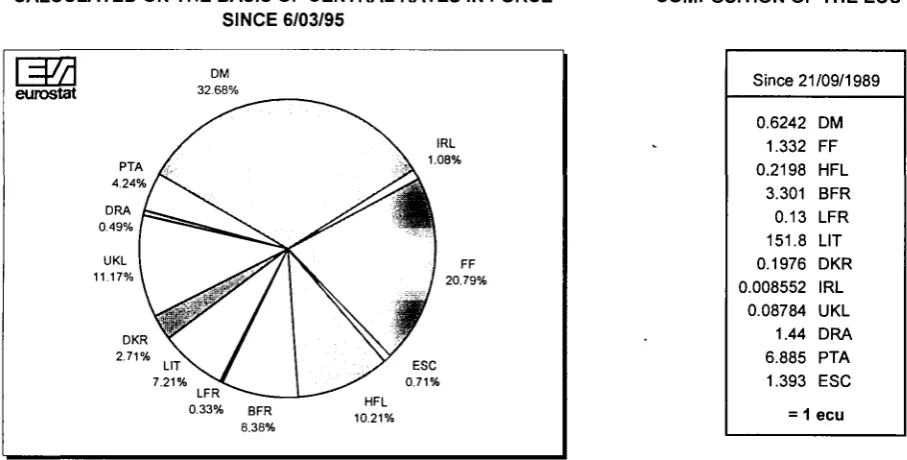
WEIGHTS OF COMPONENT CURRENCIES IN THE ECU, CALCULATED ON THE BASIS OF CENTRAL RATES IN FORCE
SINCE 6/03/95
COMPOSITION OF THE ECU BASKET
eurostat
DM 32.68%
PTA A¿¡¡¡
4 . 2 4 % / ^ ®
DRA fcs^ ^ S . 0.49% / ^ " ' ^ ' a e ^ ^ ^ ^ P
UKL I ^ ^ V r V
11.17% \ ^téå' / I ·?
DKR V ^ / I
2.71% LIT N . \ / /
7.21% ^ - C ^
LFR LiS 0.33% BFR
8.38%
N. IRL
H k
1·
0 8 %Ml FF
H f 20.79%
H r ESC
■j^s' 0.71% HFL 10.21%
Since 21/09/1989
0.6242 1.332 0.2198 3.301 0.13 151.8 0.1976 0.008552 0.08784 1.44 6.885 1.393
= 1 DM FF HFL BFR LFR LIT DKR IRL UKL DRA PTA ESC
ecu
[image:10.595.49.503.552.782.2]TABLE VII
OPERATION RATES OF THE EMI (CALCULATION MONTH, APPLICABLE THE FOLLOWING MONTH) AND
INTEREST RATES AND YIELDS OF ECU INVESTMENTS (%)
1=441
eurostat 1991 1992 1993 1994 1995 1994 9 10 11 12 1995 1 2 3 4 5 6 7 8 9 10 11 12 1996 1 EMI* 10.06 10.29 7.88 5.88 5.88 5.75 5.75 5.75 5.75 6.00 6.00 6.00 6.50 6.25 6.00 6.00 5.75 5.50 5.50 5.75 5.25 5.25Deposits (maturity in months) 1 9.73 10.43 8.27 5.95 5.85 5.59 5.56 5.55 5.98 5.79 5.82 6.70 6.16 6.13 6.08 5.96 5.73 5.47 5.66 5.43 5.31 4.83 3 9.80 10.41 7.99 5.98 5.90 5.81 5.89 5.81 6.16 6.12 6.00 6.75 6.27 6.16 6.08 5.96 5.73 5.47 5.66 5.42 5.22 4.75 6 9.84 10.27 7.65 6.05 5.98 6.16 6.12 6.03 6.40 6.48 6.34 6.84 6.37 6.23 6.10 5.99 5.75 5.47 5.66 5.41 5.16 4.70 12 9.83 10.01 7.11 6.21 6.15 6.77 6.74 6.53 6.86 7.03 6.86 7.09 6.63 6.38 6.20 6.12 5.83 5.52 5.67 5.40 5.12 4.68 1 7.303 6.340 6.228 6.968 6.904 6.679 6.941 7.118 6.926 7.226 6.843 6.518 6.274 6.178 5.893 5.592 5.657 5.386 5.122 4.690 2 6.887 6.758 6.656 7.642 7.593 7.394 7.555 7.743 7.540 7.688 7.240 6.882 6.658 6.596 6.310 5.974 6.050 5.762 5.426 4.947
Yield on ecu bonds (maturity in years) 3 6.750 6.988 6.990 8.001 7.975 7.819 7.882 8.077 7.884 7.968 7.538 7.170 6.970 6.928 6.656 6.347 6.447 6.127 5.764 5.294 4 6.793 7.115 7.250 8.170 8.168 8.056 8.037 8.237 8.059 8.131 7.758 7.392 7.218 7.194 6.939 6.691 6.818 6.463 6.098 5.666 5 6.919 7.222 7.457 8.273 8.288 8.207 8.138 8.340 8.165 8.243 7.921 7.559 7.408 7.413 7.170 6.986 7.134 6.754 6.392 6.000 6 7.045 7.369 7.627 8.407 8.428 8.352 8.269 8.473 8.280 8.353 8.045 7.678 7.547 7.598 7.356 7.219 7.373 6.986 6.619 6.251 7 7.147 7.527 7.759 8.548 8.566 8.479 8.404 8.607 8.387 8.448 8.132 7.763 7.647 7.739 7.498 7.391 7.542 7.160 6.788 6.436 8 7.213 7.644 7.845 8.646 8.652 8.554 8.483 8.683 8.443 8.499 8.182 7.827 7.719 7.821 7.594 7.511 7.656 7.285 6.919 6.587 9 7.233 7.667 7.880 8.648 8.640 8.545 8.449 8.642 8.409 8.478 8.194 7.881 7.772 7.826 7.645 7.588 7.730 7.367 7.030 6.738 10 7.196 7.545 7.858 8.502 8.480 8.416 8.244 8.427 8.241 8.355 8.168 7.938 7.820 7.739 7.648 7.630 7.777 7.413 7.142 6.924
(*) See explanatory notes
DAILY RATES
=M
eurostat 2.01.96 3.01.96 4.01.96 5.01.96 8.01.96 9.01.96 10.01.96 11.01.96 12.01.96 15.01.96 16.01.96 17.01.96 18.01.96 19.01.96 22.01.96 23.01.96 24.01.96 25.01.96 26.01.96 29.01.96 30.01.96 31.01.96Deposits (maturity in months)
1 5.06 4.99 4.96 4.97 5.00 4.94 4.94 4.93 4.91 4.89 4.86 4.81 4.75 4.69 4.69 4.75 4.68 4.69 4.75 4.75 4.72 4.63 3 5.00 4.94 4.91 4.92 4.94 4.91 4.85 4.83 4.82 4.81 4.75 4.72 4.63 4.59 4.59 4.66 4.60 4.62 4.68 4.69 4.63 4.52 6 4.94 4.89 4.88 4.88 4.91 4.88 4.81 4.81 4.80 4.75 4.70 4.63 4.56 4.54 4.54 4.61 4.51 4.56 4.63 4.63 4.57 4.47 12 4.94 4.88 4.88 4.88 4.88 4.88 4.78 4.77 4.76 4.75 4.67 4.57 4.55 4.50 4.50 4.56 4.50 4.52 4.56 4.59 4.55 4.44 1 4.906 4.936 4.947 4.922 4.913 4.853 4.820 4.828 4.753 4.700 4.632 4.623 4.521 4.499 4.464 4.536 4.493 4.509 4.599 4.638 4.572 4.519 2 5.210 5.180 5.156 5.171 5.186 5.129 5.102 5.103 5.048 4.986 4.858 4.832 4.774 4.725 4.722 4.777 4.716 4.730 4.831 4.910 4.876 4.824
Yield on ecu bonds (maturity in years)
TABLE VIII
CENTRAL BANK INTEREST RATES
eurostat
01/95 02/95 03/95 04/95 05/95 06/95 07/95 08/95 09/95 10/95 11/95 12/95 01/96
01.12.95 04.12.95 05.12.95 06.12.95 07.12.95 08.12.95 11.12.95 12.12.95 13.12.95 14.12.95 15.12.95 18.12.95 19.12.95 20.12.95 21.12.95 22.12.95 25.12.95 26.12.95 27.12.95 28.12.95 29.12.95 01.01.96 02.01.96 03.01.96 04.01.96 05.01.96 08.01.96 09.01.96 10.01.96 11.01.96 12.01.96 15.01.96 16.01.96 17.01.96 18.01.96 19.01.96 22.01.96 23.01.96 24.01.96 25.01.96 26.01.96 29.01.96 30.01.96 31.01.96
Β DR
4.50 4.50 4.00 4.00 4.00 4.00 4.00 3.50 3.50 3.50 3.50 3.00 3.00
3.00
AUCT 4.85 4.85 5.85 4.75 4.50 4.50 4.50 4.40 4.10 4.05 3.95 3.75 3.55
3.75
3.70
3.65
3.55 AR 6.35 6.35 7.25 6.25 6.00 5.75 5.75 5.55 5.35 5.30 5.20 5.00 4.65
5.00
4.95
4.90
4.80
4.65 CR 4.85 4.85 5.25 4.75 4.50 4.50 4.50 4.30 4.10 4.05 3.95 3.75 3.40
3.75
3.70
3.65
3.55
3.40
DK DR 5.00 5.00 6.00 6.00 6.00 6.00 5.75 5.00 5.00 5.00 4.75 4.25 4.00
REPO 5.50 5.50 7.00 6.50 6.35 6.35 6.05 5.65 5.40 5.30 5.00 4.60 4.35
CD
D
DR LR REPO 3D TB RATES AT THE END OF:
5.50 5.50 7.00 6.50 6.35 6.35 6.05 5.65 5.40 5.30 5.00 4.60 4.35
4.50 4.50 4.00 4.00 4.00 4.00 4.00 3.50 3.50 3.50 3.50 3.00 3.00
6.00 6.00 6.00 6.00 6.00 6.00 6.00 5.50 5.50 5.50 5.50 5.00 5.00 RECENT ACTUAL CHANGES
4.25
4.00 4.75
4.60
4.50
4.35 4.75
4.60
4.50
4.35
3.00 5.00 4.85 4.85 4.85 4.51 4.51 4.50 4.50 4.39 4.08 4.03 3.98 3.75 3.40
3.75
3.73
3.65
3.55
3.40 4.50 4.50 4.50 4.50 4.50 4.50 4.50 4.50 4.50 4.50 4.50 4.50 4.50
,
GR DR 20.50 20.50 20.50 20.50 20.50 20.50 19.50 18.50 18.50 18.50 18.50 18.00 18.00
18.00 LR 24.00 24.00 24.00 24.00 24.00 24.00 23.00 22.00 22.00 22.00 22.00 21.50 21.50
21.50 OR 30.00 30.00 28.00 28.00 28.00 28.00 27.00 27.00 27.00 27.00 27.00 27.00 27.00
E REPO
8.00 8.00 8.50 8.50 8.50 9.25 9.25 9.25 9.25 9.25 9.25 9.00 8.75
9.00
8.75 AR 8.05 8.05 8.55 8.55 8.55 9.30 9.30 9.30 9.30 9.30 9.30 9.05 8.80
9.05
8.80
01/95 02/95 03/95 04/95 05/95 06/95 07/95 08/95 09/95 10/95 11/95 12/95 01/96
01.12.95 04.12.95 05.12.95 06.12.95 07.12.95 08.12.95 11.12.95 12.12.95 13.12.95 14.12.95 15.12.95 18.12.95 19.12.95 20.12.95 21.12.95 22.12.95 25.12.95 26.12.95 27.12.95 28.12.95 29.12.95 D1.01.96 32.01.96 33.01.96 34.01.96 35.01.96 38.01.96 39.01.96 10.01.96 11.01.96 12.01.96 15.01.96 16.01.96 17.01.96 18.01.96 19.01.96 22.01.96 23.01.96 24.01.96 25.01.96 26.01.96 29.01.96 30.01.96 31.01.96
Please see explanatory notes at the end of the publication for the key to the various rates. Data series with the same abbreviation are not necessarily internationally comparable.
TABLE VIII
CENTRAL BANK INTEREST RATES
l=M
eurostat
01/95 02/95 03/95 04/95 05/95 06/95 07/95 08/95 09/95 10/95 11/95 12/95 01/96
01.12.95 04.12.95 05.12.95 06.12.95 07.12.95 08.12.95 11.12.95 12.12.95 13.12.95 14.12.95 15.12.95 18.12.95 19.12.95 20.12.95 21.12.95 22.12.95 25.12.95 26.12.95 27.12.95 28.12.95 29.12.95 01.01.96 02.01.96 03.01.96 04.01.96 05.01.96 08.01.96 09.01.96 10.01.96 11.01.96 12.01.96 15.01.96 16.01.96 17.01.96 18.01.96 19.01.96 22.01.96 23.01.96 24.01.96 25.01.96 26.01.96 29.01.96 30.01.96 31.01.96
F AUCT
5.00 5.00 5.00 5.00 5.00 5.00 5.00 5.00 5.00 5.00 4.80 4.45 4.20
4.70
4.45
4.20
REPO
6.40 6.40 susp susp susp 7.50 7.00 6.15 6.15 susp 6.10 5.85 5.60
5.85
5.60
IRL STF
6.25 6.25 7.25 7.25 7.25 7.25 7.25 7.00 7.00 7.00 7.00 6.50 6.50
6.50
I
DR
7.50 8.25 8.25 8.25 9.00 9.00 9.00 9.00 9.00 9.00 9.00 9.00 9.00
LR
8.50 10.00 10.00 10.00 10.50 10.50 10.50 10.50 10.50 10.50 10.50 10.50 10.50
REPO
8.45 8.85 10.35 10.49 10.40 10.55 10.30 10.02 10.29 10.77 10.52 10.50 9.88
10.51
10.57
10.67
10.68 10.50
10.48
10.08 9.96 9.94
9.88
NL SPR AR
A DR LR REPO RATES AT THE END OF:
4.80 4.80 4.50 4.40 4.20 4.10 4.10 3.90 3.80 3.70 3.60 3.40 3.20
4.50 4.50 4.00 4.00 4.00 3.75 3.75 3.50 3.50 3.50 3.25 2.75 2.75
4.50 4.50 4.00 4.00 4.00 4.00 4.00 3.50 3.50 3.50 3.50 3.00 3.00
5.50 5.50 5.25 5.25 5.25 5.25 5.25 5.25 5.25 5.25 5.25 5.25 5.25
4.70 4.70 4.45 4.45 4.45 4.45 4.45 4.35 4.05 4.05 4.05 3.75 3.65
RECENT ACTUAL CHANGES
3.40
3.30
3.20
2.75 3.00
3.95
3.75
3.65
Ρ PRR
8.875 8.877 10.112 9.009 8.996 8.912 8.883 8.750 8.750 8.750 8.750 8.500 8.250
8.500
8.491
8.325
8.250
SFR
11.50 11.50 11.50 11.50 11.50 11.50 11.50 11.00 11.00 11.00 11.00 10.50 10.50
10.50
DRR
8.50 8.50 8.50 8.50 8.50 8.50 8.50 8.25 8.25 8.25 8.25 7.75 7.75
7.75
DRO
8.500 8.500 8.500 8.500 8.500 8.500 8.500 8.250 8.250 8.250 8.250 7.750 7.750
7.750
PRO
8.875 8.877 9.000 9.031 8.875 8.941 8.887 8.750 8.750 8.750 8.750 8.501 8.250
8.754 8.750
8.708 8.505 8.500
8.503 8.500 8.501
8.500
8.375
8.250
8.250 01/95 02/95 03/95 04/95 05/95 06/95 07/95 08/95 09/95 10/95 11/95 12/95 01/96
01.12.95 04.12.95 05.12.95 06.12.95 07.12.95 08.12.95 11.12.95 12.12.95 13.12.95 14.12.95 15.12.95 18.12.95 19.12.95 20.12.95 21.12.95 22.12.95 25.12.95 26.12.95 27.12.95 28.12.95 29.12.95 01.01.96 02.01.96 03.01.96 04.01.96 05.01.96 08.01.96 09.01.96 10.01.96 11.01.96 12.01.96 15.01.96 16.01.96 17.01.96 18.01.96 19.01.96 22.01.96 23.01.96 24.01.96 25.01.96 26.01.96 29.01.96 30.01.96 31.01.96
Please see explanatory notes at the end of the publication for the key to the various rates. Data series with the same abbreviation are not necessarily internationally comparable.
TABLE VIII
CENTRAL BANK INTEREST RATES
eurostat
01/95 02/95 03/95 04/95 05/95 06/95 07/95 08/95 09/95 10/95 11/95 12/95 01/96
01.12.95 04.12.95 05.12.95 06.12.95 07.12.95 08.12.95 11.12.95 12.12.95 13.12.95 14.12.95 15.12.95 18.12.95 19.12.95 20.12.95 21.12.95 22.12.95 25.12.95 26.12.95 27.12.95 28.12.95 29.12.95 01.01.96 02.01.96 03.01.96 04.01.96 05.01.96 08.01.96 09.01.96 10.01.96 11.01.96 12.01.96 15.01.96 16.01.96 17.01.96 18.01.96 19.01.96 22.01.96 23.01.96 24.01.96 25.01.96 26.01.96 29.01.96 30.01.96 31.01.96
FIN BR
5.25 5.25 5.25 5.25 5.25 5.25 5.25 5.25 5.25 5.25 5.00 4.75 4.75
4.75 TR
5.50 5.75 5.75 5.75 5.75 6.00 6.00 6.00 6.00 5.50 4.75 4.25 4.25
4.25 AR
7.50 7.75 7.75 7.75 7.75 8.00 8.00 8.00 8.00 7.50 6.75 6.75 6.25
6.75
S DR
7.00 7.00 7.00 7.00 7.00 7.00 7.50 7.50 7.50 7.00 7.00 7.00 6.00
6.00 AR
8.00 8.50 8.50 9.00 9.00 9.00 9.50 9.50 9.50 9.50 9.50 9.50 9.50
REPO
7.60 7.83 8.20 8.41 8.41 8.66 8.91 8.91 8.91 8.91 8.91 8.91 8.45
8.66
8.45 IBR
UK BR
IS DR REPO RATES AT THE END OF: 10.55
10.30 10.75 10.85 10.85 10.40 10.60 10.30 9.55 9.65 9.40 9.40 8.40
6.25 6.75 6.75 6.75 6.75 6.75 6.75 6.75 6.75 6.75 6.75 6.50 6.25
5.50 5.50 6.40 6.40 6.40 6.40 6.10 6.10 5.60 5.60 5.60 5.60 5.60
6.30 6.70 7.30 7.30 7.30 7.30 7.00 7.00 6.50 6.50 6.50 6.50 6.50 RECENT ACTUAL CHANGES
8.40
6.50
6.25
CD
4.90 4.90 4.90 4.90 4.90 4.90 4.90 4.90 4.40 4.40 4.40 4.40 4.40
N AR
6.75 6.75 6.75 6.75 6.75 6.75 6.75 6.75 6.75 6.75 6.75 6.75 6.75
CH DR
3.50 3.50 3.00 3.00 3.00 3.00 2.50 2.50 2.00 2.00 2.00 1.50 1.50
1.50 LR
5.630 5.500 5.625 5.500 5.250 5.630 4.750 5.125 4.625 4.250 4.375 5.375 3.875
4.250 4.125 4.375 4.625
4.250
4.125 3.750 3.250 3.375 3.750 3.875
5.375
3.875
4.000
3.875 3.625 3.500 3.625
3.500
3.750
3.875
3.625
3.875 US DR
4.75 5.25 5.25 5.25 5.25 5.25 5.25 5.25 5.25 5.25 5.25 5.25 5.00
5.00 JAP
DR
1.75 1.75 1.75 1.00 1.00 1.00 1.00 1.00 0.50 0.50 0.50 0.50 0.50
01/95 02/95 03/95 04/95 05/95 06/95 07/95 08/95 09/95 10/95 11/95 12/95 01/96
01.12.95 04.12.95 05.12.95 06.12.95 07.12.95 08.12.95 11.12.95 12.12.95 13.12.95 14.12.95 15.12.95 18.12.95 19.12.95 20.12.95 21.12.95 22.12.95 25.12.95 26.12.95 27.12.95 28.12.95 29.12.95 01.01.96 02.01.96 03.01.96 04.01.96 05.01.96 08.01.96 09.01.96 10.01.96 11.01.96 12.01.96 15.01.96 16.01.96 17.01.96 18.01.96 19.01.96 22.01.96 23.01.96 24.01.96 25.01.96 26.01.96 29.01.96 30.01.96 31.01.96
Please see explanatory notes at the end of the publication for the key to the various rates. Data series with the same abbreviation are not necessarily internationally comparable.
EVOLUTION OF CENTRAL BANK INTEREST RATES OVER THE LAST 12 MONTHS
eurostat
10 τ •DR
■CR
1.2.95 5.6.95 4.10.95 31.1.96 1.2.95 5.6.95 4.10.95 31.1.96
10 χ
a
■DR •LR •RepoΖ * * * — .
40
35
30
25
20
■DR •LR ■OR
15
1.2.95 5.6.95 4.10.95 31.1.96 1.2.95 5.6.95 4.10.95 31.1.96
10
a
a
Repo AR
I
Λ 10
1
1.2.95 5.6.95 4.10.95 31.1.96
a
1 1.2.95
■Auct "Repo
5.6.95 4.10.95 31.1.96
10
1 1.2.95
Θ
J
--\
13
10
7
4
1
Q
■DR "Repo ■LR
5-6.95 4.10.95 31.1.96 1 2. 9 5 5.6.95 4.10.95 31.1.96
10
7
-•SPR ■AR
1 1.2.95
10
1
a
■DR■LR ■Repo
5.6.95 4.10.95 31.1.96 1.2.95 5.6.95 4.10.95 31.1.96
EVOLUTION OF CENTRAL BANK INTEREST RATES OVER THE LAST 12 MONTHS
sa
eurostat16
14
12
10
8
6
4 1.2
a
JV
■DRO ■PRO
10
f
BR ■TR
95 5.6.95 4.10.95 31.1.96 1·2·9 5 5.6.95 4.10.95 31.1.96
10
a
■AR ■Repo
10
4
1.2.95 5.6.95 4.10.95 31.1.96
1 1.2.95
■BR
5.6.95 4.10.95 31.1.96
10
1
■Repo
10 τ
1
a
■AR1.2.95 5.6.95 4.10.95 31.1.96 1·2·9 5 5.6.95 4.10.95 31.1.96
10
1
l«|
1
DR — LR
"*—NA,
f
/
^X^VVΛ
v
IL^
>
y ,10
1
■DR
1.2.95 5.6.95 4.10.95 31.1.96 1.2.95 5.6.95 4.10.95 31.1.96
10 τ
8
6
4
2 i
[JAP)
•DR
1.2.95 5.6.95 4.10.95 31.1.96
Explanatory notes
EXPLANATORY NOTES
ECU bond issues (Tables I & II)
In table I, issues are recorded as at the payment date. This bulletin covers ECU Issues in the Eurobond market, which includes international and foreign issues and domestic issues which can be assimilated with Eurobond issues. More specifically, the domestic issues should be free of withholding tax in the hands of non-residents and subject to similar clearing and settlement procedures. This includes ECU issues offering the option of conversion into other currencies. Main source: International Financing Review. Table I shows, under the headings:
- Business sector and Governments: national Issuers, both private and public.
- Institutions: the European Investment Bank and the Commission of the European Communities (EEC, ECSC, Euratom).
- Organizations: the specialist institutions of the United Nations, the World Bank, the Council of Europe, etc... . Table II shows detailed Information on the latest known issues, irrespective of the payment date.
Consumer price indices in national currency (Table III)
The consumer price indices in the national currency of each country measure changes in the purchasing power of one unit of national currency spent In the country concerned. Two composite indices are calculated, covering all the member states of the Community (EUR 15) and the 10 member states with currencies participating in the European Monetary System exchange rate mechanism (ERM). (Although the peseta has been participating in the exchange rate mechanism since 19/06/89 and has been included in the calculation of the ECU since 21/09/89, it is only taken into account In the Indices relating to the ERM which are included In this bulletin for data after 30/09/89.) These Indices are calculated as weighted arithmetic means (chain Indices) of the national indices, the weighting for each member state being Its relative share in the final consumption of households of the group of countries in question (EUR 15, ERM), expressed in purchasing power standards, at current prices and purchasing power parities.
Consumer price indices in ECUs (Table IV)
For each country the index of consumer prices in ECUs is calculated by multiplying the national consumer price index by the average movement of the national currency In relation to the ECU during the month. It measures the change in the purchasing power of one ECU in the country concerned.
Three composite Indices are calculated, the first covering all the member states of the Community (EUR 15), the second covering 10 member states participating in the European Monetary System exchange rate mechanism (ERM), and the third covering the 12 member countries whose currencies go to make up the ECU. (Although the peseta has been participating in the exchange rate mechanism since 19/06/89 and has been included in the calculation of the ECU since 21/09/89, it is only taken into account in the indices relating to the ERM which are included In this bulletin for data after 30/09/89).
These three indices are calculated as weighted arithmetic means (chain indices). The weightings are defined as follows: for the EUR 15 and ERM indices, the relative share of each member state in the final consumption of households for the group of countries in question (EUR 15 or ERM), expressed in ECUs at current prices and exchange rates (annual weighting). For the ECU index, the relative share of each member state's currency in the calculation of the ECU (monthly weighting).
ECU exchange rates (Table V)
The exchange rates for the ECU against the national currencies of the member states of the Community, the USD and yen are shown as annual averages, monthly averages (for the current year), and daily rates (for the latest available month).
Bilateral currency fluctuations (graph 1 on page 4)
The daily market exchange rates of all currencies are compared with the relevant bilateral central rates and the differentials between the two calculated.
The graph is divided symmetrically by a horizontal axis along which the points would be plotted if all currencies were at their bilateral central rate and there were therefore no fluctuations.
The curves are drawn by linking the daily points showing the relative positions of each currency. These should be compared in pairs. To find the differential between two currencies, subtract the (positive or negative) values along the y-axis corresponding to each currency.
The graph is drawn with the curve of the stronger currency above that of the weaker. It shows therefore the relative position of each currency vis-à-vis the other currencies. When two curves intersect or merge over a period of time there is no differential between the two currencies and their market exchange rate equals their bilateral central rate. The maximum fluctuation between two currencies is shown within the band, symmetrical with the horizontal axis. The fluctuations of the other currencies in relation to either of the two currencies in question are shown within the maximum permissible fluctuation.
ECU-EMS Information
The divergence indicator (graph 2 on page 4)
The divergence indicator (DI) measures the degree of movement of a specific EMS currency against its maximum divergence spread. In effect, the DI is a mechanism which detects the EMS currencies that deviate upwards or downwards from the Community average as represented by the ECU.
For a given currency the divergence indicator is obtained: (i) first by calculating the appreciation or depreciation of
the market rate of the ECU In terms of that currency against its ECU-related central rate;
(¡I) and then by comparing the result obtained with the maximum divergence spread (MDS), which is the intervention limit, corrected by the weight of each currency in the basket in such a way that an increase in the weight of a currency reduces its maximum divergence spread.
In order to permit a comparison of movements in the divergence indicators for each of the EMS currencies, the MDS is expressed as an index number ranging between +/-100. At an absolute index number of 75, a currency reaches its divergence threshold. When a currency crosses its "threshold of divergence", this results In a presumption that the authorities concerned will correct this situation by taking adequate measures.
Exchange rate grid (Table VI)
The intervention limit rates fixed in the official grid do not always correspond exactly to + or - 15 % of the central rates, since for each currency pair (whose exchange rates are inversely proportional to one another) the lower limit of one corresponds to the upper limit of the other.
Interest rates and yields on ECU investments (Table VII)
The interest rates for 1, 3, 6 months and 1 year deposits are calculated on the basis of the London market rates LIBID as follows:
- until October 1993: source: Financial Times, Friday rate.
- from November 1993: source : Bank of England, British Banker's Association, dally rates.
The yields of ECU bonds at 1 - 1 0 years are those provided by Eurostat's yield curve. These are redemption yields. Eurostat's yield curve, which portrays the interest rate structure of maturities ranging from 1 to 10 years, Is based on highest quality Issues with a triple-Α rating of at least ECU 500 million outstanding, with a very high liquidity (bid-offer spread less than 50 basis points). The curve is calculated daily by fitting a third order polynomial function by regression to the price/yield values of bonds provided by
ISMA (International Securities Market Association, London). These values reflect the mean of bid and offer prices communicated by a comprehensive range of financial institutions. The monthly figures included in the table are the arithmetic average of daily figures and the yearly figures are the arithmetic average of daily figures.
Operation rates of the EMI (Table VII)
The interest rate for transactions of the EMI (European Monetary Institute) in ECUs is the weighted average of the most representative rates on the domestic money market of the countries whose currencies make up the ECU basket. It is based on the weighting of the currencies in the ECU basket as derived from the ECU central rates in force. The rate thus calculated for a given month applies to EMI transactions for the following month. In table VII, this rate relates to the month upon which the calculations are based and not to the (following) month during which It Is used by the EMI.
Central Bank Interest Rates in the EEA countries,
in the US, Japan and Switzerland (Table VIII)
BELGIUM
Official intervention rates:
Discount rate (DR): rate at which credit institutions can discount commercial paper at the BNB within the ceilings fixed individually according to balance sheet items.
1week credit granted by tender (AUCT): rate at which the BNB grants cash by tender to credit institutions. The duration of these loans is generally 1 week but can be longer under particular circumstances.
Advances to meet daily deficits (AR): rate at which credit institutions receive money from the BNB within quotas which vary between credit institutions according to balance sheet items and to turnover In the secondary market for government debt-securities.
Central Bank rate (CR): rate at which Primary dealers1
receive overnight money, up to a fixed maximum which is the same for each Primary dealer, from the BNB. This rate will be the next rate applied to the 1-week credit granted by tender.
DENMARK
Intervention rates:
Discount rate (DR): indicative rate which is not attached to any facility with the Danmarks Nationalbank. Within quotas based on the size of the Individual bank, deposits on banks' current account with the Danmarks Nationalbank are remunerated by the folio rate. This rate has been equal to the discount rate since the introduction of the present liquidity instruments in April 1992.
Primary dealers are market makers for government linear bonds (OLO) and Treasury certificates.
Explanatory notes
Certificates of deposit (CD): rate on 14-day certificates of deposit issued on the last banking day of each week by the Nationalbank.
Repurchase agreements (REPO): rate at which the banks have access to enter into 14-day repurchase agreements in government paper with the Nationalbank. These transactions take place on the penultimate banking day of each week, affecting bank liquidity the following day. The interest rate on repos has equalled the rate on CDs since April 1992.
GERMANY
Intervention rates:
Discount rate (DR): rate at which the Bundesbank discounts eligible trade bills within the limits of the rediscount quotas.
Lombard rate (LR): rate at which the Bundesbank grants loans to banks against certain securities. These loans have a maturity of up to 90 days and are granted against collateral of government and public sector securities.
Rate on repurchase agreements (REPO): rate applied to the Bundesbank's repurchase facility. The Bundesbank
buys bonds eligible as collateral for Lombard loans and short-term Treasury discount paper from those banks subject to minimum reserve requirements. These transactions are usually offered by fixed-rate tender or by variable-rate tender for a period of 14, 28 or 35 days.
Other rate:
3-day Treasury bills (3D TB): rate on bills that can be bought or sold by a specific list of banks. This establishes a floor for the cost of short-term money in addition to the fixed amount provided by the discount window.
GREECE
Intervention rates:
Rediscount rate (DR): rate at which the Bank of Greece rediscounts commercial bills. This facility Is subject to overall quotas which are allocated among credit institutions according to criteria relating to the size of certain balance sheet items.
Lombard rate (LR): rate at which the Bank of Greece grants liquidity to banks against collateral of government paper. As for the discount window, this facility is subject to overall quotas which are allocated among credit institutions according to criteria relating to the size of certain balance sheet items.
Rate on overdrafts on banks' current accounts with the Bank of Greece (OR): rate at which credit institutions can cover unexpected liquidity shortages by overdrawing their current accounts with the Bank of Greece.
SPAIN
Intervention rates:
Short-term credit to banks (REPO): marginal auction rate of 10-day repo purchases of Banco de Espana certificates. The Bank of Spain purchases the certificates (with a resale agreement at the maturity of the operation) from banks and savings banks according to the requirements accepted in the auction.
Rate on overnight loans granted by the Banco de España (AR): this rate is considered as being an unofficial intervention rate, but is often used by the Banco de España as an instrument of Its monetary policy. It is the rate at which the Banco de España intervenes in the money market. Market makers are asked to made bids in terms of amounts and rates, and the Bank of Spain decides at which point operations should be closed.
The rate published here is the average weighted rate resulting from the intervention.
FRANCE
Intervention rates:
Auction (AUCT): twice a week, the Central Bank invites tenders (against collateral) In order to assess credit Institutions' demand for Central Bank money. After a centralisation of the requests, the Central Bank will only allocate a proportion of them. The rate is, In practice, known in advance and is intended as a floor for money market rates.
Sales with repurchase agreements (REPO): rate at which banks get liquidity from the Central Bank against Treasury bills or commercial paper. This emergency facility carries a penality rate that Is designed as a ceiling for market rates.
IRELAND
Intervention rate:
Short-term facility rate (STF): rate at which the Central Bank grants short-term credits to banks for a period of between 1 day and 1 week.
ITALY
Intervention rates:
Discount rate (DR): rate at which the Banca d'Italia discounts commercial bills.
Fixed-maturity advances rate (LR): rate charged by the Banca d'Italia for advances with a maximum maturity of 22 days against eligible securities for special short-term needs.
ECU-EMS Information
Other rate:
Repurchase agreements (REPO): the Bank of Italy intervenes when it perceives the need to add or drain liquidity, in view of its targets in terms of money rates and sales of government securities. The repo allocation is based on variable rates. Foreign currency repos are also conducted, In addition to the securities repos.
NETHERLANDS Intervention rates:
Discount rate (DR): rate at which the Central Bank discounts Treasury paper and approved bills of exchange with a remaining maturity not exceeding 3 months. From 1 January 1994, the Central Bank no longer accepts paper for discounting and thus this rate no longer exists. Data until 12/93 are available on request from Eurostat.
Rate on special advances (SPR): rate charged by the Central Bank to financial institutions for short-term advances.
Official advance rate (AR): rate at which advances on current account against collateral are mainly granted, within a certain limit, to registered credit institutions and a number of public and semi-public financial institutions. This rate establishes a floor for money market rates.
Rate on discount of promissory notes (PRNT): rate serving as a benchmark for commercial rates. From 1 January 1994, the discount rate on promissory notes is maintained as an interest rate, given its use as a reference rate for legal purposes, but it will no longer be published. It is equal to the prevailing rate on advances plus 0.5 percentage points. Data until 12/93 are available on request from Eurostat.
AUSTRIA
Intervention rates
Discount rate (DR): rate at which the Central Bank rediscounts bills of exchange. To qualify for discounting, the paper presented must fulfil certain eligibility requirements. Refinancing ceilings for individual banks are determined on the basis of specified balance sheet items.
Lombard rate (LR): rate at which the Central Bank grants loans to banks against collateral. Since this rate is a penalty rate, It is higher than both the discount and the Gomex rate.
Gomex rate (REPO): rate applied to the Central Bank open market operations. Within each bank's refinancing quota, the Central Bank conducts open market transactions in fixed income securities issued by residents or supra-national organisations, denominated in Austrian shillings and listed on the Vienna stock exchange or in cash certificates issued by the central bank.
PORTUGAL Intervention rates:
Regular rate for liquidity provision (PR R): rate at which the Banco de Portugal supplies liquidity to the money market. The regular operations take place on the first working day of each regular maintenance period (1 week) and mature in the first working day of the subsequent period. When the regular rate for liquidity provision is suspended, the Banco de Portugal can also conduct operations at a variable rate, which take place on the first working day of the regular maintenance period. These data are not given here but are available from Eurostat.
Standing facility rate (SFR): the standing facility refers to liquidity provision operations which mature on the next working day following the day on which transaction takes place, and which take place at the pre-announced rate. The Institutions' access to this facility is limited by way of a quota, established on the beginning of each month as a percentage of the total amount of the facility (currently 100 billions of escudos).
Regular liquidity draining rate (DR R): rate at which the Banco de Portugal withdraws liquidity from the money market by selling Treasury bills with repurchase agreement or Central Banks monetary certificates. The regular operations take place on the first working day of each regular maintenance period (1 week) and mature in the first working day of the subsequent period.
Other rates:
Occasional operations of liquidity draining (DR O): the Banco de Portugal also conducts occasional operations of liquidity draining with a view to stabilising the money market.
Occasional operations of liquidity provision (PR O): the Banco de Portugal also conducts occasional operations of liquidity provision with a view to stabilising the money market.
FINLAND
Base rate (BR): the base rate is an administered interest rate set by the Parliamentary Supervisory Board. Its importance has diminished along with the developments of markets in Finland. Nonetheless, it is still of importance since a fairly large proportion of deposits and outstanding loans are tied td it, and these rates are adjusted whenever there ¡s a change in the base rate.
Tender rate (TR): rate determined by tenders held by the Central Bank in which banks are asked to make bids or offers for money market instruments with a maturity of 1 month. The tender rate is a weighted average of accepted bids or offers.