eurostat
ISSN 03783588
PFLANZLICHE ERZEUGUNG
Halbjährliche Statistiken
CROP PRODUCTION
Halfyearly statistics
PRODUCTION VÉGÉTALE
Statistiques semestrielles
1/2 D 1995
eurostat
STATISTISCHES AMT DER EUROPAISCHEN GEMEINSCHAFTEN STATISTICAL OFFICE OF THE EUROPEAN COMMUNITIES OFFICE STATISTIQUE DES COMMUNAUTÉS EUROPÉENNES
L-2920 Luxembourg — Tél. (352) 43 01 -1 — Télex COMEUR LU 3423 B-1049 Bruxelles, rue de la Loi 200 —Tél. (32-2)299 11 11
Eurostat hat die Aufgabe, den Informa-tionsbedarf der Kommission und aller am Aufbau des Binnenmarktes Beteiligten mit Hilfe des europäischen statistischen Systems zu decken.
Um der Öffentlichkeit die große Menge an verfügbaren Daten zugänglich zu machen und Benutzern die Orientierung zu erleichtern, werden zwei Arten von Publi-kationen angeboten: Statistische Doku-mente und Veröffentlichungen.
Statistische Dokumente sind für den Fachmann konzipiert und enthalten das ausführliche Datenmaterial: Bezugs-daten, bei denen die Konzepte allgemein bekannt, standardisiert und wissenschaft-lich fundiert sind. Diese Daten werden in einer sehr tiefen Gliederung dargeboten. Die Statistischen Dokumente wenden sich an Fachleute, die in der Lage sind, selbständig die benötigten Daten aus der Fülle des dargebotenen Materials auszu-wählen. Diese Daten sind in gedruckter Form und/oder auf Diskette, Magnet-band, CD-ROM verfügbar. Statistische Dokumente unterscheiden sich auch optisch von anderen Veröffentlichungen durch den mit einer stilisierten Graphik versehenen weißen Einband.
Veröffentlichungen wenden sich an eine ganz bestimmte Zielgruppe, wie zum Beispiel an den Bildungsbereich oder an Entscheidungsträger in Politik und Ver-waltung. Sie enthalten ausgewählte und auf die Bedürfnisse einer Zielgruppe abgestel'te und kommentierte Informa-tionen. Eurostat übernimmt hier also eine Art Beraterrolle.
Für einen breiteren Benutzerkreis gibt Eurostat Jahrbücher und periodische Veröffentlichungen heraus. Diese enthal-ten statistische Ergebnisse für eine erste Analyse sowie Hinweise auf weiteres Datenmaterial für vertiefende Unter-suchungen. Diese Veröffentlichungen werden In gedruckter Form und in Daten-banken angeboten, die in Menütechnik zugänglich sind.
Um Benutzern die Datensuche zu erleich-tern, hat Eurostat Themenkreise, d. h. eine Untergliederung nach Sachgebieten, eingeführt. Daneben sind sowohl die Statistischen Dokumente als auch die Veröffentlichungen in bestimmte Reihen, wie zum Beispiel „Jahrbücher", „Kon-junktur", „Methoden", untergliedert, um den Zugriff auf die statistischen Informa-tionen zu erleichtern.
Y. Franchet Generaldirektor
It is Eurostat's responsibility to use the European statistical system to meet the requirements of the Commission and all parties involved in the development of the single market.
To ensure that the vast quantity of ac-cessible data is made widely available, and to help each user make proper use of this information, Eurostat has set up two main categories of document: statistical documents and publications.
The statistical document is aimed at spe-cialists and provides the most complete sets of data: reference data where the methodology is well-established, stand-ardized, uniform and scientific. These data are presented in great detail. The statistical document is intended for ex-perts who are capable of using their own means to seek out what they require. The information is provided on paper and/or on diskette, magnetic tape, CD-ROM. The white cover sheet bears a stylized motif which distinguishes the statistical docu-ment from other publications.
The publications proper tend to be com-piled for a well-defined and targeted public, such as educational circles or political and administrative decision-makers. The information in these docu-ments is selected, sorted and annotated to suit the target public. In this instance, therefore, Eurostat works in an advisory capacity.
Where the readership is wider and less well-defined, Eurostat provides the infor-mation required for an initial analysis, such as yearbooks and periodicals which contain data permitting more in-depth studies. These publications are available on paper or in videotext databases. To help the user focus his research, Eurostat has created 'themes', i.e. subject classifications. The statistical documents and publications are listed by series: e.g. yearbooks, short-term trends or method-ology in order to facilitate access to the statistical data.
Y. Franchet Director-General
Pour établir, évaluer ou apprécier les dif-férentes politiques communautaires, la Commission européenne a besoin d'infor-mations.
Eurostat a pour mission, à travers le sys-tème statistique européen, de répondre aux besoins de la Commission et de l'en-semble des personnes impliquées dans le développement du marché unique. Pour mettre à la disposition de tous l'im-portante quantité de données accessibles et faire en sorte que chacun puisse s'orienter correctement dans cet ensem-ble, deux grandes catégories de docu-ments ont été créées: les docudocu-ments statistiques et les publications.
Le document statistique s'adresse aux spécialistes. Il fournit les données les plus complètes: données de référence où la méthodologie est bien connue, standar-disée, normalisée et scientifique. Ces données sont présentées à un niveau très détaillé. Le document statistique est des-tiné aux experts capables de rechercher, par leurs propres moyens, les données requises. Les informations sont alors disponibles sur papier et/ou sur disquette, bande magnétique, CD-ROM. La couver-ture blanche ornée d'un graphisme stylisé démarque le document statistique des autres publications.
Les publications proprement dites peu-vent, elles, être réalisées pour un public bien déterminé, ciblé, par exemple l'enseignement ou les décideurs politi-ques ou administratifs. Des informations sélectionnées, triées et commentées en fonction de ce public lui sont apportées. Eurostat joue, dès lors, le rôle de conseil-ler.
Dans le cas d'un public plus large, moins défini, Eurostat procure des éléments nécessaires à une première analyse, les annuaires et les périodiques, dans les-quels figurent les renseignements adé-quats pour approfondir l'étude. Ces publications sont présentées sur papier ou dans des banques de données de type vidéotex.
Pour aider l'utilisateur à s'orienter dans ses recherches, Eurostat a créé les thèmes, c'est-à-dire une classification par sujet. Les documents statistiques et les publications sont répertoriés par série — par exemple, annuaire, conjonc-ture, méthodologie — afin de faciliter l'accès aux informations statistiques.
PFLANZLICHE ERZEUGUNG
Halbjährliche Statistiken
CROP PRODUCTION
Halfyearly statistics
PRODUCTION VÉGÉTALE
Statistiques semestrielles
1/2 D 1995
Themenkreis / Theme / Thème
Land und Forstwirtschaft, Fischerei / Agriculture, forestry and fisheries / Agriculture, sylviculture et pêche
Reihe / Series / Série
Konjunkturstatistiken / Shortterm statistics / Statistiques conjoncturelles
5
Β
Die Veröffentlichung „Pflanzliche Erzeugung" wird ab 1996 halbjährlich erscheinen (und nicht mehr vierteljährlich wie bisher). Aus technischen Gründen erscheint für 1995 nur die vorliegende Ausgabe.
Ab 1996 wird „Pflanzliche Erzeugung" regelmäßig alle sechs Monate erscheinen, und zwar Nummer 1 im Januar und Nummer 2 im Juli des Jahres.
The Publication Crop Production will be edited half-yearly from 1996 onwards (and no longer quarterly as in the past). For technical reasons this will be the only edition in 1995.
From 1996 onwards Crop Production will be published every six months, that is No 1 in January and No 2 in July of the year.
La publication Production végétale sera éditée semestriellement à partir de 1996 (et non trimes-triellement comme par le passé). Pour des raisons d'ordre technique, la présente publication sera la seule et unique pour l'année 1995.
À partir de 1996, Production végétale sera publiée tous les six mois, le numéro 1 paraîtra en janvier et le numéro 2, en juillet.
Luxembourg: Office des publications officielles des Communautés européennes, 1995
© EGKS-EG-EAG, Brüssel · Luxemburg, 1995
Nachdruck — ausgenommen zu kommerziellen Zwecken — mit Quellenangabe gestattet.
© ECSC-EC-EAEC, Brussels · Luxembourg, 1995
Reproduction is authorized, except for commercial purposes, provided the source is acknowledged.
©CECA-CE-CEEA, Bruxelles · Luxembourg, 1995
Reproduction autorisée, sauf à des fins commerciales, moyennant mention de la source.
Printed in Luxembourg
Vorwort
Diese Veröffentlichung basiert auf dem Datenbanksystem FAME/NEW CRONOS (Bereich ZPA1), in dem die statistischen Zeitreihen von Eurostat seit 1995 zusammengefaßt sind. Diese Veröffentlichung enthält keine methodischen Hinweise1.
Die in dieser Veröffentlichung enthaltenen Daten können auf Wunsch auch, in elektronischer Form (Disketten, E-Mail etc) übermittelt werden. Anfragen können an Eurostat (an das Informationsbüro oder direkt an die Abteilung F2) gerichtet werden.
Die ab 1996 erscheinenden zwei halbjährlichen Ausgaben von "Pflanzliche Erzeugung" haben unterschiedliche Schwerpunkte: Heft 1 im Januar des Jahres enthält vor allem Versorgungsbilanzen pflanzlicher Erzeugnisse, Heft 2 (im Juli) konzentriert sich dagegen auf die Darstellung der Basisstatistiken pflanzlicher Erzeugnisse (Bodennutzung, Ernteflächen, Erträge und Erzeugung).
Aus technischen Gründen wird es 1995 nur diese vorliegende Ausgabe mit den Basisstatistiken und den Versorgungsbilanzen für Wein sowie Öle und Fette geben.
'Für methodische Erläuterungen sei der Leser hingewiesen auf das Glossarium "Pflanzliche Erzeugung" (erscheint einmal jährlich), auf das Jahrbuch "Landwirtschaft" und das Handbuch ZPA1, das zur Zeit überarbeitet wird.
Inhalt
Seite
18 Teil I: Bodennutzung
Teil II: Geerntete Flächen, Erträge und Erzeugung: Pflanzliche Erzeugnisse (ausgen. Gemüse und Obst)
Teil IM: Erzeugungsstatistiken von Gemüse 40
Teil IV: Erzeugungsstatistiken von Obst 58
Teil V: Versorgungsbilanzen:
Ölsaaten und Ölfrüchte, Ölkuchen, Fette und Öle
Wirtschaftsjahr 76
Kalenderjahr 106
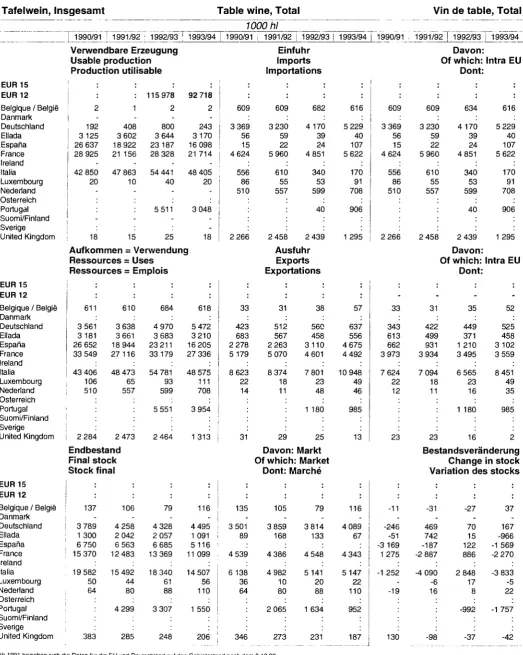
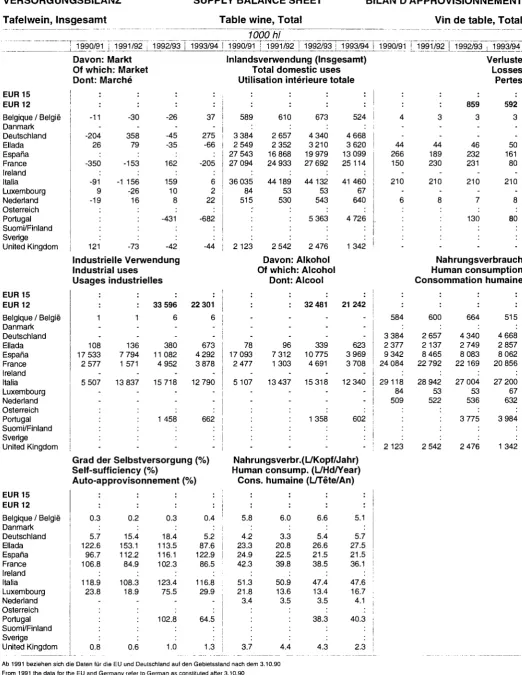
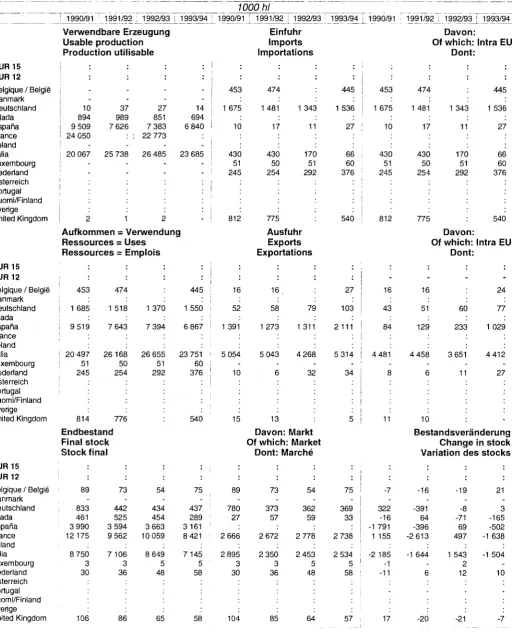
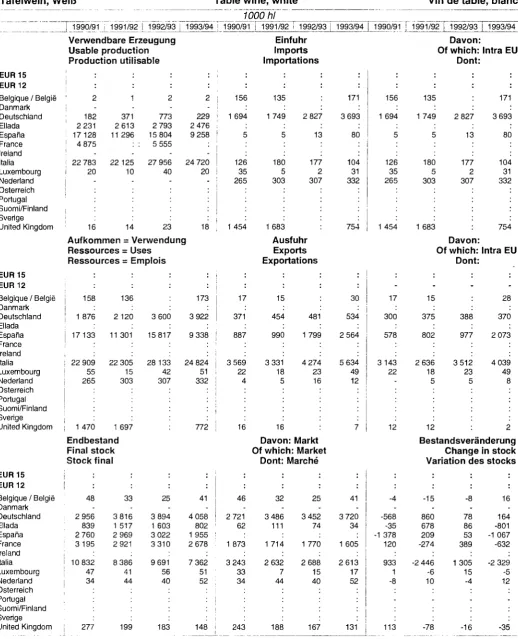
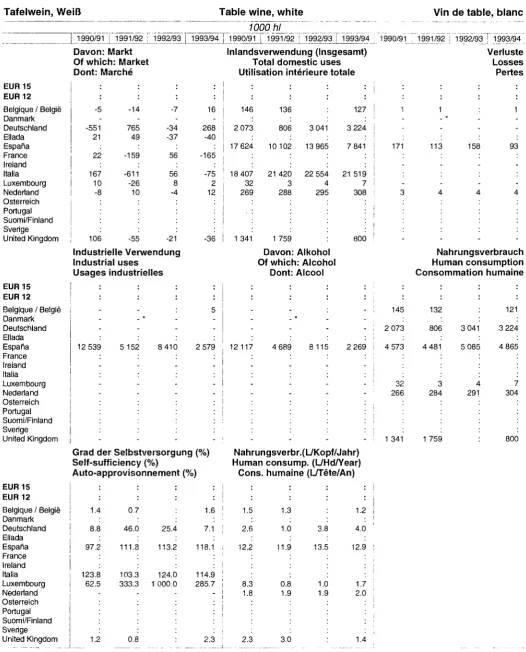
Teil VI: Versorgungsbilanz: Wein 122
Zeichen und Abkürzungen
Hinweis auf methodischen Bruch in der Zahlenreihe
Nichts oder aus logischen Gründen nicht errechnet
Weniger als die Hälfte der verwendeten Einheit 0
0,0
Kein Nachweis vorhanden S Statistische Geheimhaltung EUR 12 Mitgliedländer, ingesamt EUR 15
Preface
The source of this publication is the database system FAME/NEW CRONOS (domain ZPA1) where Eurostat collects its data since 1995. This publication contains no methodological remarks.'
The data of this publication is also available in electronic form (diskette, e-mail, etc). Inquiries can be directed to Eurostat (Information office or immediatly to Division F2).
From 1996 onwards the half-yearly editions of "Crop Production" will focus on the following subjects: Issue N° 1 (in January) will contain the supply balance sheets of crops, issue N° 2 (in July) will concentrate on the basic statistics of crops (land use, harvested areas, yields and production).
For technical reasons there will be in 1995 only the present edition with the basic statistics on crops and the supply balance sheets for wine, oil and fats.
'The interested reader can find methodological explanations in the glossery "Crop Production" (published yearly), the Yearbook "Agriculture" and the manual on ZPA1 which is under revision.
Contents
Page 8
18 Part I: Land use
Part II: Harvested area, yield and production: Crop products
(excl. vegetables and fruits)
Part III: Production statistics of vegetables 40
Part IV: Production statistics of fruits
Part V: Supply balance sheets: Oilseeds and fruits, oilcakes, fats and oils
58
crop year civil year
Part VI: Supply balance sheets: Wine
76
106
122
Signs and abbreviations
o
0,0s
EUR EUR
12 15
Break in series, which means that the data on each side of the line are not fully comparable Nil or not applicable
Data less than half the unit used
No data availbale Statistical confidentiality
Total of the member countries of the EC
Préface
Cette publication s'appuie sur la base de données FAME/NEW CRONOS (secteur ZPA1 ) dans laquelle les séries statistiques d'Eurostat sont ressemblées depuis 1995. Cette publication ne contient pas d'indications méthologiques1.
Les données contenues dans cette publicaton peuvent être transmises sur support informatique (disquette ou courier électronique) selon le souhait du demandeur. La demande est à adresser au bureau d'information d'Eurostat ou directement à l'Unité F2.
Les publications "Production végétale" dont la parution sera semestrielle à partir de 1996 différeront par leur contenu. - le volume 1 qui paraîtra en janvier présentera avant tout les bilans d'approvisionnement relatifs aux productions végétales.
- le volume 2 qui paraîtra en juillet est consacré à la présentation de statistique de base dans le domaine végétale (utilisation des terres, surface récoltée, rendement et production).
Pour les raisons d'ordre technique, ne sera diffusée en 1995 que la présente publicaton avec les statistiques de base et les bilans d'approvisionnement pour le vin, les graisses et huiles.
[image:7.595.304.566.11.776.2]Pour les précisions méthodologiques le lecteur ss reportera au glossaire "Productions végétales" (qui parait une fois par an), à l'Annuaire Agricole et au manuel ZPA1 qui est en cours de révision.
Table des matières
Partie I: Utilisation des terres
Partie II: Superficie et production récoltée: Produits végétaux
(excl. vegetables et fruits)
Partie III: Statistiques de production de légumes
Partie IV: Statistique de production de fruits
Partie V: Bilans d'approvisionnement: Graines et fruits olégineux, tourteaux, graisses et huiles
année de campagne année civile
Partie VI: Bilan d'approvisionnement: Vin
Page
18
40
58
76
106
122
Signes et abréviations
o
0,0
s
EUR EUR
12 15
Rupture dans la comparabilité
Néant ou non calculé pour des raisons logiques Donnée inférieure à la moitié de l'unité utilisée
Données non disponible Secret statistique
Ensemble des pays membres des CE
Quellen / Sources / Origens
Belgique/Belgiê
Ministère des Affaires économiques, institut national de statistique, Bruxelles, recensement agricole et horticole au 15 mai.
Ministère de l'Agriculture et Institut économique agricole, Bruxelles.
Danmark
Danmarks Statistik, København, Landbrugs og gartneritælling (June).
Bundesrepublik Deutschland
Ελλάδα
España
France
Ireland
Statistisches Bundesamt, Wiesbaden, Bodennutzungserhebung, (Mai).
Bundesministerium für Ernährung, Landwirtschaft und Forsten, Bonn.
National Statistical Service of Greece, Athens (crop year). Ministry of Agriculture, Athens.
Ministerio de Agricultura, Pesca y Alimentación, Madrid.
Ministère de l'Agriculture/Service central des enquêtes et études statistiques, Paris, répartition du territoire et des terres labourables (juin).
Fonds d'intervention et de régularisation du marché du sucre, Paris.
Central Statistics Office, Dublin. Area under crops and pasture (June).
Italia
Istituto centrale di statistica, ripartizione della superficie agraria e forestale per forma di
utilizzazione e per coltivazione (raccolta annuale 1° novembre - 31 ottobre).
Ministerio dell'Agricoltura e delle Foreste, Roma.
Luxembourg
Service centrai de la statistique et des études
économiques, Luxembourg, recensement de l'agriculture au 15 mai.
Nederland
Centraal Bureau voor de Statistiek, Voorburg, Landbouwtelling (May).
Ministerie van Landbouw, Natuurbeheer en Visserij, 's Gravenhage.
Landbouw-Economisch Instituut (LEI-DLO), Den Haag.
Österreich
Östereichisches Statistische Zentralamt, Wien, Agrarstrukturerhebung (June).
Portugal
Instituto Nacional de Estatistica, Lisboa.
Suomi/Finland
Information Centre of the Ministry of Agriculture, Helsinki, Sample surveys of acricultural holdings (June, October, December).
Sverige
Statistics Sweden, Stockholm, Farm Register (July).
United Kingdom
I
Bodennutzung
Land use
B O D E N N U T Z U N G Hauptanbau EUR 15 EUR 12 Belgique/Belgiê Danmark Deutschland Ellada Espana France Ireland Italia Luxembourg Nederland Österreich Portugal Suomi/Finland Sverige United Kingdom EUR 15 EUR 12 Belgique/Belgiê Danmark Deutschland Ellada España France Ireland Italia Luxembourg Nederland Österreich Portugal Suomi/Finland Sverige United Kingdom
EUR 15 EUR 12 Belgique/Belgiê Danmark Deutschland Ellada España France Ireland Italia Luxembourg Nederland Österreich Portugal Suomi/Finland Sverige United Kingdom
Γ 1984
Gesamt ¡312 769* 225 572 * 3 052 I 4 308 : 24 869 : 13 196 50 477 54 909 7 028 * 30 128
259 3 729 * 8 386 9 207 33 815 44 996 24 411
7 " 1985
fläche 312 872* 225 675 * 3 052 4 308 24 869 13 196 ' 50 476 54 909 7 028 * 30 128 259 3 831 8 386 9 207 33 815 44 996 24 411 Gewässer 10 848 *
3 545 * 2 7 · 7 0 * 430 ' 312 * 534 607 139 * 721 1 337 113 44 3 355 3 835 323 10 862* 3 559 * 27 * 7 0 * 444 312* 531 609 139 * 721 1 334 113 44 3 355 3 835 327 Landfläche 301 921 222 027 3 025 4 238 24 439 12 884 49 942 54 302 6 889 29 407 258 3 392 8 273 9 163 30 460 41 161 24 088 302 009 222 115 3 025 4 238 24 425 12 884 49 946 54 299 6 889 29 407 258 3 498 8 273 9 163 30 460 41 161 24 035
1986
313 078* 225 881 * 3 052 4 309 24 869 13 196 * 50 477 * 54 909
7 029 * 30 128 259 4 034 8 386 9 207 33 815 44 996 24 414
10 872* 3 569* 2 7 * 70 * 444 312 * 536 609 139 * 721 1 338 113 44 3 355 3 835 328
302 206 222 312 3 025 4 239 24 425 12 884 49 941 54 299 6 889 29 407 258 3 696 8 273 9 163 30 460 41 161 24 086
1987
313 086* 225 889 * 3 052 4 309 24 869 13 196 * 50 477 * 54 909
7 029 * 30 128 259 4 042 8 386 9 207 33 815 44 996 24 414* 10 872* 3 569* 2 7 * 7 0 * 444* 312 * 534* 611 139 721 1 338 113 44 3 355 3 835 328* 302 214 222 320 3 025 4 239 24 425 12 884 49 943 54 298 6 889 29 407 258 3 704 8 273 9 163 30 460 41 161 24 086
LAND USE
Main crops area
j _ _ 1988
313 070* 225 873 * 3 052 4 309 24 869 13 196 * 50 476 * 54 909
7 029* 30 128
259 4 042 8 386 9 191 33 815 44 996 24 414 *
10 895* 3 592* 27 7 0 * 444* 312 * 534* 632 139 * 721 1 340 113 44 3 355 3 835 328* 302175 222 281 3 025 4 239 24 425 12 884 49 942 54 276 6 889 29 407 258 3 702 8 273 9 147 30 460 41 161 24 086
1000 ha 1989 Total 313163 225 966 3 052 4 309 24 862 13 196 50 471 54 909 7 029 30 128 259 4148 8 386 9 191 33 815 44 996 24 414
! 1990
area 313 163 225 966 3 052 4 309 24 862 13 196 50 471 54 909 7 029 30128 259 4148 8 386 9191 33 815 44 996 24 414 Water 10 904*
3 601 * 2 7 * 70 450 312 * 534* 634 139* 720 1 342 113 44 3 355 3 835 328 * Land 302 260 222 366 3 025 4 239 24 412 12 884 49 937 54 275 6 889 29 408 258 3 806 8 273 9 147 30 460 41 161 24 086
10 920 * 3 617* 2 7 * 7 0 * 450 312* 550 634 139* 720* 1 * 342 * 113
4 4 * 3 355 3 835 328 * area 302 244 222 350 3 025 4 239 24 412 12 884 49 922 54 275 6 889 29 408 258 3 806 8 273 9 147 30 460 41 161 24 086
j 1991
323 996 236 799 3 052 4 309 35 695 13 196 50 468 54 909 7 029 30 131 259 4148 8 386 9 191 33 815 44 996 24 414
11 261 * 3 958* 2 7 * 7 0 * 764 312* 577 634 139* 720* 1 * 342 * 113
44 * 3 355 3 835 328* 312 736 232 842 3 025 4 239 34 931 12 884 49 891 54 274 6 889 29 411 258 3 806 8 273 9 147 30 460 41 161 24 086
UTILISATION DES T E R R E S
j 1992
324 008 236 811 3 052 4 309 35 695 13 196 50 479 54 909 7 029 30 131 259 4 148 8 386 9 191 33 815 44 996 24 414 11 262* 3 959* 27 * 7 0 * 764 312 * 577 635 139 * 720 * 1 * 342 * 113
4 4 * 3 355 3 835 328 * 312 746 232 852 3 025 4 239 34 931 12 884 49 902 54 273 6 889 29 411 258 3 806 8 273 9 147 30 460 41 161 24 086
Cultures prir
! 1993
324 008 236 811 3 052 4 309 35 697 13 196 50 479 54 909 7 029 30 131 257 4 148 8 386 9 191 33 815 44 996 24 414
11 263 * 3 960*
2 7 * 70 * 764 312 * 577 636 139* 7 2 0 * 1 * 342 * 113
4 4 * 3 355 3 835 328 *
! 1994
icipales
| 1995
Superficie totale 324 008
236 811 3 052 4 309 35 697 13 196 50 479 54 909 7 029 30 131 257 4 148 8 386 9 191 33 815 44 996 24 414
1 1 2 6 4 * 3 9 6 2 * 2 7 * 7 0 * 764 312 * 577 639 139 * 720 1 * 342 * 112
4 4 * 3 355 3 835 327* 324 008 236 811 3 052 4 309 35 697 13 196 50 479 54 909 7 029 30 131 257 4 148 8 386 9 191 33 815 44 996 24 414 Eaux 11263 3 962 27 70 764 312 577 639 139 720 1 342 111 44 3 355 3 835 327
Superficie des terres 312 745 232 851 3 025 4 239 34 933 12 884 49 902 54 272 6 889 29 411 256 3 806 8 273 9 147 30 460 41 161 24 086 312 745 232 850 3 025 4 239 34 933 12 884 49 902 54 270 6 889 29 411 256 3 806 8 274 9147 30 460 41 161 24 087 312 746 232 850 3 025 4 239 34 933 12 884 49 902 54 270 6 889 29 411 256 3 806 8 275 9 147 30 460 41 161 24 087 Ab 1991 beziehen sich die Daten für die EU und Deutschland auf den Gebietsstand nach dem 3.10.90
From 1991 the data for the EU and Germany refer !o German as constituted after 3.10.90
BODENNUTZUNG
Hauptanbau
EUR 15 EUR 12 Belgique/Belgiê Danmark Deutschland Ellada España France Ireland Italia Luxembourg Nederland Österreich Portugal Suomi/Finland Sverige United Kingdom EUR 15 EUR 12 Belgique/Belgiê Danmark Deutschland Ellada España France Ireland Italia Luxembourg Nederland Österreich Portugal Suomi/Finland Sverige United Kingdom EUR 15 EUR 12 Belgique/Belgiê Danmark Deutschland Ellada España France Ireland Italia Luxembourg Nederland Österreich Portugal Suomi/Finland Sverige United Kingdom1984 Γ" 1985"
Übrige Fläche 60 452 39 051 984 877 5 067 1 377 10 192 8 192 857 5 604 41 1 074 1 543 1 633 4 722 15 136 3 152 61 001 39 472 989 911 5 046 1 385 10 220 8 243 849 5 811 42 1 176 1 541 1 633 4 839 15 149 3 167
Forstfläche
102 4 8 3 * 53 334 * 617 493 * 7 3 2 8 * 5 755* 12511 14 607 327 6 086 88 293 3 221 2 968* 23 186 22 742 2 260
102 5 3 9 * 53 390 * 617 493 * 7 360 5 755 * 12511 14618 327 * 6 086* 89 293 * 3 221 2 968 * 23 186 22 742 2 273 1986 62105 40 485 996 923 5 065 1 368 10 289 8 264 1 536 5 847 41 1 345 1 586 1 633 4 867 15 167 3 177 102 609* 53 490 * 617 493 * 7 360 5 755 * 12511 14 642 331 6 097 89 330 3 191 2 968 * 23 186 22 742 2 297
LAND USE
Main crops area
1987 62152 40 517 1 002 928 5 109 1 363 10310 8 255 1 665 5 579 42 1351 1 600 1 633 4 848 15188 3 279 102 975* 53 856 * 617 493 * 7 360* 5 755* 12 511 * 14 688 337 6410 89 330 3191 2 9 6 8 * 23186 22 742 2 2 9 7 *
1988 66 804 44 988 1 012 941 5 150 4714 10 364 8 697 1 760 5 732 43 1 353 1 580 2 016 4818 15418 3 206 100112* 51 200 * 617 493* 7 360* 2 951 * 12511 * 14 779 330 6 335 89 330* 3 191 3 108* 23 186 22 535 2 297*
1000 ha
1989
Other
67120 45 406 1 020 961 5118 4 721 10 387 8 800 1 883 5 773 42 1 463 1 579 2 010 4 698 15 438 3 226 1990area
64 233 42 524 1 024 1 006 5144 4 739 7 126 8 870 2 026 5 680 42 1 464 1 549 2 060 4715 15 446 3 342Wooded area
100 249* 51 337 * 617 493* 7 401 2 951 * 12511 * 14 790 330 6 420 89 330* 3191 3108 23 186 22 535 2 2 9 7 *103 571 * 54 624 * 617 * 445 7 401 2 951 * 15 807 14 820 327 6 434 89 330* 3 226 3 108* 23 186 22 535 2 297* 1991 64 213 42 444 1 007 1 024 7410 4 757 3 979 8 983 2 125 5 700 43 1 495 1 529 2 064 4 735 15 504 3 857 107 077* 5 8 1 3 0 * 617* 445 * 10 385 2 940* 15 858 14 849 320 6 764*
8 9 * 330* 3 226 3 108* 23 186 22 535 2 425
Landwirtschaftlich genutzte Fläche
Utilized agricultural area
138 986* 129 6 4 2 * 1 424 2 868 12 044 5 751 * 27 240 31 502 5 705 17716 128 2 025 3 509 4 562 2 552 3 283 18 676
138 4 6 9 * 129 253* 1 419 2 834 12019 5 7 4 4 * 27 215 31 438 5713 17510 127 2 028 3 511 4 562 2 435 3 270 18 644 137 492* 128 337* 1 412 2 823 12 000 5 7 6 0 * 27 141 31 394 5 023 17 463 128 2 021 3 496 4 562 2 407 3 252 18612 137 087* 127 948* 1 406 2818 11 956 5 765* 27122 31 354 4 887 17418 127 2 023 3 482 4 562 2 426 3 231 18510 135 259 126 093 1395 2 805 11 915 5219 27 068 30 800 4 800 17 340 126 2 019 3 502 4 023 2 456 3 208 18 583 134 890 125 623 1388 2 785 11 893 5212 27 039 30 685 4 676 17215 126 2013 3 503 4 029 2 576 3188 18 563 134 439 125 202 1 383 2 788 11 868
5 194 26 989 30 585 4 537 17 294 127 2 012 3 498 3 979 2 559 3180 18 447
141 446 132 267 1 401 2 770 17 137 5 187 30 054 30 442 4444 16 947 126 1 981 3 518 3 975 2 539 3122 17 804
UTILISATION DES TERRES
1992
65 096 43 066 1 032 1 038 7 581 4 762 3 987 9 056 2 154 5 847 43 1 500 1 546 2 157 4 746 15 738 3 909 106 980* 58 245 * 617 * 445 * 10 400* 2 940 * 15915 14 870 320 6 772 *
8 9 * 330* 3 226 3 108 * 23 186 22 323 2 438
Cultures principales
1993 i
Autre 65 642 43 610 996 1 049 7 338 4 781 4 231 9 123 2 163 5 898 40 1 498 1 553 2 077 4 755 15 724 4 417
1994 I
superfic 1 053 1 073 5 037 9112 41 1 513 2 055 4 752
Superficie
107 079* 58 329 * 617* 445 * 10 4332 940 * 15915 14 932 320 * 6 770 * 8 9 * 330 * 3 241 3 108 * 23 186 22 323 2 430 *
Superficie
140 670 131 541 1 376 2 756 16 950 5 182 30 000 30 347 4415 16 792 126 1 975 3 501 3 882 2 528 3 100 17 739 140 024 130 912 1 412 2 745 17 162 5 163 29 756 30 217 4 407 16 743 127 1 977 3 479 3 962 2519 3114 17 240 617* 445 * 2 940 * 15915 15 005; *
88 * 330 * 3 108* 23 186 22 323
agricole
1354 2 721 17 308 28 951 30 153 127 1 963 3 984 2 522 15 894 1995e n.a.d.
8 830boisée
617 445 2 940 15915 327 330 23 186utilisée
25 157Ab 1991 beziehen sich die Dalen für die EU und Deutschland aul den Gebietsstand nach dem 3.10.90 From 1991 the data for the EU and Germany refer to German as constituted after 3.10.90
BODENNUTZUNG Hauptanbau -EUR 15 EUR 12 Belgique/Belgiê Danmark Deutschland Ellada España France Ireland Italia Luxembourg Nederland Österreich Portugal Suomi/Finland Sverige United Kingdom EUR 15 EUR 12 Belgique/Belgiê Danmark Deutschland Ellada España France Ireland Italia Luxembourg Nederland Österreich Portugal Suomi/Finland Sverige United Kingdom EUR 15 EUR 12 Belgique/Belgiê Danmark Deutschland Ellada España France Ireland Italia Luxembourg Nederland Österreich Portugal Suomi/Finland Sverige United Kingdom
! 1984 ' 1985
H a u s g ä r t e n
22 40
254 80
! °
5 *30
16 "
22 38 249 80 0 6 * 30 16
D a u e r k u l t u r e n
12 0 7 6 * 11 9 7 5 * 14 12 182 1 037 4 943 1 339 2 3 482 2 36 95 865 * 2 4 61
11 971 * 11 870 * 14 12 181 1 042 4 924 1 324 2 3 408 2 36 95 865 * 2 4 60 * Dauergrünland
51 994 49 528
644 228 4 607 1 789 6 646 12 362 4 597 5 0 1 2
71 1 141 1 986 761 134 346 11 670 51 580 49 235 640 221 4 566 1 789 6 728 12 200 4 6 1 2 4 954 71 1 127 1 986 761 15 344 11 567 1986 22 38 250 81 0 5 * 30 16
11 929 *
11 831 * 14 12 181 1 046 4 924 1 312 2 3 376 2 35 92 865 * 2 4 61 50 850 48 509 632 219 4 537 1 789 6 652 12 093 4 121 4 944 70 1 108 1 986 761 15 340 11 583 1987 22 32 246 88 0 5 * 30 16
11 869 *
11 771 * 15 13 181 1 051 4 876 1 302 2 3 366 2 * 36 92 865 * 2 4 61 * 50 478 4 8 1 5 6
626 210
4 481
1 789
6 685 11 894
4 037
4 942 70
1 090
1 970 761
15 337 11 572
LAND USE Main crops area
j 1988 22 31 236 89 0 5 * 30 16 1000 ha 1989 1990
Kitchen gardens 21 30 233 89 0 5 * 30 16 21 28 230 90 0 5 * 30 16 1991 21 30 227 90 0 17 32 16
Land under permanent crops 11 6 8 3 *
11 5 8 5 *
15 11 182 1 061 4 858 1 239 2 3 3 4 4 *
1 36 92 7 7 6 *
2 4 60
11 6 7 4 * 11 5 7 5 *
16 11 184 1 065 4 878 1 217 2 3 3 2 5 *
1 37 92 780 2 4 59 Permanent 50 327 *
48 0 1 0 *
621 217 4 449 1 789 6 650 * 11 767 3 989 4 897 69 1 081 1 970 830 15 332 11 651
50 2 1 5 * 47 791 * 615 219 4 407 1 789 6 650 * 11 565
3 872 * 4 883 69 1 067 1 970 838 123 331 11 817
11 6 9 5 * 11 5 9 0 *
17 10 184 1 071 4 895 1 212 2 3 323 *
2 38 99 779 3 3 57
11 656 *
11 552 * 17 10 218 1 067 4 832 1 207 2 3 3 2 3 *
2 32 99 7 8 4 *
2 3 56 grassland 49 801 47 461 579 217 4 375 1 789 6 758 11 380 3 760 4 868 69 1 062 1 993 820 15 332 11 785
52 760 *
50 423 * 556 212 5 330 1 789 10 037 11 211 3 687 4 508 69 1 044 1 993
8 0 0 * 15 329 11 179
UTILISATION DES TERRES
1992 21 29 226 90 0 17 31 16
11 586 *
11 490 * 18 11 211 1 073 4 765 1 209 2 3 3 2 3 *
1 33 91 787 * 2 3 55
52 359 * 50 022 * 528 208 5 243 1 789 10 168 11 098 3 617 4 349 69 1 030 1 993 800 * 15 329 11 124 Cultures pri 1993 53 27 223 90 0 17 31 16 Í 1994 ncipales | 1995 Jardins familiaux 8 22 221 90 0 17 31 16 90 0 16 Cultures permanentes 1 1 4 7 7 *
11 3 7 5 *
14 11 208 1 077 4 674 1 204 2 3 323 *
2 33 97 779 2 3 48 14 12 210 4 7 1 6 1 192 1 35 779 3 3 46 Superficie
4 7 1 6
1
toujours couvertes d'herbes 5 1 8 4 8
49 521 525 204 5 251 1 789 10 233 10 764 3 447 4 300 68 1 030 1 981 862 15 331 11 048 407 185 5 271 1 789 10 259 10 651 3 433 68 1 012 862 16 9 883 10 259
Ab 1991 beziehen sich die Daten für die EU und Deutschland auf den Gebietsstand nach dem 3.10.90 From 1991 the data for the EU and Germany referto German as constituted after 3.10.90
A partir de 1991. les données pour l'EU et l'Allemagne se réfèrent au territoire allemand après le 3.10.90
BODENNUTZUNG
Hauptanbau
1984 1985 1986 1987
LAND USE
Main crops area
1000 ha
~ " 1989 7~ î 990 " 1988 1991
UTILISATION DES TERRES
Cultures principales
1992 1993 1994 1995
Ackerland Arable land Terres arables
EUR 15 EUR 12 Belgique/België Danmark Deutschland Ellada España France Ireland Italia Luxembourg Nederland Österreich Portugal Suomi/Finland Sverige United Kingdom
EUR 15 EUR 12 Belgique/België Danmark Deutschland Ellada España France Ireland Italia Luxembourg Nederland Österreich Portugal Suomi/Finland Sverige United Kingdom
74 469 '
67 692
744 2 627' 7216 2 925 ' 15 651 17 548 1 106 9 142 56 843 1 428 2 906 2 416 2 933 6 929
74 477 *
67 707 * 742 2 601 7 233 2 913 * 15 564 17 665 1 099 9 068 54 860 1 430 2 906 2418 2 922 7 001 74 272 67 556 '
743 2 592 7 244 2 925 ' 15 565 17 739 899 ' 9 061 56 873 1 418 2 906 2 390 2 908 6 952 Getreide insgesamt (ausg. Reis) 36 233 361 1 669 4 941 1 518 7511 9714 396 4 709 35 198 958 4 036 35 697 345 1 612 4 884 1 472 7 517 9 701 386 4 580 34 184 930 4015 35 451 350 1 588 4 812 1 446 7 630 9 489 363 4 564 34 170 981 1 206 1 580 4 026 74 302 67 583 744 2 595 7 262 2 925 15 561 17912 848 9 021 56 892 1 420 2 906 2 409 2 890 6 861 35 003 351 1 509 4 697 1 454 7 804 9 241 334 4 468 34 177 995 1 258 1 430 3 939 72 821 66 070 738 2 577 7 253 2 369 15 560 17 558 809 9010 55 897 1 440 2 387 2 439 2 872 6 856
72 577 *
65 832 * 736 2 555 7 273 2 358* 15512 17 670 802 * 8917 56 903 1 441 2 381 2 451 2 853 6 671 72 522 65 729 767 2 561 7 280 2 334 15 335 17 763 775 9 012 56 907 1 406 2 350 2 542 2 845 6 589 76 596 69 859 806 2 547 11 559 2 331 15 185 17 796 754 9 025 55 888 1 426 2 359 2 521 2 790 6 553
Cereals (excl. rice)
35 486 369 1 599 4 734 1 433 7 821 10 009 324 4 262 34 198 805 1 216 1346 3 896 34 932 350 1 578 4 639 1 433 7 851 9 420 320 4 354 34 205 874 1 192 1332 3 874 33 447 335 1 582 4 471 1 454 7 463 9 041 299 4193 33 196 724 1 248 1336 3 658 35 862 315 1 573 6 560 1 480 7 720 9 207 302 4197 31 181 795 1 021 1 196 3 501 76 294 69 598 809 2 537 11 468 2 320 15 067 17813 796 9 030 55 896 1 417 2 264 2511 2 768 6 544 38134 35 211 311 1 612 6 514 1 392 7318 9 321 300 4 009 30 184 838 732 917 1 168 3 489 76 242 69 560 820 2 531 11 676 2 297 14 849 18 026 958 9 030 57 898 1 401 2 291 2 501 2 780 6 127 925 2 524 11 805 2 250 ' 13 976 18 090 958 57 899 1 410 2313 2 503 2 780 5 949 11 855 10 182 58 1 410
Céréales (excl. riz)
35 197 34 83232 295 31 893 :
312 309 310 1438 1415 1460 6 224 6 235 6 535 1 354 1 284 1 293 6 378 6 423 6 617 8 517 8 141 8 288
285 270 276 3 841 3 882 :
30 30 29 187 195 198 825 821 814 699 666 682 923 945 1 019 1 153 1 173 1 103 3 031 3 042 3 091
EUR 15 EUR 12 Belgique/België Danmark Deutschland Ellada España France Ireland Italia Luxembourg Nederland Österreich Portugal Suomi/Finland Sverige United Kingdom
Reis (Paddy) Rice (Paddy) Riz (Paddy)
i 308 319 332 331 348 332 375 369 362 338 371 :
308 319 332 331 348 332 375 369 362 338 371
15 73 9 17 75 11 18 78 12 21 76 12 22 80 14 16 58 18 17 90 20 15 94 21 14 86 24 19 48 26 23 63 27 25 51 28 180 30 184 30 189 32 190 32 195 34 202 34 214 34
Ab 1991 beziehen sich die Daten für die EU und Deutschland auf den Gebietsstand nach dem 3.10.90 From 1991 the data for the EU and Germany refer to German as constituted after 3.10.90
A partir de 1991, les données pour PEU et l'Allemagne se réfèrent au territoire allemand après le 3.10.90
BODENNUTZUNG Hauptanbau EUR 15 EUR 12 Belgique/België Danmark Deutschland Ellada España France Ireland Italia Luxembourg Nederland Österreich Portugal Suomi/Finland Sverige United Kingdom EUR 15 EUR 12 Belgique/België Danmark Deutschland Ellada España France Ireland Italia Luxembourg Nederland Österreich Portugal Suomi/Finland Sverige United Kingdom EUR 15 EUR 12 Belgique/België Danmark Deutschland Ellada España France Ireland Italia Luxembourg Nederland
Österreich ! Portugal Suomi/Finland Sverige United Kingdom 1984 Hiilsenl 1 391 1 364 1 57 16 50 425 232 2 171 0 16 16 265 4 48 88 1985 rüchte 1 527 1478 1 131 34 42 411 254 2 176 0 25 17 246 4 45 137 Hackfrüchte
4 278 177 237 741 88 677 969 88 370 1 292 99 130 92 508 4 167 182 228 731 98 616 903 84 381 1 302 87 133 90 508 Handelsgewächse
3 281 17 196 278 559 1 218 1 058 5 184 1 22 41
3 624 16 220 289 633 1 214 1 249 4 208 1 19 43 301 1986
1 703 1 650 3 150 69 43 418 357 2 169 0 32 17 248 3 42 150
4 021 175 222 700 98 591 813 85 418 1 307 71 125 89 486 13 231 333 644 1 183 1 431 308 1 13 47 75 175 303 1987 2 076 1985 6 211 111 40 431 509 2 170 0 48 33 245 2 60 208 3 927 170 210 671 86 571 802 85 427 1 298 78 128 89 478 16 260 463 623 1228 1 966 487 1 16 46 83 170 400 LAND USE Main cri t 1988
1 995 1 912 4 147 95 35 371 555 3 166 0 44 33 233 3 46 260
3 764 168 211 656 90 564 714 78 400 1 287 76 120 90 474 16 204 427 649 1 289 1 980 554 1 15 72 86 150 Dps area 7000 ha
1989 I 1990 Dried pulses
1 915 1 837 3 123 72 38 326 636 3 153 1 26 33 239 3 45 215
1 928 1 850 4 115 49 32 317 714 3 152 1 19 34 229 3 40 216 Root crops 165 204 653 540 693 74 420 1 292 83 121 87 458 Industrial 17 234 475 676 1 191 1 804 568 1 14 58 74 169 175 209 674 523 727 74 404 1 304 85 121 86 454 crops 20 273 631 | 1 444 2 044 602 2 17 108 66 168 1991
1 677 1 589 6 99 58 30 300 686 3 150 1 14 33 58 11 26 203 170 201 955 512 713 71 1 306 89 113 76 461 21 283 1 301 1 940 510 3 12 64 61 151
UTILISATION DES T E R R E S
1992 1 635 1 538 4 118 56 27 245 716 3 134 1 10 31 39 16 27 208 176 200 946 489 724 72 1 310 90 109 87 459 19 181 1 669 1 771 416 2 9 80 73 138 Cult 1993
1 686 1 614 7 124 86 26 219 743 6 121 1 7 32 32 13 27 244 164 184 874 449 675 72 1 295 87 89 69 88 435
ures p r i n c i p a l e s
1994 : 1995 — Légumes secs 1 762
1 695 6 103 96 24 419 677 6 102 1 5 33 29 6 28 228 121 97 0 Plantes sarclées 163 167 824 442 703 74 1 288 84 86 70 86 422 164 866 1 87 80 Plantes industrielles 15 165 2 261 1 493 330 2 7 98 69 145 557 1 547 2 10 67 128 601 27 2 50 82
Ab 1991 beziehen sich die Daten fur die EU und Deutschland auf den Gebietsstand nach dem 3.10 90 From 1991 the data for the EU and Germany refer to German as constituted after 3 10.90
A partir de 1991. les donnees pour l'EU st l'Allemagne se réfèrent au territoire allemand après le 3 10.90
BODENNUTZUNG
Hauptanbau
LAND USE
Main crops area
UTILISATION DES TERRES
Cultures principales
EUR 15 EUR 12 Belgique/België Danmark Deutschland Ellada España France Ireland Italia Luxembourg Nederland Österreich Portugal Suomi/Finland Sverige United Kingdom EUR 15 EUR 12 Belgique/België Danmark Deutschland Ellada España France Ireland Italia Luxembourg Nederland Österreich Portugal Suomi/Finland Sverige United Kingdom EUR 15 EUR 12 Belgique/België Danmark Deutschland Ellada España France Ireland Italia Luxembourg Nederland Österreich Portugal Suomi/Finland Sverige United Kingdom 1984 Gemüse 1 720 1 693 26 18 40 153 478 253 5 427 0 63 16 94 4 7 135 1985 1 725 1 698 30 18 45 155 472 250 5 415 0 69 17 94 4 7 144 Feldrauhfutterbau 155 387 1 1755 079 593 2 584 18 206 470
1 816
160 357 1 224 5 025 596 2 637 18 218 470 1 820 1986 I
1 707 1 680 32 19 48 141 467 254 6 411 0 68 17 88 3 7 147 163 351 1 255 5 085 2 603 19 234 470 776 1 751 Blumen und Zierpflanzen
57 1 1 7 1 3 7 0 9 0 20 0 0 7 58 1 1 8 1 4 7 0 8 0 21 0 0 7 59 1 1 8 1 4 7 0 8 0 22 0 0 7 1987
1 685 1 644 30 15 44 145 468 245 6 407 0 64 33 87 2 6 134 161 329 1 224 4 900 2 505 19 236 470 717 1 713 60 1 0 8 1 4 7 0 8 0 23 0 0 7 1988 1 723 1 681 32 16 47 144 493 251 5 402 0 65 33 84 3 6 141
1000
1989ha
1990 Vegetables 1 744 1 702 32 16 49 144 504 267 5 396 0 65 33 83 3 6 141 1 757 1 714 31 16 49 | 142 496 276 4 411 0 65 34 82 3 6 142 1991 32 16 125 111 474 282 4 0 70 33 80 11 6 139 Green fodder from arable land160 333 1 215
4 526 2 483 19 233 450 679 1 651
160 328 1 202 4 582 2 408 18 240 578 672 1 568 195 326 1 173 |
4 686 2 378 19 243 450 671 1 622 226 337 2 017 4 564 20 244 437 616 1 630 Flowers and ornemental plants
63 1 0 9 1 5 7 0 8 0 23 0 0 7 65 1 0 8 1 5 7 1 10 0 24 0 0 8 66 2 0 9 I 1 5 7 1 9 0 24 0 0 8 2 0 10 1 2 7 0 0 3 0 0 6 1992 ] 32 16 84 132 454 279 4 0 70 31 16 6 134 249 353 1 872 4 356 2718 30 257 425 655 1 613 1993 30 16 80 129 426 264 0 69 32 13 6 126
;_"._ Ï9?4_
J
Lé
31 84 125 421 260 0 33 6 6 176 1995 gumes 30 86 13 16 Fourrages verts des terres arables257 395 1 854 4 301 2 623 31 269 420 680 1 634 379 1 769 4 872 2 530 31 273 420 677 1 530 1 800 24 776
Fleurs et plantes ornementales
2 0 9 1 2 7 0 0 3 0 0 6 2 0 9 1 2 7 0 0 2 0 0 6 1 0 9 1 2 7 0 0 3 0 0 12 1 9 0 0
Ab 1991 beziehen sich die Daten für die EU und Deutschland auf den Gebietsstand nach dem 3.10.90 From 1991 the data for the EU and Germany refer to German as constituted after 3.10.90
A partir de 1991. les données pour l'EU et l'Allemagne se réfèrent au territoire allemand après le 3.10.90
BODENNUTZUNG
Hauptanbau
1984 1985 1986
LAND USE
Main crops area
UTILISATION DES TERRES
Cultures principales
1987
1000 ha
1988 1989 1990 1991 1992 1993 1994 1995
Anbau von Saatgut Areas harvested for seed Cultures de semences EUR 15 EUR 12 Belgique/België Danmark Deutschland Ellada España France Ireland Italia Luxembourg Nederland Österreich Portugal Suomi/Finland Sverige United Kingdom 2 47 9 8 65 1 25 0 20 0 16 2 47 9 8 65 1 15 0 .18 0 19 2 45 11 8 65 1 13 0 21 0 7 9 18 2 57 10 8 57 1 10 0 24 0 9 7 20 2 58 12 8 45 1 12 0 26 0 13 9 20 2 69 12 8 50 1 9 0 27 0 13 11 20 2 52 13 | 8 52 0 10 0 28 0 11 11 20 2 50 52 8 59 0 0 29 1 . 7 10 2 52 41 8 62 0 0 28 2 7 9 2 56 32 8 58 0 0 29 1 1 6 8 3 51 27 8 57 0 0 21 1 1 8 8 2 27 0 1
Brache, einschl. Gründüngung Fallow land, incl. green manures Jachères, y compris engrais vetrs
EUR 15 EUR 12 Belgique/België Danmark Deutschland Ellada España France Ireland Italia Luxembourg Nederland Österreich Portugal Suomi/Finland Sverige United Kingdom
EUR 15 EUR 12 Belgique/België Danmark Deutschland Ellada España France Ireland Italia Luxembourg Nederland Österreich Portugal Suomi/Finland Sverige United Kingdom 6 699 3 3 7 469 4 573 163 338 0 4 1 095 6 821 5 3 8 465 4 573 201 424 0 6 1 095 6 754 4 3 9 467 4 527 217 6 487 4 4 34 461 4319 179 376 342 0 0 7 6 1 095 234 110 48 42 41 Frischobst
(einschl. Wein und Oliven)
12 9 158 1 020 4 832 1 318 2 3 436 26 737 56 11 9 158 1 025 4818 1 304 2 3 366 25 741 55 11 8 157 1 030 4818 1 288 2 3 328 24 743 53 1 095 248 228 42 12 8 156 1 035 4 774 1 279 2 3 319 24 747 53 5 784 4 4 52 472 3 476 270 539 0 8 900 347 281 58 6 219 5 5 155 469 4 000 214 6 636 5 4 215 500 4 162 224 398 549 0 0 9 13 900 402 254 65 900 456 221 64 6 5 781 486 4 055 319 18 831 716 315 64
Fresh fruit
(incl. wine and olives)12 8 156 4 760 1 222 2 3 296 24 750 52 13 8 157 4 783 2 25 51 13 6 156 | 4 796 2 25 50 14 4 4 793 2 26 48 4 757 482 4 036 530 20 831 755 284 53 23 156 1 357 494 4 241 1 821 27 922 720 257 47 25 222 1 439 476 4 543 1 927 31 922 709 253 44 1 273 4 543 1 703 112
Ensemble des cultures fruitières (incl. vigne et olives)
15 4
15 8
16
4 755 4 648
2 26 46 26 45 26 25 45
Ab 1991 beziehen sich die Daten für die EU und Deutschland auf den Gebietsstand nach dem 3.10.90 From 1991 the data for the EU and Germany refer to German as constituted after 3.10.90
A partir de 1991. les données pour l'EU et l'Allemagne se réfèrent au territoire allemand après le 3.10.90
BODENNUTZUNG
Hauptanbau
1984 1985
Baumschulen EUR 15
EUR 12 Belgique/België Danmark
Deutschland , Ellada
España France Ireland Italia Luxembourg Nederland Österreich Portugal Suomi/Finland Sverige United Kingdom
78 3 3 20 1 0 19 0 19 0 6 2
6
78 3 4 19 1 0 19 0 18 0 7
1986
79 3 3 19 1 0 18 0
19 0 7
1987
LAND USE
Main crops area
"~_~Z \TJoqd ha
198983 3 3 20 1 0 18 0 20 0
1988 1990 1991
Hardy nursery stocks
3 3 21 1 0 19 0 20 0
3 3 21 1 0
18 0 22 0
3 3 22
0 18
1 22 0
6 6 7 8 8
Ab 1991 beziehen sich die Daten für die EU und Deutschland auf den Gebietsstand nach dem 3.10.90 From 1991 the data for the EU and Germany refer to German as constituted after 3.10.90
A partir de 1991, les données pour l'EU et l'Allemagne se réfèrent au territoire allemand après le 3.10.90
UTILISATION DES TERRES
Cultures principales
1992 "7 19931 7 1994 Γ 1995
Pépinières
3 3 27
4 3 26
0 10 2
4 3 27
0 18 0
0 10 2
1 1
27
0 18 0
0 10
0 10
II
Geerntete Flächen, Erträge und Erzeugung:
Pflanzliche Erzeugnisse (ausg. Gemüse und Obst)
Harvested area, yield and production:
Crop products (excl. vegetables and fruits)
PFLANZLICHE ERZEUGNISSE
(AUSG. GEMUSE UND OBST)
Geerntete Fläche und Erzeugung
CROP PRODUCTS
(EXCL. VEGETABLES AND FRUITS)
Harvested area and production
PRODUITS VEGETAUX
(EXCL. LEGUMES ET FRUITS)
Superficie et production récoltée
EUR 15 EUR 12 Belgique/België Danmark Deutschland Ellada España France Ireland Italia Luxembourg Nederland Österreich Portugal Suomi/Finland Sverige United Kingdom EUR 15 EUR 12 Belgique/België Danmark Deutschland Ellada España France Ireland Italia Luxembourg Nederland Österreich Portugal Suomi/Finland Sverige United Kingdom EUR 15 EUR 12 Belgique/België Danmark Deutschland Blada España France I reland Italia Luxembourg Nederland Österreich Portugal Suomi/Finland Sverige United Kingdom 1000 ha 1992 1993 1994
Getreide (einschl. Reis)
38 495.8 35 572.8 310.6 1 611.9 5 514.5 1 406.6 7 404.4 9 344.7 300.3 4 225.3 29.7 183.4 837.7 752.6 917.3 1 168.0 : 3 488.8
Getreide 38133.8 35 210.8 310.6 1 611.9 6 514.5 1 392.2 7 318.1 9 320.8 300.3 4 008.9 29.7 183.4 837.7 731.5 917.3 1 168.0 3 488.8 35 533.8 32 632.4 312.0 1 437.9 6 223.6 1 373.6 6 425.9 8 542.4 284.9 4 072.9 29.5 186.6 825.0 712.2 923.4 1 153.0 3 030.3 35 201.3 32 262.3 309.4 1 415.3 6 235.4 1 306.9 6 485.7 3 168.5 270.0 4 117.5 29.6 194.1 821.4 688.0 944.6 1 173.0 3 041.8 (ausg. Reis) 35 196.1 32 294.6 312.0 1 437.9 6 223.6 1 354.4 6 378.0 8 516.7 284.9 3 841.2 29.5 186.6 825.0 699.0 923.4 1 153.0 3 030.8
Weizen und Spelz
17 357.1 16 752.0 208.5 582.5 2 598.5 948.2 2 243.1 5 082.0 90.6 2 517.4 8.1 126.9 245.7 280.0 87.9 271.0 2 066.2 15 833.6 15 188.5 203.4 619.4 2 394.6 912.0 2 030.5 4 514.9 79.2 2 299.2 8.4 118.0 241.0 250.0 99.0 305.0 1 759.0 34 830.4 31 891.4 309.4 1 415.3 6 235.4 1 284.1 6 422.7 8 141.3 270.0 3 881.6 29.6 194.1 821.4 666.0 944.6 1 173.0 3 041.8 15 859.7 15 277.7 202.9 573.6 2 434.9 871.4 1 969.7 4 579.8 74.1 2 388.9 9.0 121.5 241.0 241.0 88.9 252.0 1 811.0 " 1995 310.2 1 460.0 6 535.4 1 317.7 6 667.9 8 316.0 276.0 28.8 198.0 814.0 703.7 1 018.5 1 103.0 3 286.2 310.2 1 460.0 6 535.4 1 292.8 6 616.8 8 288.0 276.0 28.8 198.0 814.0 682.0 1 018.5 1 103.0 3 286.2 16 490.0 15 886.7 210.4 614.0 2 587.2 878.7 2 084.5 4 736.0 71.2 2 454.4 9.4 134.7 239.0 251.0 103.3 261.0 1 855.2 j Ï992 181 445.1 170 746.0 1 995.7 6 954.2 34 758.5 5 047.7 ; 14 508.5 60 638.6 2 018.0 19 890.5 152.3 1 378.0 4 292.6 1 340.7 2 596.5 3 810.0 22 063.3 179 273.5 168 574.4 1 995.7 6 954.2 34 758.5 4 946.4 13 944.8 60 513.2 2 018.0 18 618.9 152.3 1 378.0 4 292.6 1 231.0 2 596.5 3 810.0 22 063.3 87 850.3 84 906.6 1 364.4 3 583.0 15 541.7 2 344.3 4 356.8 32 545.8 714.0 8 938.4 46.1 1 016.8 1 325.4 363.0 212.3 1 406.0 14 092.3 1000 t 1993 1994
Cereals (incl. rice)
180 364.6 167 683.7 2 129.0 8 197.9 35 547.4 4 737.5 17 473.6 55 641.1 1 626.5 19 738.2 151.9 1 508.4 4 206.5 1 448.8 3 332.4 5 142.0 19 483.5 175 690.0 163 492.9 2091.1 7 800.0 36 328.7 4 964.0 15 240.0 53 441.0 1 610.0 18 975.3 133.6 1 401.0 4 435.9 1 562.2 3 391.2 4 370.0 19 946.0
Cereals (excl. rice)
178 421.9 165 741.1 2 129.0 8 197.9 35 547.4 4 595.7 17 155.6 55 513.3 1 626.5 18 452.0 151.9 1 508.4 4 206.5 1 379.8 3 332.4 5 142.0 19 483.5 173 553.5 161 356.4 2 091.1 7 800.0 36 328.7 4 790.0 14 832.5 53 317.0 1 610.0 17 659.3 133.6 1 401.0 4 435.9 1 447.2 3 391.2 4 370.0 19 946.0
Wheat and spelt
83 984.9 80 862.4 1 461.7 4 334.4 15 766.5 1 970.0 4 973.0 29 252.2 539.0 8 169.9 48.5 1 034.9 1 018.0 422.0 358.5 1 746.0 12 890.3 85 308.8 82 371.3 1 424.9 3 725.2 16 480.5 2 419.0 4 302.3 30 549.0 572.0 8 104.1 45.2 981.0 1 255.1 454.0 337.4 1 345.0 13 314.0 1995 9 007.0 39 641.0 5 010.4 11 091.0 53 133.0 1 810.3 1 548.4 1 369.0 3 241.9 4 982.0 7 562.9 9 007.0 39 641.0 4 808.4 10 781.0 52 995.0 1 810.3 1 548.4 1 246.0 3 241.9 4 982.0 7 562.9 72 922.9 69 802.9 1 498.5 4 481.0 17 815.0 2 321.3 2 900.0 30 691.0 587.7 8 009.0 53.6 1 166.7 1 168.0 259.0 356.0 1 596.0 20.2 1992 -\ -, _ -50.6 50.7 65.4 61.5 59.8 24.7 19.4 64.0 78.8 35.5 56.6 80.1 53.9 13.0 24.2 51.9 68.2 100 1993
-kg/ha
\ 1994
Céréales -Céréales -53.0 53.2 71.9 70.0 65.8 21.6 24.5 64.8 68.1 35.5 58.0 87.7 42.2 16.9 36.2 57.2 73.3 -j 1995 (incl. riz) -excl. riz)
-Blé et épautre
53.8 53.9 70.2 64.9 67.7 27.8 21.8 66.7 77.2 33.9 50.1 80.8 52.1 18.8 38.0 53.4 73.5 44.2 43.9 71.2 73.0 68.9 26.4 13.9 64.8 82.5 32.6 57.3 86.6 48.9 10.3 34.5 61.1 0.1
Ab 1991 beziehen sich die Daten fur die EU und Deutschland auf den Gebietsstand nach dem 3.10.90 From 1991 the data for the EU and Germany refer to German as constituted after 3.10.90
PFLANZLICHE ERZEUGNISSE
(AUSG. GEMUSE UND OBST)
Geerntete Fläche und Erzeugung
CROP PRODUCTS
(EXCL. VEGETABLES AND FRUITS)
Harvested area and production
PRODUITS VEGETAUX
(EXCL. LEGUMES ET FRUITS)
Superficie et production récoltée
EUR 15 EUR 12 Belgique/België Danmark Deutschland Ellada España France Ireland Italia Luxembourg Nederland Österreich Portugal Suomi/Finland Sverige United Kingdom
EUR 15 EUR 12 Belgique/België Danmark Deutschland Ellada España France Ireland Italia Luxembourg Nederland Österreich Portugal Suomi/Finland Sverige United Kingdom
EUR 15 EUR 12 Belgique/België Danmark Deutschland Ellada España France Ireland Italia Luxembourg Nederland Österreich Portugal Suomi/Finland Sverige United Kingdom 1992 100 1 1993 "
Weichweizen und 11 915.5
13 509.4 208.5 582.5 2 582.6 332.3 1 612.8 4 658.3 90.6 987.8 8.1 126.9 245.7 254.0 87.9 271.0 2 065.0 10 998.2 12 299.0 203.4 619.4 2 385.0 328.9 1 379.0 4 292.9 79.2 889.1 8.4 118.0 241.0 238.0 99.0 305.0 1 757.8
0 ha I 1994 Spelz 10 986.9 12 231.4 202.9 573.6 2 424.0 277.4 1 322.1 4 345.0 74.1 844.9 9.0 121.5 241.0 227.0 88.9 252.0 1 810.0 Winterweichweizen 205.3 567.3 2 521.6 332.3 4 634.1 73.3 987.4 7.6 116.7 226.8 12.3 234.0 197.0 608.7 2 323.7 328.9 4 262.2 57.2 888.2 7.7 99.8 222.4 18.1 272.0 195.5 560.7 2 351.9 277.4 4 315.0 56.2 844.4 8.4 98.6 223.0 11.3 212.0 Sommerweichweizen 3.2 15.2 61.0 24.2 17.3 0.4 0.6 10.2 19.0 75.6 37.0 6.4 10.7 61.3 30.8 22.0 0.9 0.7 18.2 18.5 80.9 33.0 7.4 12.8 72.1 30.0 17.9 0.5 0.6 22.9 17.9 77.6 40.0 1995
11 431.5 12 790.0 210.4 614.0 2 580.2 277.5 1 445.3 4 511.0 71.2 853.4 9.4 134.7 229.0 229.0 103.3 261.0 1 854.0 205.3 598.0 2 538.8 277.5 4 485.0 52.5 8.9 124.9 • • 14.5 222.0 5.1 16.0 41.4 26.0 18.7 0.4 9.8 88.8 39.0 1992
78 808.4 75 864.7 1 364.4 3 583.0 15 472.3 899.4 3 077.7 30 655.4 714.0 4 610.3 46.1 1 016.8 1 325.4 339.0 212.3 1 406.0 14 086.3 1 348.7 3 526.3 15 196.0 899.4 30 528.7 587.0 4 609.5 43.3 946.9 1 251.8 35.2 1 280.0 15.7 56.7 276.3 126.7 127.0 0.8 2.8 69.9 73.6 177.1 126.0
1000 t 1993 1994 !
Soft wheat and spelt 77 078.6 73 956.1 1 461.7 4 334.4 15 720.3 862.0 4 205.0 28 367.6 539.0 4 095.3 48.5 1 034.9 1 018.0 403.0 358.5 1 746.0 12 884.3 77 376.2 74 438.7 1 424.9 3 725.2 16 422.4 838.0 3 294.5 29 505.0 572.0 3 895.4 45.2 981.0 1 255.1 427.0 337.4 1 345.0 13 308.0
Winter soft wheat
1 426.0 4 280.1 15 392.9 862.0 28 217.1 383.0 4 091.4 45.2 892.4 955.6 62.1 1 585.0 1 386.5 3 663.4 16Q39.7 838.0 29 344.0 458.0 3 893.4 42.9 833.8 1 183.8 42.3 1 170.0
Spring soft wheat
35.7 54.2 327.5 150.6 156.0 3.9 3.3 142.5 62.4 296.4 161.0 38.4 61.8 382.7 161.0 114.0 2.0 2.3 147.2 71.3 295.1 175.0 I 1995 65 947.5 62 900.5 1 498.5 4 481.0 17 778.0 !
835.3 i 2 541.0 29 657.0 587.7 4 052.6 53.6 1 166.7 ι 1 095.0 | 235.0 : 356.0 1 596.0 14.2 I I j 1 464.7 4 395.0 17 574.0 !
835.3 : 29 522.0
456.8 ι . 51.3 1 102.7 |
59.0 1 409.0 33.8 86.0 204.0 135.0 130.9 2.3 64.0 297.0 187.0 1992 66.1 56.2 65.4 61.5 59.9 27.1 19.1 65.8 78.8 46.7 56.6 80.1 53.9 13.3 24.2 51.9 68.2 65.7 62.2 60.3 27.1 65.9 80.1 46.7 57.2 81.1 55.2 28.6 54.7 49.7 37.3 45.3 52.4 73.4 23.4 48.8 68.6 38.8 23.4 34.1
1ÖÖ kg/ha
1993 j 1994 j
Blé tendre et 70.1 60.1 71.9 70.0 65.9 26.2 30.5 66.1 68.1 46.1 58.0 87.7 42.2 16.9 36.2 57.2 73.3 72.4 70.3 66.2 26.2 66.2 67.0 46.1 58.7 89.4 43.0 34.3 58.3 70.4 60.9 70.2 64.9 67.8 30.2 24.9 67.9 77.2 46.1 50.1 80.8 52.1 18.8 38.0 53.4 73.5 Ï995 épautre 57.7 49.2 71.2 73.0 68.9 30.1 17.6 65.7 82.5 47.5 57.3 86.6 47.8 10.3 34.5 61.1 0.1
Blé tendre d'hiver
70.9 65.3 68.2 30.2 68.0 81.5 46.1 51.1 84.6 53.1 37.4 55.2 71.4 73.5 69.2 30.1 65.8 87.0 57.4 88.3 40.7 63.5
Blé tendre de printemps
55.6 50.8 53.4 49.0 70.9 44.0 49.8 78.4 33.7 36.6 48.8 51.9 48.2 53.1 53.7 63.7 40.0 36.6 64.3 39.8 38.0 43.8 66.2 53.8 49.3 51.9 70.0 53.2 65.2 33.4 47.9
Ab 1991 beziehen sich die Daten für die EU und Deutschland auf den Gebietsstand nach dem 3.10.90 From 1991 the data for the EU and Germany refer to German as constituted after 3.10.90
A partir de 1991, les données pour l'EU et l'Allemagne se réfèrent au territoire allemand après le 3.10.90
PFLANZLICHE ERZEUGNISSE
(AUSG. GEMUSE UND OBST)
Geerntete Fläche und Erzeugung
CROP PRODUCTS
(EXCL. VEGETABLES AND FRUITS)
Harvested area and production
PRODUITS VEGETAUX
(EXCL. LEGUMES ET FRUITS)
Superficie et production récoltée
EUR 15 EUR 12 Belgique/België Danmark Deutschland Ellada España France Ireland Italia Luxembourg Nederland Österreich Portugal Suomi/Finland Sverige United Kingdom EUR 15 EUR 12 Belgique/België Danmark Deutschland Ellada España France Ireland Italia Luxembourg Nederland Österreich Portugal Suomi/Finland Sverige United Kingdom EUR 15 EUR 12 Belgique/België Danmark Deutschland Ellada España France Ireland Italia Luxembourg Nederland Österreich Portugal Suomi/Finland Sverige United Kingdom 1000 ha
1992 Í993 Ί994
Hartweizen
'· 3 242.5 3 242.5 I 0.0 15.8 615.9 630.3 423.7 -1 529.7 -0.0 26.0 -1.2 Roggen 1 168.4 1 053.6 2.1 88.2 614.6 17.5 179.5 53.8 0.0 8.2 0.4 6.2 69.1 75.0 10.6 35.0 8.1 2 889.5 2 889.5 -0.0 9.6 583.1 651.5 221.9 -1 4-10.-1 -0.0 12.0 -1.2 1 217.3 1 074.9 2.3 78.3 661.8 18.8 174.9 44.8 0.0 8.0 0.4 7.4 73.7 72.5 22.7 46.0 5.8 3 046.3 3 046.3 -0.0 10.9 594.0 647.6 234.8 -1 544.0 -0.0 14.0 -1.0 1 245.1 1 120.4 2.6 88.6 722.5 17.9 153.9 44.8 0.0 7.1 0.4 5.6 77.0 70.0 8.6 39.0 7.0 Wintermenggetreide 31.5 25.7 0.0 10.8 0.0 14.9 0.0 -0.0 -5.8 -26.7 18.8 0.0 -9.6 0.0 9.1 0.0 -0.0 -8.0 -34.7 25.6 0.0 -10.9 0.0 14.7 0.0 -0.0 -9.0 -~~ 1995 3 106.6 3 096.6 -0.0 7.0 601.2 639.2 225.0 -1 60-1.0 -10.0 22.0 -_ 1.2 1 416.5 1 268.3 2.3 98.0 855.6 16.7 160.5 46.0 0.0 7.6 0.4 8.2 88.0 65.0 20.2 40.0 8.0 30.1 20.1 0.0 10.1 0.0 10.0 0.0 -0.0 -10.0
-1992 I
9 041.9 9 041.9 " 0.0 69.4 1 444.9 1 279.1 1 890.4 -4 328.1 -0.0 " 24.0 -6.0 3 816.4 3 376.0 9.1 308.3 2 422.5 42.3 222.2 206.1 0.0 22.6 1.9 34.4 277.8 69.5 26.6 136.0 37.1 85.6 62.5 0.0 -50.5 0.0 12.1 0.0 -0.0 -23.1 -1000 1993 Durum w 6 906.3 6 906.3 -0.0 46.2 1 108.0 768.0 884.5 -4 07-4.6 -0.0 19.0 -6.0 Rye 4 647.0 4 062.5 10.3 355.7 2 983.6 41.7 333.2 177.0 0.0 21.2 1.8 41.2 291.6 66.7 62.9 230.0 30.2 t 1994 heat 7 932.6 7 932.6 -0.0 58.1 1 581.0 1 007.8 1 044.0 -4 208.7 -0.0 27.0 -6.0
4 978.4 * 4 464.4 * 11.9 423.1 3 450.6
4 1 . 0 * 206.7 176.0 0.0 20.3 1.5 26.5 318.8 63.8 22.2 173.0 43.0 Maslin
8 5 . 9 *
5 4 . 9 *
0.0 -47.0 0.0 7.9 * 0.0 -0.0 -31.0
-105.7 *
6 8 . 0 *
0.0
-51.6 0.0 1 6 . 3 *
0.0 -0.0 -37.8 -1995 6 975.4 6 902.4 -0.0 ; 37.0 1 486.0 359.0 1 034.0 -3 956.4 -73.0 24.0 :
-6.0 495.0 4 482.0 36.9 171.0 184.0
0.0 :
20.9 · 42.5 317.0 35.0 58.0 214.0 0.0 -52.0 0.0 9.0 0.0 -0.0
-1992 l
45.9 27.9 -43.8 23.5 20.3 44.6 -28.3 -9.2 -50.0 31.4 32.0 44.3 35.0 39.4 24.2 12.4 38.3 27.4 43.7 55.5 40.2 9.3 25.1 38.9 45.7 27.2 24.3 -46.6 8.1 -100 1993 42.0 23.9 -47.9 19.0 11.8 39.9 -28.9 -15.8 -50.0 37.3 37.8 44.8 45.4 45.1 22.2 19.0 39.5 26.6 46.0 55.7 39.6 9.2 27.7 50.0 52.1 32.1 29.3 -48.9 8.6 -kg/ha 1994 44,3 26.0 -53.2 26.6 15.6 44.5 -27.3 -19.3 -60.0 35.1 39.8 45.8 47.7 47.8 22.9 13.4 39.3 28.6 41.1 47.4 41.4 9.1 25.8 44.4 61.4 30.5 26.5 -47.4 11.1 -1995 Blé dur 37.8 22.3 -52.5 24.7 5.6 46.0 -24.7 -73.0 10.9 -50.0 Seigle 50.5 52.4 22.1 10.7 40.0 27.5 52.0 36.0 5.4 28.7 53.5 0.0 Méteil -51.3 9.0
-Ab 1991 beziehen sich die Daten für die EU und Deutschland auf den Gebietsstand nach dem 3.10.90 From 1991 the data for the EU and Germany refer to German as constituted alter 3.10.90
A partir de 1991, les données pour l'EU et l'Allemagne se réfèrent au territoire allemand après le 3.10.90
PFLANZLICHE ERZEUGNISSE
(AUSG. GEMUSE UND OBST)
Geerntete Fläche und Erzeugung
CROP PRODUCTS
(EXCL. VEGETABLES AND FRUITS)
Harvested area and production
PRODUITS VEGETAUX
(EXCL. LEGUMES ET FRUITS)
Superficie et production récoltée
EUR 15 EUR 12 Belgique/België Danmark Deutschland Ellada España France Ireland Italia Luxembourg Nederland Österreich Portugal Suoml/Finland Sverige United Kingdom EUR 15 EUR 12 Belgique/België Danmark Deutschland Ellada España France Ireland Italia Luxembourg Nederland Österreich Portugal Suomi/Finland Sverige United Kingdom EUR 15 EUR 12 Belgique/België Danmark Deutschland Ellada España France Ireland Italia Luxembourg Nederland Österreich Portugal Suomi/Finland Sverige United Kingdom -Gerste 12 722.8 11 520.4 72.6 910.4 2 408.0 171.2 4 112.0 1 799.8 184.4 450.2 13.7 34.1 275.0 66.7 472.9 454.0 1 297.4
TÖOO ha
i" " 1993 "11 337.2 10192.9 66.1 709.5 2 200.8 167.2 3 540.9 1 622.8 180.8 425.1 13.7 40.0 265.3 61.6 457.7 420.0 1 164.4 Wintergerste 65.8 151.3 1 498.9 171.2 1 642.1 1 357.7 40.3 5.5 6.0 97.0 0.0 0.0 783.7 56.9 174.6 1 463.2 167.2 1 276.9 1 101.8 39.4 5.3 4.4 106.5 0.0 0.0 648.2 Sommergerste 6.8 759.1 909.1 -2 469.9 442.1 144.1 8.1 28.0 178.0 473 454 513.7 9.2 534.9 737.5 -2 -264.1 521.0 141.4 8.4 35.6 158.8 459 420 516.2 1994 10 946.4 9 714.9 57.8 704.4 2 069.5 158.1 3 539.5 1 405.0 169.7 392.5 13.6 43.6 252.7 55.0 504.9 473.0 1 106.2 48.9 182.6 1 290.8 158.1 1 307.3 926.0 31.7 4.8 2.5 105.7 0.0 0.0 626.8 8.9 521.8 778.7 -2 -23-2.1 479.0 138.0 8.8 41.1 147.0 506 473 479.4
L.Jü?L_-11 130.0 9 912.3 55.1 716.0 2 115.4 160.5 3 612.2 1 382.0 180.5 395.3 12.8 35.6 221.0 53.0 543.7 453.0 1 194.0 48.9 181.0 1 448.7 160.5 1 336.4 947.0 37.1 5.9 3.1 : 0.0 28.0 626.8 • 6.2 535.0 666.7 -2 -275.8 435.0 143.4 6.9 32.5 543.7 425.0 567.2 1992 47 194.3 43 260.6 449.6 2 973.7 12 196.5 436.1 6 105.4 10 486.3 1 168.0 1 742.1 70.4 204.0 1 342.1 63.0 1 330.6 1 261.0 7 365.5 421.7 751.9 8 585.5 436.1 2 272.5 8 281.3 306.3 31.0 40.6 519.9 0.0 0.0 4 832.6 27.9 2 221.8 3611.0 -3 8-32.9 2 205.0 861.7 39.4 163.4 822.3 1 331 1 261 2 532.9 1000 t 1993 Bar 47 386.4 42 936.8 390.2 3 369.4 11 005.6 440.0 9 700.8 8 981.4 958.2 1 634.2 68.1 252.2 1 099.6 98.5 1 678.9 1 671.0 6 038.1 Winter 348.3 985.3 7 499.6 440.0 3 307.4 6 286.8 242.0 27.4 29.1 475.3 0.0 0.0 3 716.21 1994 ! ley 43 599.1 38 895.7 346.5 3 446.1 10 902.5 432.0 7 415.5 7 646.0 910.0 1 467.4 59.9 227.6 1 184.4 96.2 1 858.1 1 661.0 5 946.0 barley 307.6 1 005.3 7 534.8 432.0 2 321.7 5 332.0 216.0 25.2 14.2 554.3 0.0 0.0 3 652.0 Spring barley 41.9 2 384.1 3 506.1 -6 393.4 2 694.6 716.2 40.7 223.1 624.3 1 679 1 671 2 321.9 38.9 2 440.8 3 367.8 -5 093.8 2 314.0 694.0 34.7 213.4 630.1 1 858 1 661 2 294.0 1995 43 756.7 39 015.7 346.9 3 864.0 11 925.0 448.0 5 031.0 7 642.0 1 094.6 1 477.9 65.7 202.5 1 135.0 58.0 1 724.0 1 882.0 6 860.0 310.1 1 088.0 9 057.0 448.0 1 596.0 5 554.0 248.6 32.2 18.5 0.0 147.0 4 260.0 36.8 2 776.0 2 868.0 -3 4-35.0 2 088.0 846.1 33.5 184.1 1 724.0 1 735.0 2 600.0 1992 37.1 37.6 61.9 32.7 50.7 25.5 14.8 58.3 63.3 38.7 51.5 59.9 48.8 9.5 28.1 27.8 56.8 64.1 49.7 57.3 25.5 13.8 61.0 76.0 56.0 67.3 53.6 61.7 41.0 29.3 39.7 -15.5 49.9 59.8 48.5 58.3 46.2 28 28 49.3 700 1993 41.8 42.1 59.0 47.5 50.0 26.3 27.4 55.3 53.0 38.4 49.5 63.0 41.4 16.0 36.7 39.8 51.9 61.2 56.4 51.3 26.3 25.9 57.1 61.4 51.6 66.2 44.6 57.3 kg/ha 1994 ; 39.8 40.0 59.9 48.9 52.7 27.3 21.0 54.4 53.6 37.4 44.2 52.2 46.9 17.5 36.8 35.1 53.8 Orge 62.9 55.0 58.4 27.3 17.8 57.6 68.1 52.5 56.6 52.4 58.3 1995 Orge 39.3 39.4 62.9 54.0 56.4 27.9 13.9 55.3 60.6 37.4 51.5 56.9 51.4 10.9 31.7 41.5 57.5 d'hiver 63.4 60.1 62.5 27.9 11.9 58.6 67.0 54.6 59.6 52.5 68.0
Orge de printemps
45.4 44.6 47.5 -28.2 51.7 50.7 48.2 62.6 39.3 37 40 45.0 43.7 46.8 43.2 -22.8 48.3 50.3 39.6 51.9 42.9 37 35 47.9 59.7 51.9 43.0 -15.1 48.0 59.0 48.9 56.7 31.7 40.8 45.8
Ab 1991 beziehen sien die Daten für die EU und Deutschland auf den Gebietsstand nach dem 3.10.90 From 1991 the data for the EU and Germany refer to German as constituted after 3.10.90
A partir de 1991, les données pour l'EU et l'Allemagne se réfèrent au territoire allemand après le 3.10.90