1
University of Southern Queensland
Faculty of Health, Engineering and Sciences
Visualisation of a 3D Cadastre using
Terrestrial Laser Scanning
A dissertation submitted by
Nicholas Gann
In fulfilment of the requirements of
Courses ENG41111 and ENG4112 – Research Project
Towards the Degree of
Bachelor of Spatial Science Honours (BSPH) (Surveying)
Project Report
2
Abstract
Urban Environments are becoming increasingly more populated which is causing a change in society’s lifestyles, modes of transport and ways of living into more vertical forms. This is resulting in the transcending of the cadastre from traditional and historic 2D land parcels into 3D spaces to which are attached complex rights, restrictions and responsibilities. Often the visualisation of these 3D spaces is unclear using archaic two mediums such as survey plans. Given the capability of terrestrial laser scanners to deliver information rich point clouds and 3D datasets, the aim of this dissertation is to investigate the feasibility of using a terrestrial laser scanner to visualise a 3D cadastre.
Firstly, the chosen topic of the dissertation is introduced and discussed, including the definition of the subject problem of the project, justification of the project and the research aims of the project. The second chapter entails the literature review concerning the chosen topic of the dissertation. 3D cadastres are introduced and the legal and administrative aspects of the topic are reviewed. The visualisation side of 3D cadastres is discussed and a review of terrestrial laser scanning and 3D building modelling is entailed. The third chapter outlines the methodology of the project concerning the site selection, resources required and the laser scanning and control surveys.
Chapter four discusses in depth the process of data processing and 3D modelling of the collected point cloud, along with the steps to produce a visualisation of a 3D cadastre using a 3D PDF. Chapter Five discusses and analyses the results of the visualisation of the 3D cadastre using a 3D PDF as well as the accuracy and application implications for this project. Finally the dissertation is wrapped up in Chapter 6 with a review of objectives and some concluding remarks.
3
University of Southern Queensland
Faculty of Health, Engineering and Sciences
ENG4111/ENG4112 Research Project
Limitations of Use
The Council of the University of Southern Queensland, its Faculty of Health, Engineering & Sciences, and the staff of the University of Southern Queensland, do not accept any responsibility for the truth, accuracy or completeness of material contained within or associated with this dissertation.
Persons using all or any part of this material do so at their own risk, and not at the risk of the Council of the University of Southern Queensland, its Faculty of Health, Engineering & Sciences or the staff of the University of Southern Queensland.
4
University of Southern Queensland
Faculty of Health, Engineering and Sciences
ENG4111/ENG4112 Research Project
Certi
fi
cation of Dissertation
I certify that the ideas, designs and experimental work, results, analyses and conclusions set out in this dissertation are entirely my own effort, except where otherwise indicated and acknowledged.
I further certify that the work is original and has not been previously submitted for assessment in any other course or institution, except where specifically stated. Nicholas Gann
0061032599
Signed:
5
Acknowledgements
6
Table of Contents
7
7.0(References(...(104!
8.0(Appendices(...(106!
Appendix(A(0(Project(Specification(...(106(
Appendix(B(0(Field(Notes(of(Laser(Scan(...(107!
Appendix(C(Leica(C10(Datasheet(...(108!
Appendix(D(Strata(Plan(SP90738((NSW)(...(110!
!
8
List of Figures
!
Figure 2.1 Plan View of Strata Subdivision (Registrar Generals Directions 2016)
... 26!
Figure 2.2 Cross Sectional View of Strata Subdivision (Registrar Generals Directions 2016) ... 26!
Figure 2.3 Isometric View of Stratum Subdivision (Registrar Generals Directions 2016) ... 27!
Figure 2.4 Complex and Archival Nature of Present Day Survey Plans (source: Shoejaei et al 2014) ... 29!
Figure 2.5 Visualisation Variables (Source Wang et al. 2012) ... 30!
Figure 2.6 Visualisation of 3D structure using 3D PDF (Source Shoejaei et al. 2014) ... 32!
Figure 2.7 Image of Registered Point Cloud (Bosche 2012) ... 33!
Figure 2.8 Extracted Feature Model from Point Cloud (Bosche 2012) ... 35!
Figure 2.9 Extrusions of Property Boundaries in 3D for Visualisation (Koo et al. 2014) ... 38!
Figure 2.10 3D Model of 3D property (source Poullot and Vasser 2014) ... 39!
Figure 3.1 - Image of chosen site ... 41!
Figure 3.2 - Image of chosen site ... 41!
Figure 3.3 Project Workflow ... 42!
Figure 3.4 - SIX Maps image of selected site ... 43
Figure 3.5 - Strata Plan of Selected Site………43
Figure3.6 - C10 Laser Scanner………..44
Figure 3.7 - Risk Matrix………45
Figure 3.8 - SWMS statement for project……….……46
Figure 3.9 - Laser Scanner setup at the site………..48
9
Figure 3.11 - Creating, Locating, Scanning and Defining B&W Target…...……49
Figure 3.12 - Total Station surveying B&W Targets………50
Figure 3.13 - Scanworld 1 in Leica Cyclone……….51
Figure 3.14 - Inside Scanworld 8 In Leica Cyclone ……….…………52
Figure 4.1 - Creating a Database……….…………..55
Figure 4.2 - Import Menu……….……….56
Figure 4.3 - C5/C10 Import Settings……….………57
Figure 4.4 - Navigation Tree in Leica Cyclone……….58
Figure 4.5 - Raw ScanWorld 1 Import ... 59!
Figure 4.6 - Scanworld 8 Raw Import ... 60
Figure 4.7 - Import of Control File………59
Figure 4.8 - Import of Scanworlds into Registration Menu ………..61
Figure 4.9 - Residuals for Registration of Point Clouds ... 63!
Figure 4.10 - Matching Targets in Overlapping Scanworlds ... 63!
Figure 4.11 - Registered Point Cloud ... 65!
Figure 4.12 - Registered Point Cloud ... 65
Figure 4.13 - Unify Point Cloud………64
Figure 4.14 - Workflow of Feature Extraction and Modelling ... 67
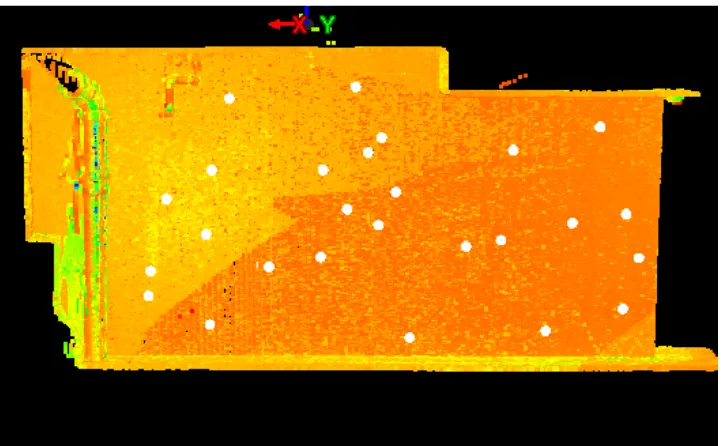
Figure 4.15 - Topographic View of Feature of Interest……….67
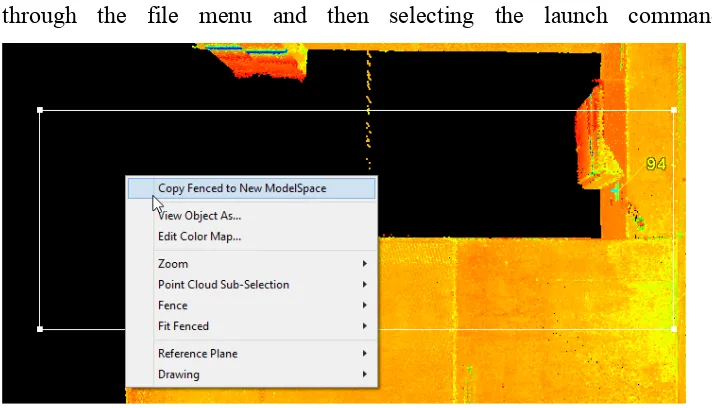
Figure 4.16 Copy fenced selection to new modelspace ... 69!
Figure 4.17 Multi Selecting Points for Region Grow ... 70!
Figure 4.18 Region Grow Statistics ... 71!
Figure 4.19 Created Patch from Region Grow ... 71!
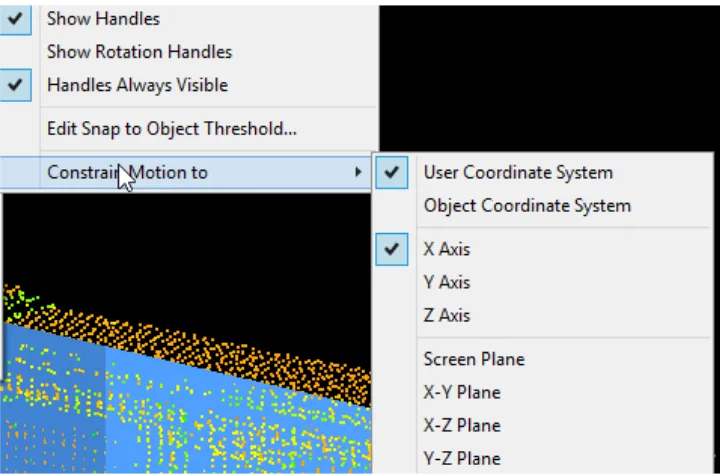
Figure 4.20 Constraning Handle Motion for Patch ... 72!
Figure 4.21 Extruded Patch of Wall ... 73!
10
Figure 4.23 Irregular Wall section ... 75!
Figure 4.24 Isolated Column Point Cloud ... 76!
Figure 4.25 Create Box Pick Points ... 76!
Figure 4.26 Resulting Modelled Column ... 76!
Figure 4.27 Modelling in Progress of the Roof ... 77!
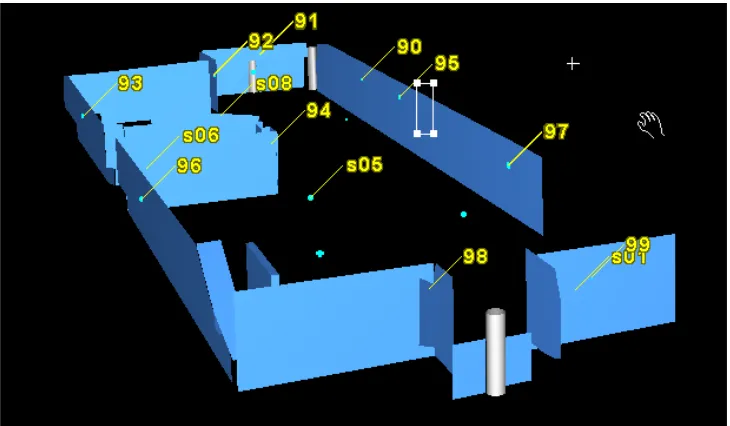
Figure 4.28 Isometric view of completed modelspace ... 78!
Figure 4.29 Internal view of completed model looking north ... 78!
Figure 4.30 Car park Site facing north ... 79!
Figure 4.31 COE Import into AutoCAD ... 80!
Figure 4.32 Imported Model into Civil3D ... 80!
Figure 4.33 Parcels being recreated in AutoCAD ... 82!
Figure 4.34 Process of Measuring a Datum Height ... 83!
Figure 4.35 Datum Height ... 83!
Figure 4.36 Extruded parcels of the site viewed as shaded solids ... 84!
Figure 4.37 Combined Cadastral and 3D Model ... 85!
Figure 4.38 Dimensioning Parcels ... 86!
Figure 4.39 Import of Model into Microstation ... 87
Figure 4.40 View Settings in Microstation………...……….87
Figure 4.41 Print Settings for 3D PDF in Microstation……….88
Figure 4.42 Section View of Model in 3D PDF ... 89
Figure 4.43 Topographic View of Model in 3D PDF ... 90!
Figure 5.1 3D Cadastre within 3D PDF ... 92
Figure 5.2 Viewing Tools in 3D PDF………91
Figure 5.3 Viewing Options in 3D PDF………91
Figure 5.4 Model Tree in 3D PDF……….…92
11
12
Glossary of Terms
3D Cadastre is a system of land administration that purports to represent 3D property and information
AHD Height Datum defined through geometrical levelling
relative to mean sea level around Australia.
Feature Extraction is the process of retrieving and modelling objects from 3D point cloud data.
Georeference the process of aligning point clouds to a real world coordinate system and height datum.
Map Grid of Australia A defined plane coordinate system based on the map projection of the Geodetic Datum of Australia
Point Cloud an array of points collected through laser scanning applications that has defined coordinate information
Registration The process of coalescing multiple point clouds into one model
Strata Plan A plan of subdivision that subdivides a building in
accordance to a strata scheme
Terrestrial Laser Scanner An instrument that is ground based and collects 3D coordinate information of the prevailing environment.
Total Station A measuring device that is capable of recording bearing and distances through electronic distance measurement
13
Nomenclature
2D Two Dimensional
3D Three Dimensional
AHD Australian Height Datum
B&W Black and White Target
CAD Computer Aided Drafting
MGA Map Grid of Australia
PDF Portable Document Format
RL Reduced Level
RRR Rights, Restrictions and Responsibilities
14
Chapter 1 - Introduction
1.1 Background
The increasing densification of our cities and urban environments into high-density residential structures to cater for an ever-growing population are generating numerous data, legal and information challenges to the present cadastral system. Real property is becoming more and more that of three-dimensional spaces as opposed to traditional land parcels, with land use extending above and below ground and beyond the traditional topographic land parcel. The cadastre is the system that encompasses and administers land and property information such as boundaries, ownership and other interests. The cadastre forms the basis of transacting land and real property with surety of ownership through the indefeasibility of title, whereby once the title of a parcel is issued, the ownership of the subject parcel or real property is guaranteed by the state.
Presently in New South Wales, and broadly across many other jurisdictions, the current cadastre predominately caters for two dimensional information, with the cadastre being largely represented and visualised in a two dimensional format through topographical plans and other media such as digital cadastral databases, which map and define the cadastre specified within in a 2D format.
The present cadastral system framework is deficient in managing the associated land property rights, restrictions and responsibilities in terms of those 3D spaces that are typically associated with high-density residential structures. With improvements to technology and more sophisticated equipment such as Terrestrial Laser Scanners, Geographic Information Systems and other software becoming increasingly available and more affordable for mapping and visualisation of complex 3D structures.
15
informative cadastre and allow for greater capabilities in decision-making through a greater understanding of the subsequent RRR’s associated with 3D land parcels and real property.
1.2 Problem Definition
The appropriate administration of the cadastre is critical for ensuring that land and property tenure will continue to serve as a pillar of the economy whereby land holders have their land rights, restrictions and responsibilities unambiguously defined particularly as society moves to increased densification in urban environments.
According to (Shojaei et al., 2013) the present cadastral system is flexible enough to cater for the registration of 3D property and the subsequent RRR’s attached to the 3D property through use of isometric diagrams, cross sectional drawings and textual descriptions. However, a significant benefit of a 3D cadastre should be the capacity for the visualisation of the legal RRR’s and of the parcels themselves. Shojaei et al. (2013) lists the limitations of the prevailing cadastral system in terms of catering for 3D property information as
• Lack of capability to visualise and display geographical, textual and
geometric information of a 3D nature
• Lack of data to enable query, analysis and interactivity with the present
cadastral system to unambiguously view and understand 3D cadastral information.
16
Given the above information, this encouraged me to consider the use of a Terrestrial Laser Scanner (TLS) to visualise a 3D cadastre in order to better conceptualise and understand 3D cadastres across a range of end users.
TLS is capable of providing sub centimetre accuracy when mapping buildings and their inner features such as facades, walls and other furniture through the collection of vast arrays of point cloud data of the prevailing environment; and from which the scanned surfaces and prevailing environment the and subsequent data can be modelled. According to the Leica C10 Technical Datasheet, this particular instrument has accuracy in terms of scan resolution from 0-50mm proportional to range from 0.1-300m, and is capable of recording 360 field of view as a part of the scan resolution. There are also multiple software packages such as CAD and other programs that are presently available, which are capable of providing 3D visualisation of an unlimited number of features.
As such, it is worth due consideration as to whether a TLS can be used to scan a building that embodies 3D property information in reality, but represented in the cadastre by a 2D strata plan. It is aimed for that the scan could be used to visualise the land titles within the building that are laid out in the plan from the subsequent modelling of the scan. From the modelling of the scan, it is aimed to produce a visualised 3D interactive model that enables people to interact with the data collected and enable viewing of the 3D cadastre.
1.3 Research Objectives
The research aims of this project are to investigate the capability of being able to visualise a 3D cadastre using a TLS and evaluate the best methods for the graphic display of this information to end users.
17
information to visualise a 3D cadastre. The visualisation of will also be considered in line with the current guidelines and frameworks for presenting cadastral information.
The literature of using TLS in similar applications will also be reviewed with the aim to understand the processes involved with collecting modelling, extracting and visualising the data for a 3D cadastre. It is aimed to the evaluate the best methods discussed within the literature to achieve a visualisation of the data modelled and extracted in the context of 3D cadastre.
The ultimate objective is produce a model that successfully visualises a 3D cadastre through the use of a TLS that is unambiguous and easy to understand for all end users.
1.4 Justification of Dissertation
This dissertation is a valuable undertaking considering the points made out above. The topic is highly relevant given the increasingly urbanised environments that society inhabits and also that it is considering relatively new and increasingly used technology of TLS and an emerging field of 3D cadastres. It is aimed that regardless of the outcomes or the results of the dissertation, that it will provide a useful insight to the surveying and spatial sciences profession and associated industries as to the feasibility of representing 3D cadastres using a TLS.
This statement is consistent with the course objectives of ENG4111 and ENG4112; whereby the dissertation is targeted to contribute to the literature concerning the topic and to surveying and spatial sciences profession, as well as the final product being of a professional standard.
1.5 Research Scope and Limitations
18
achieving the visualisation of the 3D cadastre, and the subsequent use of the 3D extracted model to produce a 3D cadastre. The means used to visualise the end product will be reviewed also in the literature review but it is not anticipated to involve the fields of Geographic Information Systems or the development of web databases such as Digital Cadastral Database (DCDB).
1.6 Conclusion
19
Chapter 2 - Literature Review
2.1 Introduction
To understand and appreciate the current insights to visualising 3D cadastres and the applications of terrestrial laser scanners; a literature review has been undertaken as a part of the project. The literature entails five sections, including a review of 3D cadastres, the legal aspects of 3D cadastres, visualisation requirements of 3D cadastres, Terrestrial Laser Scanners and finally 3D building models and the cadastre.
2.2 3D Cadastres
The expansion of our urban environments and the construction and inhabitation of multi storey structures above to the creation of transport infrastructure is creating the physical and irregular geometrical property components which extend beyond the traditional 2D medium of the horizontal land boundaries which existing cadastres are orientated towards. Governments, planners, and engineers are increasingly creating more and more complex solutions to cater for an increasing population through extension of real property and infrastructure both above and below the ground.
These developments demand the separation of land parcels and the subsequent rights, restrictions and responsibilities to allow for landowners and other stakeholders to manage their property rights. It is critical for governments, regulatory bodies, corporations and professionals to have a clear understanding and conceptualisation as to the full extent of the cadastre in these urban environments for asset management, service location information, lease and contractual arrangements, disaster response management, navigation, infrastructure expansion and for future planning policy (Jazayeri et al., 2014), (Navratil and Unger, 2013).
20
particular land parcel. The cadastre allows for landholders to own and transact their property for personal and economic interests, protects other landholders and society against adverse affects and allows for government and regulatory authorities to administer their jurisdictions and citizens with confidence
The 3D cadastre is the extension of the cadastre beyond typical 2D land parcels and into 3D spaces above and below ground, As such the 3D cadastre is defined as the vertical separation and registration of 3D space as land parcels and the management of technology, databases and information used to and create, administer and visualise these 3D spaces and the real property comprised within (Guo et al., 2013), (Ho et al., 2013)
Typically the cadastre has focused on the 2D aspects of land parcels. 2D cadastres have created and administered land parcels through the processes of defining boundary lines through physical and anecdotal evidence in relation to the surrounding cadastre from previous land surveys. These plans depict the geometrical nature of the boundaries as determined through survey and the relationship that these boundaries have to improvements (houses, structures etc.) and other monuments such as natural features. Once the plan of survey as become registered with the state, the land parcels within have legal status and being with the titles issued for the subject land parcels..
The 3D cadastre and the associated RRR’s are developed through using the existing 2D parcel as a base to create 3D property entities. For the realisation of a 3D cadastre, the vertical component (height) of the cadastre must be clearly defined and uniformly adopted in order to realise the 3D cadastre.
21
are defined as relative to mean sea level and as such the geoid (Navratil and Unger, 2013)
The adoption of AHD as a vertical datum and the subsequent definition of heights of relative objects to mean seal level, is the common practice in Australia. These AHD heights are derived from documented permanent survey marks that have AHD values, assigned to them, which details can be retrieved from databases such as Survey Control and Information Management System (SCIMS) and the Survey Control Database (SCDB). From these documented permanent survey marks, subsequent heights to other objects and features can be determined relatively to these marks through methods such as conventional geometrical levelling or trigonometrical heighting (Registrar Generals Directions 2015).
The definition of the vertical datum and its origin allows for determination of where the vertical limits of the 3D parcel would lie. Often the determination of the separating boundary between 3D parcels is done so through bounding planes such as ceiling or floors of each level in the case of multi storey buildings. (Navratil and Unger, 2013).
Once defined, these planes serving as monuments for boundary definition and the subsequent determined heights attached as a characteristic of the planes and hence the monuments. This allows for the creation of a 3D cadastre and provides assurances and legal certainty as to the origin of the heights within the cadastre and they have been accurately determined from a common and uniform datum. (Navratil and Unger, 2013)
2.3 Legal and Regulatory Aspects of 3D cadastres
22
According to the paper published by Paulson and Paasch entitled “3D property research from a legal perspective”; there exists several different types of 3D property ownership models.
The most common forms of 3D property are through the condominium concept, which in principle is the ownership of a defined part of a building such as an apartment, and the sharing of common parts of that building with other adjoining landowners in the complex such as apartment gardens entrances and community spaces. Management of these areas extends to an owners corporation, whereby each all owners of the parcels with the building complex are participants in this body by default upon ownership.
The independent 3D model of property ownership is the subdivision of a 3D space from other parts of the building or the alienation of 3D space relative to 2D parcels above or below the subject lot. This form of subdivision is commonly used in the context of building infrastructure such as tunnels or for the separation of different land use types like commercial and residential buildings that are within the same building. This type of segregation of 3D property caters for different stakeholder interests existing in the same condominium complex, and ensures that the property RRR’s are outlined adequately for each type of land use within the apartment building.
Other forms of 3D property ownership include a tenant ownership model, whereby a tenant ownership body owns the apartment building and the tenants contribute funds to the ownership body for the use of their apartment and the condominium rights model, where all owners of the apartments within a building have joint ownership of the common areas and gardens of the complex.
23
establishing 3D property rights discussed by Paulsson and Paasch in their article include:
• The securement of tenure through legal definition of the property in 3D • Increasing the capabilities of the landowner to make changes to the
property as needed
• Improve revenue and taxable capabilities through clearly defined mapping
of the property
• Increased control for landowners over their land or space
• Better land development, planning and urban design from authorities • Registration of Title and of differing land uses within one complex
Strata is a form of vertical land subdivision that involves the segregation of land parcels in terms of height and bounding surfaces within a structure or building. The Strata Scheme Freehold Development Act 1973 and the Strata Scheme Leasehold Development Act (1986) are the two pieces of legislation in NSW that enable strata subdivision within a structure to occur (Deal, 2015). This form of subdivision is akin to the condominium concept outlined above in the article by Paulsson and Paasch. A stratum subdivision is the segregation of parts of a building or structure through limiting a lot in terms of its height in relation to a defined surface.
Presently 3D property information is depicted through strata and stratum plans, whereby key requirements of stratum subdivision in NSW include (Registrar Generals Directions 2016):
• All lots are shown as a cubic space
• A building or structure must be located within the plan
• Lots defined by building structure or other permanent features • Stratum Statements establish a lots limits in terms of height
• Everything that doesn’t form part of a lot is common/ owners corporation
24
In NSW, 3D property is created when the plan of strata subdivision is submitted and registered with the Land and Property Information. Each plan has a unique identifier through the plan number, and titles are created in reference to the parcel notated within the floor plans, this results in the creation of 3D property and the subsequent RRR’s by which owners and other stakeholders can transact such property. Each plan generally consists of a location plan that outline the buildings location to its external boundaries, individual floor plans that outline lot boundaries on each floor and administration sheets.
The limitation in depth for a stratum boundary is in relation to a survey control mark of known AHD height, which is used to define the vertical planes to limit the lot, a bounding vertical plane is often assigned an RL and statements as to where this RL lies such as within the centre of a concrete slab. This in effect creates 3D land parcel. Horizontal Boundaries can be defined through the permanent features such as walls, columns and other building objects or through square distances of the face of these structures (Registrar Generals Directions 2016).
2.4 Visualisation of 3D Cadastres
The visualisation of 3D cadastral information is inherently tied to the legal foundation of 3D property rights, which governs how 3D spaces are subdivided and thus how the property rights, restrictions and responsibilities of those created parcels are created and displayed.
25
(GIS), Land Administration Domain Models (LADM) being current platforms of visualisation for 3D cadastres and 3D data sets. (Shojaei et al., 2013)
A critical factor of visualising a 3D cadastre understands what aspects of data are required to be shown as a part of the cadastral model. Data associated with 3D cadastres can be classified as the following according to (Shojaei et al., 2013)
• Geometric – information associated with the parcel shape and dimensions
such as survey plans, floor plans and other schematic drawings.
• Semantic – the physical characteristics of the building attached to the
parcel or property, such as walls, columns and other structural features
• Land Use – information concerning the nature of land use of the land
parcel and its zoning under appropriate planning legislation
• Legal – data associated with the legal aspects of the cadastre such as
boundaries, common property, easements
• Temporal – data associated with the property and how its use and features
have changed over time
26
Figure 2.1 Plan View of Strata Subdivision (Registrar Generals Directions 2016)
27
Figure 2.3 Isometric View of Stratum Subdivision (Registrar Generals Directions 2016)
Textual descriptions accompanying drafting conventions such as thick and thin lines to denote boundaries that are features and boundaries that are incorporeal the information are used to describe boundary information contained within two-dimensional plans of 3D property (Deal 2015). These textual descriptions aim to convey and assist through dictation as to where boundaries lie in relation to structural entities within the building complex, such as the face of a wall or through the centre of a column and through. There is a no set nomenclature or methods associated with compiling these descriptions that could result in misinterpretation by end users and as such not having an informed view of their 3D RRR’s (AIen, 2011).
Shoejaei et al. (2013) deem such a two dimensional medium as inefficient due to:
• The lack of interactivity associated with plans • The difficulty in interpretability
• Archival storage of these plans once they are registered, and as such
28
• Manual search methods needed to find the particular parcel of interest
and the rights, restrictions and responsibilities that are attached to such a parcel.
AIen (2011) further highlights the limitation of the existing institutional frameworks in which they presently convey the 3D cadastre using the example of the cadastral system of the state of Victoria as a case study, with key limitations including:
• Vertical Information is lacking, being only present in cross sectional
diagrams, if provided at all
• Plans are paper based and archival in nature, and do not truly depict 3D
cadastral information and support 3D information such as colour, texture, shapes and orientation for concise visualisation
• Determinations of dimensions, volumes and other measurements are not
always straightforward.
• Plan interpretation is complex and often requires professional experience
to interpret.
• Lack of continuity and integration with the surrounding cadastre, resulting
in a disjoint of information
• Some RRR’s are not capable of being displayed in present formats,
29
Figure 2.4 Complex and Archival Nature of Present Day Survey Plans (source: Shoejaei et al 2014)
These issues pose several problems to professionals, landowners and stakeholders of the 3D cadastre and the attached 3D RRR’s is costly to landowners, governing and regulatory authorities caused by inefficiencies, lack of dynamism and lack of interpretability in the cadastre. A more effective way of convey the 3D cadastre and its associated information should be considered to convey the information comprised within a 3D cadastre, order to avoid ambiguity associated within interpreting the RRR’s attached to the cadastre and to fully visualise the 3D parcels, their extents and their attributes within.
In order to completely and adequately conceptualise a 3D cadastre, an understanding of the medium of display is necessary. That is to understand what techniques can be used to achieve better visualisation of objects and how can these be applied to the conceptualisation of a 3D cadastre.
30
• Shape – the geometric spacing and nature of an object
• Size – modification of the size of an object, such as a line thickness • Orientation – direction of an object relative to those around it • Texture – the pattern or grain associated with an object • Colour – change in an objects hue without changing its colour • Position – location of an object in relation to others
• Value – the colour of an object
Figure 2.5 Visualisation Variables (Source Wang et al. 2012)
The key to the effectiveness of the 3D cadastre is ensuring that the appropriate information is visualised in a way that is unambiguous and easily interpretable. Wang et al. again elaborates on the appropriate information that should be incorporated into the visualisation component of a 3D cadastre;
These include:
• Representation of Partial and Bounded Property Units – display of the
nature and extent of 3D property units
• Interrelationships between 3D parcels and 2D parcels clearly shown – • Visualisation of spatial relationships between legal and physical objects -
31
• Visualisation of interrelationships between legal entities – the nature of
where one 3D property unit lies in relation to other 3D property parcels surrounding it
• Labelling with dimensions and measurements – display of official
dimensions and volumes of 3D property units within the visualisation The article by (Shojaei et al., 2013) reinforces some of the visualisation requirements of 3D cadastres above including dimensioning of parcels and the relationship between 3D entities. The authors elaborate on the use of lines styles and thicknesses, object transparency and use of symbols as tools to enhance visualisation of a 3D cadastre.
They also state another key consideration as to the visualisation of the 3D cadastre are query and analysis functionality within the medium of display of the 3D cadastre to allow for traceability of infrastructure networks, to find adjacent 3D property objects to analyse 3D property RRR’s and the topological relation of 3D property with other objects. The capability of the 3D cadastre to provide a multitude of views such as cross sectional, topographical and isometric views through interactivity with the 3D cadastre.
32
Figure 2.6 Visualisation of 3D structure using 3D PDF (Source Shoejaei et al. 2014)
2.5 Terrestrial Laser Scanning
Terrestrial Laser Scanning (TLS) are survey instruments capable of high volume and high precision data acquisition in the form of point clouds. TLS have a wide range of applications, including the capability of high accuracy of external and internal building feature mapping (Jazayeri et al., 2014)
33
Figure 2.7 Image of Registered Point Cloud (Bosche 2012)
To achieve a holistic and concise suite of data of the features being scanned, multiple scans of the scene from different locations within the site must be congealed together. Scan Registration is the process orientating, aligning and conjoining multiple scans obtained from different locations of the prevailing environment to one and other to a common coordinate system and datum. The registration methods can vary and are outlined as follows:
• Manual point selection - iterative selection of corresponding points within
a scan such as a corner of a building to mesh together consecutive point clouds.
• Target based matching - the manual selection of a defined target within a
scan to align multiple scans together, with these points serving a tie point between the scans.
• Feature Based Matching involves the matching of congruent lines,
surfaces and shapes such as walls, roofs, columns and other structures common within scans.
34
A further critical process of the procurement of data from a point cloud is the georeferencing of the point cloud. Georeferencing is discusses in the article by (Fan et al., 2015) as the process of transforming the point cloud from an arbitrary coordinate system to a real world coordinate system and datum for representation of real world environments. This transformation is achieved most commonly through the target-based method, whereby total stations or GNSS is used to survey the targets and is subsequently connected to survey marks with known real world coordinate values. Other processes of georeferencing discussed by Fan et al. include surface matching whereby common arbitrary and real world surfaces are aligned together and direct georeferencing, whereby the TLS is integrated with survey devices such as GNSS simultaneously, resulting in the scan being produced directly with real world coordinates.
The transformation process between arbitrary and real world coordinate systems is conducted within software such as Leica Cyclone and involves the selection of points (targets) which are present in both the arbitrary and real world coordinate systems, from which a rotation matrix is determined from the selected arbitrary points in relation to the real world points as well as a translation vector between the coordinate sets (Fan et al 2015).
The point cloud is subsequently transformed from the arbitrary coordinate system to a real world coordinate system. Least squares processes are used to verify the quality of the transformation with residual coordinates generated from the adjustment in terms of the point cloud in its entirety and the target constraints of the point cloud.
The article by (Hong et al., 2015) describes the process of reducing the point cloud into extracted model which displays the captured scene as a reduced 3D model. The RANSAC (RANdom SAmple Concencus) is a commonly used mathematical algorithm within processing software that extracts geometrical planes out of point clouds.
35
the points away from the planar surfaces. The algorithm is iteratively run and generates planes through the points selected and from the other points that fit within the specifications of the parameters set. The algorithm is continually run until a confidence interval of 95% is achieved for all points lying within the same plane, with errors determined as the measured normal distance of the other outlying points in relation to the generated plane through the selected and iterated points.
This process filters out noisy data; that is data that is generated from the laser scanning that doesn’t form part of the prevailing environment and its generated from backscatter from reflective surfaces or other interruptions that occurred throughout the data collection phase (Bosché, 2012)
This leads to the generation of planar surfaces, from which a surface’s or planes 3D geometry can be created through extruding the developed plane through the selection of minimum and maximum points for the value range of the Z (height value) of the surface from the point cloud or by a known value if stated. This in effect creates a 3D wireframe of the subject surface and as such serves as the basis of the 3D model (Hong et al., 2015)
36
2.6 3D Building Models
Building Information Models (BIM) are an increasingly common form of building and facilities management. BIM is an information tool in the form of a fully interactive 3D model that enables the management of a building and its subsequent components over the course of its lifetime. The BIM is a tool that and enables interactivity, graphical interpretation and informed decision making to occur about the management of a building or structure over the course of its lifetime (Jazayeri et al., 2014)
The BIM form as a 3D model provides greater understanding to complex spatial relationships between various components of the model and hence the building, particularly in the context of dense and heavily populated urban environments. It provides rich geometrical and spatial datasets that allow for informed decision through the provision of a 3D model that provides visualisation of all internal and external building components. 3D models and BIM are highly suited to managing and displaying the internals of a building, with datasets acquired through the use of terrestrial laser scanners which provide large datasets concerning the geometric internals of the building. The collection of the data allows for the production of 3D as-built information of the internals of the building, including information such as ceiling heights, wall dimensions, room volumes and other structural information; all of which can be processed and integrated into a 3D model (Hong et al., 2015)
A key component of a building is its 3D property and land information. Given the aim of a BIM is to provide holistic building and structural management; there has been an effort to gauge the usefulness of integrating 3D property rights into a BIM as to how effective this is in administering the cadastre. Methods to visualise and represent the cadastre could incorporate techniques such as using transparency on the parcel and modifying line styles, thicknesses, colours and shapes within the 3D model (Jazayeri et al., 2014)
37
construction of a building or structure. The use of building information models to manage 3D property RRR’s of a building or structure can be applied in such in the contexts of definition the limits of excavation spaces underneath other property for access to services or for underground construction for infrastructure such as tunnels to prevent encroachment or damage to the adjoining properties and to enforce buffer distances of these kinds of projects (El-Mekawy et al., 2014) The same authors also discuss the use of BIM to display 3D property boundaries to illustrate the full extent of 3D boundaries above and below the ground to inform users of the full extent of the 3D cadastre and prevent encroachment onto neighbouring properties. The case of using BIM models to display common boundaries between two apartments, which may lie within a concrete slab or wall, is a cited example of the application of this principle.
38
Figure 2.9 Extrusions of Property Boundaries in 3D for Visualisation (Koo et al. 2014)
39
Figure 2.10 3D Model of 3D property (source Poullot and Vasser 2014)
2.7 Conclusion
40
Chapter 3 - Methodology
3.1 Introduction
This chapter discusses the methodology and processes associated with visualising a 3D Cadastre using a Terrestrial Laser Scanner. It is aimed to elaborate on topics such as identifying a suitable site possessing desirable features for the collection of field data for the project, outline the resources and equipment required for the project, as well as the methodology for the field surveys and, briefly, data processing and 3D modelling for visualising a 3D cadastre for the project.
3.2 Site Selection
Of critical importance to developing a visualisation of a 3D cadastre is selecting a site that firstly satisfies the criteria required. A suitable site would ideally possess the following characteristics:
• Readily and freely accessible
• Already in effect has a 3D cadastre and has survey information available • Possesses multiple land parcels proximate to one and other
• Possesses a range of different cadastre elements such as common property
and private titles
• Not requiring access to private property.
• Equipment able to be transported to and used at the site
Considering the above criteria and given the examples discussed in the literature review; it is obvious that an apartment building would be the ideal choice for the field work to occur given it is an embodiment of 3D property itself and has a range of cadastral elements.
41
As such, the site chosen is a car park basement located in St. Leonards NSW. The site encompasses numerous car parks and has a registered strata plan (SP90738) that implies the presence of a 3D cadastre and of 3D property units. Images of the chosen site and the part of the registered strata plan are shown as follows:
Figure 3.11 - Image of chosen site
Figure 3.12 - Image of chosen site
42
3.3 Methodology
The project is comprised of numerous steps and was completed in a staged process given the data that had to be acquired, processed and then manipulated.
Figure 13.3 Project Workflow
Field Work Organise Reources and Survey Information for Field Suvey
Setup site with Targets for laser
scan
Use TLS to complete a laser
scan of the site
Use Total Station to survey the scan stations and targets of the site
Connect surveyed targets
and stations to known survey datum and control for georeferencing Data Processing Import collected scans into Leica
Cyclone
Complete Target matching and identification within each scan
Create control file of targets on known
survey datums for georeferecing
Import control file into Leica Cyclone and register point
cloud
Unfiy and filter the point cloud of
noisy data
3D Modelling
Begin extraction from point cloud
model
Extract features from Point Cloud
for model in Leica Cyclone Refine extracted features Export extracted features into CAD for integration of cadastral information Recreate Cadastral information from registered plan Convert cadastral information to 3D Incorporate cadastral information into extracted model Visualise synthesised model as appropriate
43
The aim of breaking down the project into a workflow was to enable a clear path of critical tasks that had to be completed in attainment of the objective of visualisation of a 3D cadastre using Terrestrial Laser Scanning.
3.5 Field Survey
3.5.1 Search and Field Survey Planning
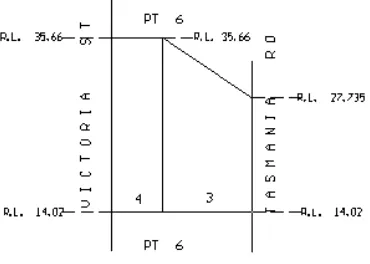
Prior to the commencement of the field survey, the necessary resources and search information was required to be gathered before the survey could commence. Firstly, once an appropriate site was identified, a search of the appropriate cadastral information was undertaken through the Spatial Information eXchange (SIX) portal, which is a NSW government database and mapping platform that comprises all survey information in NSW.
From this database, the registered Strata Plan (SP) for the site was identified as being SP90738, which contains the land title and survey information for the site. The same portal was also used to retrieve information about permanent survey marks nearby which had known values for MGA coordinates as well as AHD height. The information was then ordered and their location is subsequently shown in the following figure:
44
Once this information was collected, the necessary resources were identified and organised so the field survey could commence. The resources required for the laser scanning survey and the total station field survey respectively is listed as follows:
• Leica C10 Terrestrial Laser Scanner • 3x Tripods
• Black and White Paper Scanning Targets • Measuring Tape
• Trimble S8 Total Station • TSC3 Data Collector
45
• Mini Prism
• 2 x Traverse Prisms
The Leica C10 Laser scanner is marketed by Leica Geosystems as “An all in one laser scanner for any application” and is described as a compact, easy to use and learn and as a highly versatile scanning station; with a scan rate up 50,000 points per second and positional accuracy of 5mm at 50 meters (Leica HDS Datasheet). Given the Leica C10’s specifications as stated by the manufacturer, which can be seen in Appendix C.
It is highly apparent that this instrument is well suited and applicable to the field survey being undertaken.
3.5.2 Risk Analysis and SWMS
As a part of any work activity conducted, there may exist inherent risks posed to individuals and the environment that may realise harm as a consequence of completing the task at hand. A hazard is a source of harm that may pose or cause personal injury or environmental damage as a result of an activity occurring, whilst a risk is the degree of likelihood that such a hazard should eventuate. A requirement of the of managing these risks is the development, adherence to and implementation of a Safe Work Method Statement (SWMS), which aims to assess work methods involved with work tasks and assess the likely occurrence of these events, with the goal of mitigating or reducing the risks involved with work practices. The risk matrix works by evaluating the task at hand and identifying the associated risk factors with those tasks, to which a rating is assigned to that task.
46 RISK ASSESSMENT
MATRIX
LIKELIHOOD: HOW LIKELY IS IT TO HAPPEN AND HOW OFTEN?
CONSEQUENCES: HOW BAD IS IT LIKELY TO BE?
A - Very Likely B - Likely C- Possible D - Unlikely: Very Unlikely:
1 - Extreme: Death or cause permanent injury/damage
1A 1B 1C 1D 1E
2- Major: Long term injury or major damage
2A 2B 2C 2D 2E
3 - Moderate:
Moderate Injury or damage
3A 3B 3C 3D 3E
4- Minor: Minor first aid required or
minor/no damage. 4A 4B 4C 4D 4E
Figure 3.7 Risk Matrix
Once hazard identification and a risk assessment has taken place, a hierarchy of controls can then be applied to moderate the risks associated with the tasks and then a mitigated risk rating can be applied to the controlled situation. Some of the potential hazards that were identified in association with this task are identified in the following table.
Job Safety and Health Analysis
Task Hazard Grade Controls Mitigated
47 Conduct Field Survey on/adjacent to roadways and Field Site
Live Traffic 1C Wear High
Visibility Clothing Use, Traffic Control Devices (Cones, signs), Do not walk on roadway
3D
Pedestrians 3D Use traffic
Control Devices to segregate Instrument and work zone 4E
Slips, Trips and Falls 3C Be Aware of
surroundings 4D
Poor Lighting (Carpark Basement)
4D Wear High
Visibility Clothing 4E Use of Laser Scanner and Total Station
Class 3R Lasers 2E Don’t set
instrument at eye height to prevent damage, Display warning
signs.
2E
Figure 3.8 SWMS for Project
3.5.3 TLS Field Survey
48
of setting up and essentially being able to have as many unique targets as possible available for the survey as required. The B&W targets are circular in shape and have contrasting black and white sectors within the circle, and are specifically designed so that the algorithms within the scanner and Leica Cyclone software can identify them automatically within a certain range of the scan station.
The process of placing targets around the site that is being scanned is a crucial part of both the TLS field survey and the subsequent data processing that occurs after the field survey, as it provides an efficient and effective means of incorporating control into the point cloud. The targets can then be surveyed through conventional means to allow the point cloud to be geo-referenced and to facilitate the registration process of joining multiple clouds together. As such, it was an objective during the survey that each scan would have at least four B&W targets visible within each scan to ensure that sufficient control was present within each scan to enable accurate registration. At least two targets are required to be present within each scan for it to be able to be coordinated through the use of the B&W targets and to facilitate the registration of individual scan worlds to on and other.
Given the relatively small and enclosed nature of the site, 10 B&W targets were placed across the site on walls using masking tape. The main considerations to placing these B&W around the site was to ensure that as many as possible would be visible from the chosen scan stations. The field notes denotes in appendix B show the placement of these black and white targets around the site along with the target identifiers.
49
Figure 3.9 and 3.10 - Images of TLS set up at selected site
Another important consideration prior to the commencement of any scanning for any project is the selection of a scan resolution. For this TLS application, the medium resolution was chosen which scans a point at a ratio of a grid pattern of 100mm at a 100m range and each scan has a duration of six minutes which was deemed more than sufficient for this application. Other options available to the operator for scanning resolution are a low resolution which has a ratio of 200mm grid at a 100m range for a duration of about two minutes, whilst a high scan resolution option has a scan ratio of 50mm grid at a 100 metre range for a duration of approximately 25 minutes per scan.
50
a) Creating b) Locating
c) Scanning d) Definition
Figure 3.11 Process of Target Definition (Creation, Locating, Scanning, Definition)
51
It should also be noted that the two common property areas being service cupboards at the southern and northern ends of the basements were not surveyed as a part of this project, as they were inaccessible at the time of survey.
3.5.4 Field Survey using Total Station
The next step of the process would be to conduct the field survey using the Trimble S8 Total station. This field survey is aimed at connecting to survey marks that have defined Map Grid Australia (MGA) and AHD heights in order to geo-reference the scanned scenes. The survey control for the project was obtained from the survey marks SS49348 and SS85252, both of which have known MGA coordinates and AHD height.
This part of the project first commenced in the basement where the B&W targets and terrestrial laser scanning stations were located. An arbitrary azimuth was set to a backsight and each target was subsequently measured in face left (FL) and face right (FR) using the measure rounds function within the Trimble TSC3 controller, with some scanning stations surveyed for additional control coordinates for the terrestrial laser scanning survey.
A conventional survey traverse was commenced out of the basement to connect to the permanent survey marks mentioned above. All up 7 survey stations were required to connect to these permanent survey marks and Comma Separated Values (CSV) of all the data was exported which contains each points name, easting northing and height. This will enable the arbitrary data to be rotated and translated to the datum’s of MGA and AHD in the CAD program Terramodel in the data processing stage of the project.
52
3.6 Data Processing
The next phase would involve the reduction of the point clouds through using the Leica Cyclone software. According to the Leica Cyclone datasheet, the software program comprises of numerous modules which include as Register, Survey, Model, Viewer, Importer, Publisher and Basic. There are also other modules such as Cloudworx, which is a plug in for AutoCAD, Microstation and other software packages to allow for data processing of point clouds within the familiarity of the widely these widely used suites. Each of these modules are licensed and available for purchase individually.
Firstly a database and project were established which then enabled the collected scans to be imported into Cyclone, with each scan appearing within the program as its own scan world. This allowed for the viewing of each of the scan worlds individually where the data can be interactively through the model space of each scan world. The viewing of the scan world individually allows for identification of individual features and targets, this can be clearly seen in the following figures where the targets are annotated with their respective identifier as picked during the target definition process previously discussed.
.
53
Once each Scanworld is imported, it is necessary that all the targets be appropriately identified within each scan in order to facilitate the registration process. Each identified target that was not picked and defined within a name during the scan has a blue crosshair attached to it, but can be named through clicking on the crosshair.
The targets facilitate the registration and the geo referencing processes which both occur simultaneously as a part of the registration process. The geo referencing occurs through the importation of a .txt file that is generated from the translating the arbitrary total station onto the real world datums of MGA and AHD within Terramodel.
The registration process works through constraints that are accessed through the register menu of Cyclone. The types of constraints that can be selected include cloud-to-cloud constraint, Target ID only constraints and the visual registration which involves the iterative selection of points that are common to one and other within differing point clouds. Residuals for errors are provided during the registration process in terms of how matching targets within a scan world, which is indicative of the errors involved in the congealing process of the individual point clouds. Finally, the point cloud can then be unified and filtered of noisy and unwanted data to allow for modelling of the registered point cloud and creation of a 3D model.
54
3.6 3D Modelling
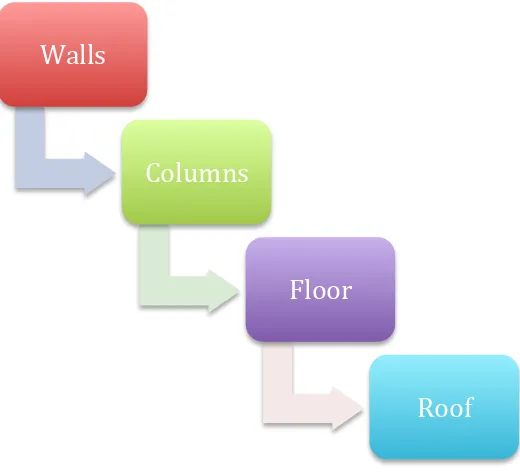
The process of 3D modelling can commence once the final unified point cloud is produced. The aim of the 3D modelling is to create, from the point cloud, all the structural features within a point cloud through extracting the surfaces and shapes of objects.
The process of creating a 3D model is performed within Leica Cyclone which possesses multiple tools to create objects from point clouds such as region grow, create box, create cylinder, extract surface plus a range of other options to cater for the accurate modelling of a broad range of possible objects found in the real world. These processes are generally similar in the way that they are executed within Cyclone, and involves the iterative selection of points on a surface or object, and then the software running an algorithm to extract the geometry of the subject objects from the chosen points of the point cloud.
These process are repetitive in nature and was performed multiple times in order to refine the extracted features to ensure that they were geometrically representative of actual feature in reality and to ensure that it was survey accurate. The extracted features were then edited using tools within Leica Cyclone such as merge, extend patch and align to axis to further develop the 3D model. Again this process was repeated numerous times to ensure a truly representative 3D Model of the site were created.
Once a final model is obtained and satisfactorily created, the objects are exported into AutoCAD Civil 3D in the format of the Cyclone Objects Exchange (COE), which exports the features from Leica Cyclone to either AutoCAD or Microstation in the form of objects classed as meshes, surface, 3D solids or polylines. From here, the imported objects can be classified into layers to control the visualisation and future modelling of the features.
55
created using conventional CAD methods and then extruded using the extrude function to extrude the parcels vertically and by doing so converting them into 3D. The parcels are then aligned to the 3D model of the site to synthesise the two datasets together and the appropriate textual information concerning the cadastral information of the site is also added into the model to enhance the effectiveness of the visualisation.
Once this process is complete, the combined model is then exported to Microstation in the form of a DWG for creating of the 3D PDF. Microstation was chosen as the software to print the 3D PDF as it embodies an inbuilt capability to print 3D PDFs without requiring the purchase or acquisition of additional third party software and information on how to edit and modify the end product is broadly and freely available. This process is the final in a series of the steps of using a TLS to visualise a 3D Cadastre with the output of the final 3D PDF that can be interactively manipulated to view the cadastral data.
3.7 Conclusion
56
Chapter 4 - 3D Modelling and Results
4.1 Introduction
This chapter describes the data processing and 3D modelling phase of the project. The methods of registering the point clouds that were acquired from the field survey and the processes of feature extraction are discussed. The steps of synthesising the extracted model and the 3D cadastre of the site are then described and the visualisation of a 3D cadastre is also presented in this chapter.
4.2 Import into Leica Cyclone
Once all the data is collected by the field survey the phase of processing and modelling the collected data can then commence. Processing of a 3D point cloud is the methods whereby the point clouds are imported in to 3D laser scanning software where the data within the clouds can be interactively manipulated and viewed as well as having the data extracted from the point clouds. The software package chosen for this step is Leica HDS Cyclone, which is marketed as an industry leading package for point cloud manipulation, robust model creation and other survey and geographic datasets that are rich in data by nature for a variety of engineering, construction and architectural applications.
Leica Cyclone comprises of several modules being Register, Survey, Basic, Model, Importer and Server for flexible customisation of the software to suit individual requirements. For the application of visualisation of a 3D Cadastre, the modules that will be used are register and model that allow for the registration and data modelling of point clouds respectively.
57
the database can be entered which results in the creation of the database where the project and all its data including control files, scan worlds and models will be stored within the software as a .imp file, which can be used to import that database into any Cyclone package. Once this step is done, the project can then be created through right clicking on the database and then selecting create project, which allows for the entering of the project name in the prompted window. The scanning project can then be imported from the laser scanner into the project once the preceding steps have occurred. This is done through file > import > import c5/c10 data which prompts a directory to find the files to be imported.
Once the files are selected, it prompts with the menu shown in figure 4.3. It is important at this point to have the box find black and white targets ticked, which were used as the targets for survey control during the field survey. This will automate the identification of these targets within each of the scan worlds that are being imported through an algorithm in the software and will help streamline the registration process.
58
The resulting scanworlds can then be interactively viewed once the import is complete through the navigation tree of the database and the project, with a total of 9 scanworlds being imported into the project. The navigation tree menu lists the names of all the projects and their scanworlds and the individual files within these scan worlds in the format of hierarchy that is easy to navigate and view individual parts of the project.
Upon expanding a scanworld folder by clicking on any project, there exists four sub levels of the navigation tree hierarchy being the scanworld, control space and model space, which upon selection open up a new window containing specific information. Each scanworld and registration has the same sub menu and the items are described as follows:
• The Control Space contains the targets and control points that have been
used in the registration process of the point cloud. The control space is in essence locked from editing to prevent any erroneous data manipulation or loss and can only be updated through editing the model space.
• The Model Space is the workspace where all the data manipulation and
feature extraction of the point clouds occurs. It has a sub menu which is the Model Space Viewer which is where an edited or changed point cloud can be viewed and features extracted and where 3D modelling takes place
• The Scan sub menu is where the original scanworld as which has all the
data collected in the field by the TLS and contains the original data. It also contains the scans of the targets that were defined within that scan through the scan target process discussed in Chapter 3.
59
Figure 4.4 Navigation Tree Hierarchy
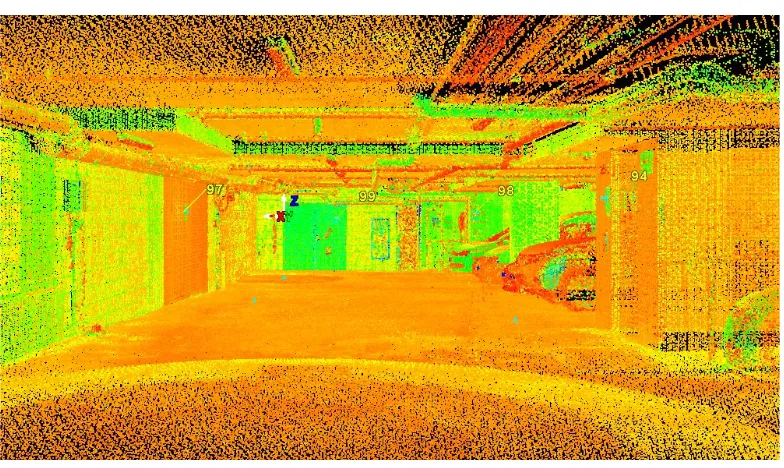
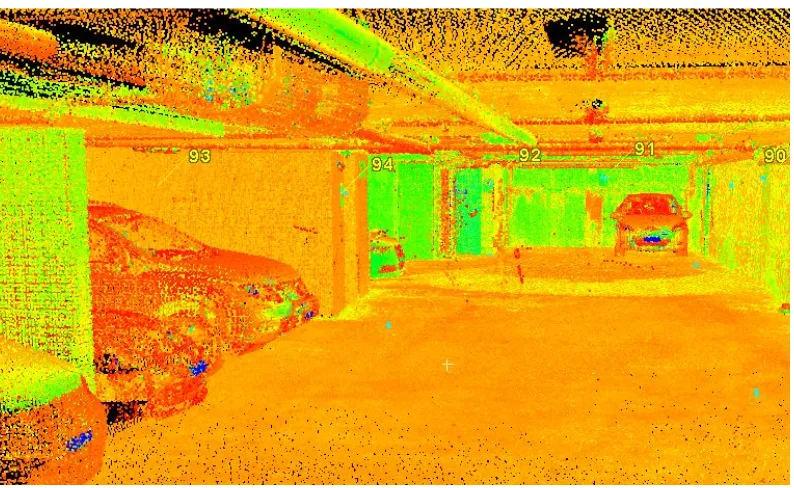
Once the scanworlds have been imported they can be individually viewed and analysed. This step is useful as helps identify the data contained within each scan. The following images shown below illustrate the raw scan import into Cyclone before any registration or manipulation has occurred.
60
Figure 4.6 Scanworld 8 Raw Import
Before proceeding to the
registration and
georeferencing phase of the project, the control file which was obtained as previously mentioned by using the the total station to survey all the B&W targets at the site and then subsequently connected to permanent survey marks to obtain MGA and AHD values. The control file was reduced and rotated in the TerraModel Survey software and exported as an ASCII .txt fie.
61
The same file can be imported into Leica Cyclone through the same import process used to import the scan worlds, but changing the file type extension to a .txt in the selection box at the bottom of the window and then subsequently selecting the control file. The Imported file can be seen in Figure 4.6 and shows the reduced MGA and AHD values for each of the target points. This will facilitate the registration each of the scan worlds to these real world coordinate and datum values.
4.3 Registration of ScanWorlds
Once the point clouds and the control file have been imported into Leica Cyclone
through the methods aforementioned above, the registration process and by consequence the geo-referencing of the point clouds and subsequent model can commence. As discussed previously, it was an objective during the field survey that to have where possible at least four B&W targets visible from each scanning station and coincident to at least two scanworlds within the project. This was to ensure adequate redundancies for the registration process whereby matching coincident targets are used to align the overlapping scanworlds to one and other to create a registered point cloud.
62
Figure 4.8 Import Scanworlds to Registration
Once all the scanworlds and the control file have been imported into the registration menu and before the actual registration process can be commenced, a home world scan must be set. This is the scan or coordinate system to which all the other scans within the project will be registered to. Given the control file that was imported contains all the MGA and AHD values for all of the B&W targets placed around the site, it is highly appropriate to set this as the home world scan as this will enable the registered point cloud to be geo referenced through the same process.
Once the home world is set, the registration process can commence. For this project, it is intended to use the constraints of the B&W target so