White Rose Research Online URL for this paper:
http://eprints.whiterose.ac.uk/108549/
Version: Accepted Version
Article:
Rhodes, E.J. (2015) Dating sediments using potassium feldspar single-grain IRSL: Initial
methodological considerations. Quaternary International, 362. pp. 14-22. ISSN 1040-6182
https://doi.org/10.1016/j.quaint.2014.12.012
[email protected]
https://eprints.whiterose.ac.uk/
Reuse
This article is distributed under the terms of the Creative Commons Attribution-NonCommercial-NoDerivs
(CC BY-NC-ND) licence. This licence only allows you to download this work and share it with others as long
as you credit the authors, but you can’t change the article in any way or use it commercially. More
information and the full terms of the licence here: https://creativecommons.org/licenses/
Takedown
If you consider content in White Rose Research Online to be in breach of UK law, please notify us by
1
Dating sediments using potassium feldspar single-grain IRSL: Initial
methodological considerations
Edward J. Rhodes
a, b *a Department of Geography, University of Sheffield, Winter Street, Sheffield S10 2TN, United Kingdom
b Department of Earth, Planetary, and Space Sciences, University of California, Los Angeles, Los Angeles, CA 90095, USA
Publication in press
Quaternary International (2014), http://dx.doi.org/10.1016/j.quaint.2014.12.012
ABSTRACT
Potassium feldspar shows good potential for luminescence dating of Quaternary sediments in several locations assessed, including California, Tibet, Mongolia, Spain, Egypt, the UK and New Zealand. In many of these locations feldspar has particular importance owing to the low sensitivity of quartz OSL (optically stimulated luminescence) signals observed. Potassium feldspar-rich mineral fractions of sand-sized grains from a range of fluvial, alluvial, lake shoreline and glacial contexts were separated, and equivalent dose and fading determinations performed for single grains, besides conventional multiple-grain aliquots in some cases, using a protocol modified from a post-infra-red IRSL (post-infra-red stimulated luminescence) procedure. Most samples, but not all, contain a significant proportion of grains that provide IRSL signals sufficiently sensitive to determine equivalent dose values. Two main types of response have been observed. One group of samples displays regular behavior, with the majority of grains providing either a uniform equivalent dose (De) value for well-bleached samples, or a uniform minimum dose value with many higher values, presumably caused by incomplete zeroing. Uniform De values (or minimum values) suggest that the magnitude of signal reduction by anomalous fading for grains of different sensitivity is the same for all grains. A second common pattern of behavior is observed; for these samples, the minimum equivalent dose value is greater for grains with higher sensitivities. A surprising feature of this behavior for a subset of samples is an apparent saturating stretched exponential relationship between minimum equivalent dose and IRSL sensitivity. Samples in both groups contain rare grains with significantly lower De values, interpreted as intrusive grains, probably introduced by bioturbation. This paper provides an initial survey of results, and briefly explores single-grain fading determination, besides comparisons of age estimates between different methods. An improved separation method to isolate the most sensitive grains referred to as “Super-K” is introduced, resulting in significant enhancement of the number of grains with bright IRSL signals.
Keywords: Infrared stimulated luminescence, post-IR IRSL, Single-grain, Super-K, Alluvial fans, Quaternary sediments
* Department of Geography, University of Sheffield, Winter Street, Sheffield S10 2TN, United Kingdom Email addresses: [email protected] , [email protected]
1. Introduction
Several reasons to attempt luminescence sediment dating using the IRSL signals of feldspar grains exist, but perhaps the most important is to overcome limitations imposed by poor quartz OSL characteristics. These limitations can include low quartz OSL signal sensitivity, high or variable thermal transfer signals, low saturation dose characteristics, or other forms of irregular behavior. Many publications have drawn attention to poor or limiting characteristics of quartz OSL in mountainous, glaciated and/or tectonically-active areas, for example Smith et al. (1990; UK glacial sediments), Rhodes and Pownall (1994; Himalayan sediments), Preusser et al.
(2006; New Zealand and Alpine sediments), Srivastava et al. (2009; Himalayan fluvial sediments).
2 Table 1
Measurement conditions for the single grain K-feldspar post-IR-IRSL at 225ºC protocol applied. Typical growth curves comprise the natural, 4 to 7 regenerative dose points, a zero dose to assess thermal transfer, and a repeat of the first regenerative dose point.
(Godfrey-Smith et al., 1988; Roder et al., 2012). The past 15 years have witnessed dramatic improvements in quartz OSL age estimation offered by the single aliquot regenerative-dose (SAR) protocol of Murray and Wintle (2000; 2003), and the adoption of single-grain methods for quartz OSL (Murray and Roberts, 1998; Jacobs et al., 2003), both in terms of precision and reliability. These effects have tended to bias researchers in favor of quartz OSL, and away from feldspar IRSL.
A resurgence of interest in IRSL was heralded by the novel idea of post-IR IRSL signal measurement of Buylaert et al. (2009), an approach adapted from the post-IR OSL protocol of Banerjee et al. (2001). The post-post-IR OSL approach was initially designed for dating fine-grained (2-11µm) polymineral samples and applied using a SAR protocol. The possibility of developing luminescence dating systems for in-situ measurements on quartz-poor extra-terrestrial bodies such as the moon and Mars has further intensified research effort (e.g. Jain et al., 2006) into feldspar IRSL.
The idea of an “optical wash” (i.e. controlled light exposure) prior to OSL, IRSL or TL measurement was in use by the mid 1980s (e.g. Templer 1985; application to zircon TL dating), with the specific intention of removing or reducing signal components most susceptible to anomalous fading. In some ways this procedure paralleled
the concept of a “thermal wash” or preheat to remove less thermally stable signals, adopted in the optical dating of quartz from its inception (Huntley et al., 1985). Developments in theoretical models (e.g. Huntley, 2006; Poolton et al., 2002a, b; Jain and Ankaergaard, 2011), combined with encouraging initial dating results in comparison both to quartz OSL and independent chronological control (e.g. Buylaert et al., 2009; Thomsen et al., 2011) demonstrating the utility of the post-IR IRSL approach for isolating signal components less affected by anomalous fading, place feldspar IRSL in a strong position for further development and application for sediment age estimation. The first post-IR IRSL protocol developed by the Risø-Aarhus research group involved irradiation, preheat (250ºC for 60s), IRSL measurement at 50ºC, then IRSL at 225º, with identical treatments after a uniform test dose, and with each SAR cycle completed with a “hot
bleach” using IRSL at 290ºC (Table 1). They subsequently
went on to explore a protocol with higher temperature preheat (320ºC for 60s) and second IRSL measurement (290ºC), with a hot bleach at 325ºC. This was done in order
Procedural step Measurement conditions 1 Natural or regenerative dose Beta dose rate 0.118 Gy.s-1
, 0 to 600 Gy 2 Preheat 250ºC, 60s
3 IR50 50ºC, 2.5s @ 90% 150mw 830nm IR laser 4 IR225 225ºC, 2.5s @ 90% 150mw 830nm IR laser 5 Test dose Beta dose rate 0.118 Gy.s-1
, 9Gy 6 Preheat 250ºC, 60s
7 IR50 sensitivity correction 50ºC, 2.5s @ 90% 150mw 830nm IR laser 8 IR225 sensitivity correction 225ºC, 2.5s @ 90% 150mw 830nm IR laser 9 Hot bleach 290ºC, 40s @ 90% 870nm IR diodes Repeat steps 1 to 9
to reduce further the susceptibility of the resultant post-IR IRSL signal to anomalous fading. This latter treatment
(“post-IR-IRSL290”), and adaptations of these measurement and treatment conditions for single grains, have been the basis of most subsequent applications and experiments using this approach (e.g. Nian et al., 2012). Thomsen et al. (2011) demonstrate that IRSL signals that display fading in the laboratory appear to be close to saturation for a natural sample beyond the usual dating range (e.g. geological bedrock samples), suggesting that laboratory fading measurements may include artefacts, and may not represent the true fading rates.
In summary, feldspar IRSL emission is often more intense than quartz OSL, but can suffer from reduced bleachability (that is, ease of signal removal by light) and from anomalous fading, requiring an additional fading assessment and correction step in the measurement procedure, and consequent reduction in dating precision. Recent technical and theoretical advances, coupled to positive dating results, make post-IR IRSL an attractive method to consider, especially when alternative approaches are restricted.
In this paper, I present initial observations based on measurements of more than 120 samples undertaken mostly using a single-grain post-IR IRSL225 protocol (Table 1), employing preheat, IRSL measurement and hot bleach temperatures identical to those proposed by Buylaert et al. (2009; but see caveat below about effective grain temperatures when using Risø single-grain holders), with IRSL exposure times adapted for the different light source used for IRSL measurement. Several samples were collected in locations with independent age control, and comparisons between these and the post-IR-IRSL procedures used are made.
2. Nature of samples, preparation, and IRSL measurement
2.1. Sample locations
Samples investigated came dominantly from Southern California or the Mojave Desert, with a significant group from southern Baja California, Mexico. A few samples came from Mongolia, the Tien Shan, China, and the Marlborough region, New Zealand. Several samples were from Northwest England, northern Spain and one from El Fayum, Egypt. Some significant systematic differences in IRSL characteristics were observed between samples, but as these differences were sometimes for samples in close proximity, these do not appear to reflect large-scale regional variations; they are probably more closely related to different parent lithology.
Many of the samples were from high-energy fluvial contexts, either from fluvial terrace deposits or alluvial fans; two were from a sand lens within glacial till, and three from lower energy drapes over a high-energy glacial outwash deposit. A smaller number represent lower energy conditions, including eolian deposits, lake shorelines or playa lake deposits; three were grains trapped within tufa.
3 insensitive. In some of these cases, the measured OSL signals from the quartz fraction were apparently not from quartz, based on both thermal quenching of the OSL signal and its susceptibility to IRSL bleaching, despite extended treatment with concentrated HF and prior removal of K-feldspar fractions. These signal contamination issues are discussed further in Lawson et al. (2012), and erroneous low OSL age estimates from insensitive quartz at the site of El Paso Peaks (EPP), one of the sites providing single-grain IRSL samples included in this paper, were presented by Roder et al. (2012).
These observations of poor quartz OSL behavior were the initial stimulus to explore K-feldspar IRSL age estimates. Significant age over-estimates for low-energy playa lake deposits at EPP (Roder et al., 2012) using conventional multiple-grain single aliquot IRSL of K-feldspar for signals measured at 50ºC, in comparison to the excellent radiocarbon age control of Dawson et al. (2003), and the significantly slower bleaching rate of this IRSL signal in comparison to quartz OSL (Lawson et al., 2012), were the stimuli to apply a single-grain approach.
With the exception of those from NW England and Egypt, these samples come from regions characterized by active tectonic processes, which in these locations lead to mountain building, rapid erosion rates, and efficient transport of grains into deep sediment sinks. Several locations in southern California and the Mojave Desert are close to active or geologically-young volcanic centers, and most locations have significant sediment input from nearby mid-crustal crystalline source rocks, including plutonic igneous lithologies and low- to high-grade metamorphic rocks. Based on these landscape characteristics the present author would expect to observe several luminescence features, namely low quartz sensitivity and severe incomplete zeroing (Rhodes and Pownall, 1994; Rhodes and Bailey, 1997, Rhodes, 2011).
2.2. Sample collection and preparation
Most samples were collected in steel tubes, pushed horizontally into cleaned sediment sections in natural exposures or excavated pits, while a few were collected by vertical augering. Samples were prepared by selecting a suitable grain size by wet sieving (in most cases this was 175 to 200 µm), administering a dilute HCl treatment to remove carbonate, followed by drying. K-feldspar fractions were separated from quartz, plagioclase and heavy minerals by floatation in a centrifuge using a lithium metatungstate (LMT) solution of 2.58 gcm-3; subsequent developments have included the use of LMT solution at 2.565 gcm-3 in order to isolate the most potassic feldspar fraction, referred to as the “Super-K” procedure. In some cases, this latter treatment was associated with an increase in net IRSL sensitivity of a factor of almost 100, though in other cases, the improvement is less dramatic (details below).
Following density separation and copious rinsing to remove LMT, sample fractions were treated for 10 min in 10% HF to remove outer surfaces. This latter treatment was found to be important for some samples in significantly increasing the proportion of grains that provide IRSL signals. Observation of the grains in a
low-power binocular microscope suggests that the main effect of the HF treatment was to remove dark grain coatings. These coatings are presumed to absorb light, at both stimulation and emission wavelengths.
2.3. IRSL measurement
All OSL and IRSL measurements were made in a standard Risø TL-DA-20 D automated luminescence reader. IRSL measurements were made using a BG3 and BG39 filter combination, allowing transmission around 340 - 470 nm to an EMI 9235QB PMT.
IRSL stimulation was performed using a 150 mW 830 nm IR laser at 90% power for 2.5s; as recommended by the manufacturers, the laser beam is passed through a single RG-780 filter mounted within the single-grain attachment to reduce the resonance emission at 415 nm. Vishay TSFF 5210 870nm IR diodes were used at 90% power for 40s for the hot bleach treatment to reduce measurement time. Diodes were also used for a few samples for the IRSL exposures at 50ºC; however the time saving is not very large, and the loss of IRSL data from individual grains was considered potentially significant, particularly for young or dim samples, where the 50ºC signal may prove useful. Additionally, scatter between grains appeared worse, perhaps because of optical shading of grains by the walls of the deep grain pits in the single-grain holders.
The measurement sequence for De determination included SAR cycles comprising the natural measurement, between four and seven regenerative-dose points to construct a growth curve, a zero dose point for thermal transfer assessment, and a repeat of the first dose administered to assess recycling behavior (Table 1). A test dose of 3.6 Gy was used for De measurements in early work; this was subsequently increased to 8.9 Gy to increase precision.
Fading assessment was conducted for every grain, following completion of the De determinations; several different approaches were taken, discussed below. For single grains, it was concluded that the risk of grain loss was too great to permit removal and replacement during fading determinations, so these were conducted over a period of up to a week after De measurement was completed, without removal from the reader.
3. IRSL observations
4 0 2 4 6 8
0 50 100 150 200
IR S L (s e n si ti v it y -c o rr e ct e d )
Laboratory beta dose (Gy)
0 5 10 15
0 100 200 300 400
IR S L (s e n si ti v it y -c o rr e ct e d )
Laboratory beta dose (Gy) b)
[image:5.612.326.532.83.345.2]a)
Fig. 1. Single-grain IRSL decays for natural post-IR IRSL signals at 225ºC for a) a late Pleistocene fluvial deposit from Branch River, New Zealand, and b) a mid-Holocene colluvium from Redlands, California, USA (each plot shows decays of five 175-200 µ m grains). Inset plots show same data on logarithmic intensity scale. Note the rapid decay shape, low backgrounds and high initial intensities. 870nm laser stimulation provided from 0.25s to 2.75s.
0 1000 2000 3000
0 1 2 3
IR S L (c o u n ts / 0 .0 5 s)
IRSL exposure time (s) 1
10 100 1000 10000
0 1 2 3
IR S L (c o u n ts / 0 .0 5 s)
IRSL exposure time (s)
0 4000 8000 12000 16000 20000
0 1 2 3
IR S L (c o u n ts / 0 .0 5 s)
IRSL exposure time (s) b) 10 100 1000 10000 100000
0 1 2 3
IR S L (c o u n ts / 0 .0 5 s)
IRSL exposure time (s) a)
Fig. 2. Typical single-grain post-IR IRSL225 growth curves for high sensitivity grains from a) a late Pleistocene fluvial deposit from Branch River, New Zealand, as shown in Fig. 1a, and b) a fluvial sand from Ventura, California, USA. Both growth curves are fitted with a saturating exponential plus linear component, with D0 values of 41 and 100 Gy respectively. The natural IRSL signal and De value are shown.
investigation in the future. For many samples, a high proportion of grains provided useful signals allowing De estimation, up to 70% in some cases. This observation immediately renders single-grain K-feldspar IRSL an approach with good potential, as this proportion is very much higher than that typically observed for single-grain quartz OSL (e.g. Rhodes et al., 2010), which often lies in the range of a few percent.
Dose response or growth curves for IRSL at 50 and at 225ºC are often well-fitted by single exponential or exponential plus linear functions, with characteristic saturation dose or D0 values in the range of ~40 to 200 Gy (Fig. 2). While in some samples many grains were saturated, rather few grains were “oversaturated”, that is type 1 grains of Yoshida et al. (2000) where the natural signal is above the regenerated saturation level. In young samples (e.g. <1000 years old), some grains displayed initial supralinearity. Other grains displayed a very low dose (<10 Gy) saturation effect with an initial rapid rise followed by linear growth. This saturation effect may be responsible for apparent negative dose values for several grains from some young samples, though this is not the only possible explanation. Single-grain quartz measurements of young fluvial samples from Australia also displayed a preponderance of negative dose estimates, in contrast to single aliquot determinations of the same samples (Rhodes et al., 2010), and single-grain measurements over this dose range for both mineral groups deserve further detailed study to elucidate these effects.
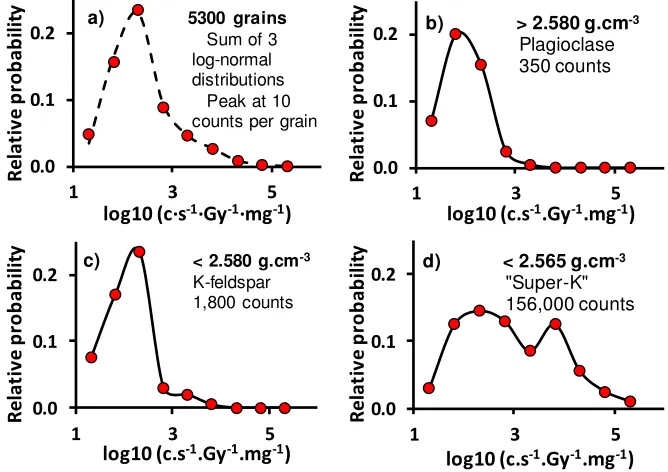
Many grains permit De values to be estimated with a high degree of precision (e.g. Fig. 2), owing to their relatively high sensitivity. Distributions of single-grain sensitivities (proportions of grains in specific sensitivity bins) for combined sample suites from the same location are well-fitted by the sum of either 2 or 3 log-normal components (Fig. 3a). Whether these sensitivity components represent fundamental attributes of particular feldspar minerals, or whether they are characteristic of individual lithologies as a function of their geologic history, remains to be determined.
Plots b, c and d in Fig. 3 illustrate the clear
[image:5.612.70.285.88.343.2]5
0.0
0.1
0.2
1
3
5
Re
la
ti
v
e
p
ro
b
a
b
il
it
y
log10 (c·s
-1·Gy
-1·mg
-1)
a) 5300 grains
Sum of 3 log-normal distributions
Peak at 10 counts per grain
0.0
0.1
0.2
1
3
5
Re
la
ti
v
e
p
ro
b
a
b
il
it
y
log10 (c.s
-1.Gy
-1.mg
-1)
c) < 2.580 g.cm-3
K-feldspar 1,800 counts
0.0
0.1
0.2
1
3
5
Re
la
ti
v
e
p
ro
b
a
b
il
it
y
log10 (c.s
-1.Gy
-1.mg
-1)
b) > 2.580 g.cm-3
Plagioclase 350 counts
0.0
0.1
0.2
1
3
5
Re
la
ti
v
e
p
ro
b
a
b
il
it
y
log10 (c.s
-1.Gy
-1.mg
-1)
d) < 2.565 g.cm-3
[image:6.612.137.471.84.320.2]"Super-K" 156,000 counts
Fig. 3. Single-grain post-IR IRSL at 225ºC sensitivity distributions, in units of counts per second per Gy per milligram, on a logarithmic sensitivity axis; a) Combined distribution of 5300 grains from 29 closely-spaced Holocene alluvial fan samples from Christmas Canyon West, Mojave Desert, California, USA; the peak is at a net IRSL signal of 10 counts per grain (for a 9 Gy dose). The dashed line shows the sum of 3 log normal distributions, which fit the data well; Sensitivity distributions from a Branch River, New Zealand fluvial sand, for b) material of density above 2.580 g.cm-3
, dominated by plagioclase grains with net light sum of 350 counts; c) K-feldspar grains less than 2.580 g.cm-3 ; net light sum 1800 counts; d) “Super-K” grains, representing the most potassic K-feldspars, density less than 2.565 g.cm-3
; net light sum 156,000 counts, almost 90 times that of the regular K-feldspar separation method; 200 grains in each case for plots b), c) and d).
number of grains contributing in Fig. 3c (from 200 measured) means that Fig. 3d is characterized by a different form of distribution for the brightest population; this is interpreted as representing intrinsic sample heterogeneity, particularly for the low count distributions (Figs. 3b and c). It should be noted that the most potassic feldspar fraction could represent different polymorphs of K(Si3Al)O8, the most common being microcline, orthoclase and sanidine; at present, no systematic study of the relative sensitivity of this post-IR IRSL signal for these minerals has been undertaken, but there appears to be a significant increase in
sensitivity using the “Super-K” fraction in comparison to plagioclase or standard K-feldspar preparation, though for most samples, a lower yield (number of grains separated) is expected. Where too low a yield is encountered using the
“Super-K” approach, the sample may be re-prepared using a standard K-feldspar separation to increase the number of grains. It should be noted that the sensitivity of post-IR IRSL signals of K-feldspars can change as a function of different treatments, and should not be considered an intrinsic characteristic of mineral composition or structure (e.g. Chen et al., 2013). Vasiliniuc et al. (2012) reported problems of dose-dependent sensitivity changes when using a post-IR IRSL protocol at 300ºC; both these studies tend to reinforce the use of lower preheat and measurement temperatures such as the 225ºC protocol described here, in order to reduce unwanted sensitivity changes.
3.1. De distributions
Of 90 K-fspr samples from central and southern California measured using single-grain post-IR IRSL, around 60%
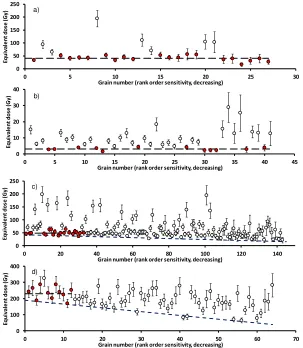
display De distributions comparable to those typical of quartz single-grain OSL. That is, they comprise a majority of grains scattered around a single dose value, but with some higher dose values, and in many cases, a number of lower values; Fig. 4a and b presents two examples, with De values presented in rank order sensitivity (response to the first cycle test dose), that is with the most sensitive grain listed as grain 1, decreasing in sensitivity as grain number increases. The high dose values may represent the effects of incomplete bleaching. It is also possible that some grains with higher dose values have high thermal transfer signals generated by the first preheat. Low values are tentatively interpreted as intrusive grains, rather than representing some form of extreme anomalous fading or other luminescence measurement artefact. For these samples, it seems that an equivalent dose value can be derived using routine approaches, for example using the central age model, minimum age model (Galbraith et al., 1999) or finite mixture model (Galbraith, 2005), possibly with criteria adopted to reject outlying values (e.g. Fitzsimmons et al., 2007). It is expected that these equivalent dose values may require correction for anomalous fading, as is required in multiple-grain IRSL using a similar protocol (Buylaert et al., 2009). A standard overdispersion (OD) value of 15% was used for every sample. This value represents the smallest variance considered routinely possible, based on experience from quartz single-grain OSL measurements (Rhodes et al., 2010) and the most internally-consistent IRSL examples from the present study.
6
Fig. 4. Typical single-grain equivalent dose distributions for post-IR IRSL225 signals, plotted in rank order sensitivity from the brightest grain in decreasing sensitivity order; grains with closed symbols are included in De estimation, shown by heavy dashed lines, open symbol = excluded grain, using an OD of 15% - see text for details; samples are a) a relatively well-bleached fluvial sediment from Branch River, New Zealand (see Figs. 1 and 2), b) a poorly bleached alluvial fan sediment from Christmas Canyon West, Mojave Desert, California, USA, c) a Holocene colluvium from Redlands, California, USA, and d) an alluvial fan sand from Mongolia. Samples shown in a) and b) display a relatively uniform minimum De value as a function of sensitivity, but those in c) and d) display a systematic decrease in minimum De with decreasing sensitivity. For c) and d), the
“declining base” is highlighted with fine hashed lines. For these samples, the combined De is based on the minimum values of the most sensitive grains (solid symbols), up to the point where the declining base has decreased by 15% of its initial value. Note that the sample in plot d) was selected as displaying “declining base” behavior only weakly, and that the fine hashed lines are included merely as a guide to the eye.
degree, initially presenting the appearance of severe incomplete zeroing. However, when equivalent dose is plotted against rank post-IR IRSL sensitivity (Fig. 4c and d), a surprising pattern emerges for many samples. For less sensitive grains, the minimum De value appears to decrease systematically. As mentioned above, natural sensitivity variation appears to represent the sum of log-normal distributions; interestingly, a linear relationship of minimum De to rank order sensitivity can be generated by a declining stretched exponential dependence of equivalent dose on IRSL sensitivity. The underlying causes and consequences of this relationship remain to be further explored.
For samples displaying this pattern of De distribution, here termed “declining base” samples, a pragmatic approach to equivalent dose determination was taken, as described below. It has been shown by several workers that many samples provide age estimates using the post-IR IRSL method that are at least approximately correct, sometimes a few percent too young, possibly owing to anomalous fading (Buylaert et al., 2009; Thomsen
et al., 2011). As these samples were measured using multiple-grain aliquots, and as the samples measured in the present study display single-grain sensitivities representing the sum of log normal distributions (Fig. 3), it seems safe to assume that the IRSL signals measured in multiple-grain studies are dominated by a small number of the brightest grains. This situation is similar to that described for quartz grains by Rhodes (2007); the brightest grains dominate the multiple-grain signal, so the multiple-grain De value closely represents the De values of the brightest single grains. Multiple-grain K-feldspar post-IR IRSL signals at 225ºC were “validated” by Buylaert et al. (2009) and Thomsen et al. (2011) for similar samples. Therefore, when De values vary systematically with sensitivity, the dose values represented by the brightest grains are likely to be faithful recorders of the burial dose. Of course, incomplete zeroing is still expected for fluvial samples, and so the minimum values of the most sensitive grains are considered likely to be the best representatives of the true burial dose.
The selection of which grains to include when determining the equivalent dose for declining base samples 0
50 100 150 200 250
0 5 10 15 20 25 30
E
q
u
iv
a
le
n
t
d
o
se
(
G
y
)
Grain number (rank order sensitivity, decreasing)
0 10 20 30 40
0 5 10 15 20 25 30 35 40 45
E
q
u
iv
a
le
n
t
d
o
se
(
G
y
)
Grain number (rank order sensitivity, decreasing)
b)
0 50 100 150 200 250
0 20 40 60 80 100 120 140
E
q
u
iv
a
le
n
t
d
o
se
(
G
y
)
Grain number (rank order sensitivity, decreasing)
c) a)
0 100 200 300 400
0 10 20 30 40 50 60 70
E
q
u
iv
a
le
n
t
d
o
se
(
G
y
)
Grain number (rank order sensitivity, decreasing)
7
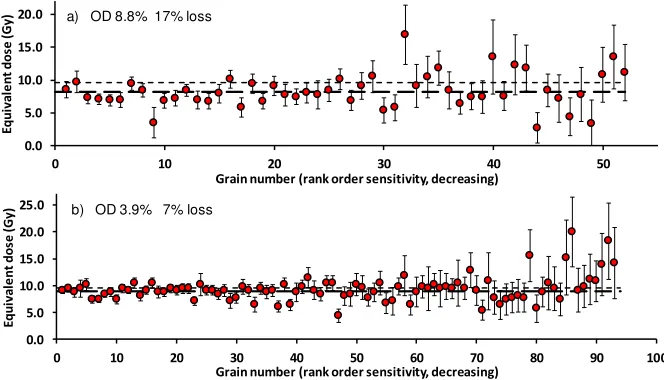
Fig. 5. Single-grain fading experiments based on a single extended delay of several days within the luminescence reader after dating measurements were completed. Delayed measurements were combined with previously measured growth curve to provide a precise apparent dose estimate. Both samples are from Ventura, California, USA. No significant dependence of short-term fading on sensitivity is observed. Heavy dashed line shows central dose estimate, light dashed line shows administered dose.
using the minimum values of the most sensitive grains depends on the degree of variation between the brightest and less-sensitive grains. A convenient way to assess this is based on the slope of the declining base, that is the slope of the lighter dashed lines in Fig. 4c and d. As these are the most sensitive grains measured, the variance is dominated by overdispersion (15%). In this study, no formal inclusion criterion was applied, though in the future the author envisages the development of an inclusion/rejection criterion such that grains of rank order sensitivity less than that associated with a value of the declining base of possibly one OD unit (i.e. 15% in most cases) less than its initial value (at rank sensitivity = 1) are excluded. This is illustrated in Fig. 4c and d; this area requires further research to determine relationships between dose and sensitivity more thoroughly, and to better understand their origins. It should be noted that rank order sensitivity represents an ordinal system (Stevens, 1946), and it is usually considered inadvisable to attempt statistical procedures on such values.
3.2. Equivalent dose estimation
As with multiple-grain aliquots, or quartz single-grain data, several choices are available for equivalent dose estimation. In many instances, higher De values are observed, possibly owing to incomplete signal zeroing at deposition, though other effects such as thermal transfer, invalid sensitivity correction or unobserved first cycle effects may also play a role. In OSL and IRSL dating in general, and in these samples in particular, the minimum age model (MAM; Galbraith et al., 1999) may be difficult to apply for particular datasets. Sometimes this may be caused by too few data points; however, this procedure also treats the full dataset as a truncated single distribution. In
the author’s experience of several hundred single-grain determinations, dose values above the minimum group (defined by the OD value) rarely form a single distribution, but often cluster into a series of relatively well-defined
peaks rising from a broader spread of intermediate values (which preclude the useful application of the finite mixture model).
To overcome problems for such datasets, an approach conceptually similar to that developed by Fuchs and Lang (2001) was adopted. Those authors started with the lowest De value, and added in subsequent higher values until the dataset was no longer consistent with the selected OD value (15% in this case), as assessed, for example, using the central age model. In contrast, for these samples, the highest De values were excluded in turn until the remaining dataset was consistent (using OD=15%). De values of individual grains were excluded starting with the value that was the greatest number of sigma units above the weighted mean of the remaining grains using logged dose values and incorporating an OD of 15%. These two procedures may produce different results when the distribution is relatively broad and flat, or has two or more closely-spaced peaks; the procedure adopted here is more conservative, as more grains are included when they differ.
4. Fading and g-value determination
Several ways to determine the degree of fading of IRSL signals have been proposed. As mentioned above, Thomsen et al. ( 2011) have observed post-IR IRSL signals that fade in the laboratory, but are saturated in nature (i.e. they did not fade in nature). Some samples in this study, and individual grains from other samples, show unsustainable fading rates that would cause virtually no natural signal to be present had fading occurred in nature at this rate. With these observations in mind, the significance of very short term fading measurements must be considered under review.
Several options exist to make fading corrections for single grains. These include i) individual single-grain fading determinations using multiple delay times, ii) more precise multiple-grain measurements with multiple delay times, iii) a single delayed measurement for each grain to
0.0 5.0 10.0 15.0 20.0
0 10 20 30 40 50
E
q
u
iv
a
le
n
t
d
o
se
(
G
y
)
Grain number (rank order sensitivity, decreasing)
0.0 5.0 10.0 15.0 20.0 25.0
0 10 20 30 40 50 60 70 80 90 100
E
q
u
iv
a
le
n
t
d
o
se
(
G
y
)
Grain number (rank order sensitivity, decreasing)
[image:8.612.139.471.78.268.2]8 provide a rapid fading assessment and comparison between
grains, iv) the use of a “standard” fading value assessed by
a) comparison with independent age control, or b) the
degree of saturation for an “infinite age” sample.
Combinations or mixtures between these approaches are also possible.
For the samples discussed here, type i) assessments were conducted for around 12 samples, and displayed a very wide variance of g-value determinations, including negative values and unsustainably high values (see above). Type ii) determinations are now being assessed; these provide greater precision, and can be made over longer time periods (as the aliquots may be stored outside the reader). The requirement to introduce the quartz window for these multiple grain aliquots was overcome by covering the discs in a thin coating of spray acrylic (demonstrated to produce no IRSL signal); this also makes the discs more robust, easier to handle repeatedly, and less prone to contamination.
Type iii) determinations were conducted for every sample, and are considered very valuable. The sensitivity-corrected delayed measurement is treated as though a natural signal, and the already measured growth curve used to determine a faded apparent dose. The ratio of this dose to the known administered value provides a rapid assessment of fading, and comparison between grains is easy and relatively precise. In nearly every case, the short-term fading measured in this manner over 24 to ~120 hr (in comparison to the growth curve which had a typical delay between irradiation and post-IR IRSL measurement of 1000 - 3000s) was uniform, independent of sensitivity (Fig. 5), even for samples displaying declining base behavior. This suggests that either the declining base is not caused by increased fading for the lower values, or that the fading responsible for the lower values was not significant over time periods of several days. However, the resolution of this approach is at its limit, as discussed in more detail below.
Type iv)a assessment is considered very valuable, and is currently being used as a validation of the techniques applied whenever possible. Type iv)b is now routinely being implemented using cobbles of the dominant K-feldspar bearing lithology from each catchment. In the San Bernardino mountains, California, we have measured bedrock K-feldspar from several samples; these display a fraction of saturation for the IR measured at 50ºC (of the initial saturating fraction when a linear or second saturating fraction is observed) of 90% or higher. This suggests a long-term g-value of less than 1% per decade for the IR at 50ºC, and it is expected that the post-IR IRSL signal is more stable than this. Brown et al. (in this volume) used the same post-IR IRSL protocol to measure the K-feldspar from a granodiorite cobble from Baja California Sur, Mexico, and demonstrated that field saturation (steady state) and laboratory saturation signals were indistinguishable, and were consistent with laboratory assessments of sediments from the same catchment that displayed no laboratory fading.
Using the third approach of giving a dose and preheat, then storing for several days before measuring individual grains, we have determined a g-value of 2.1% per decade (with a fractional uncertainty of around 2%, that
is 2.10 ± 0.04 % per decade) for 99 single grains from sample J0432 from an alluvial fan in Mongolia (Fig. 4d). This fan was dated using a 10Be terrestrial cosmogenic nuclide (TCN) profile, and provides an age estimate of 74.1 ka (Nissen et al., 2009). When the measured equivalent dose is corrected for fading using this value, adjusting for the average growth curve shape at the corrected natural IRSL intensity, this sample provides an age estimate of 77.0 ± 6.4 ka. Using the same fading correction, but adjusting for different growth curve parameters, sample J0431 from the same horizon gives 76.2 ± 6.3 ka. These measurements clearly demonstrate the feasibility (and importance) of fading correction.
5. Discussion
The large group of K-feldspar samples observed using a single-grain post-IR IRSL measurement protocol (at 50 and 225ºC) show many features in common. These include many bright grains, characterized by rapid IRSL decays that produce well-fitted growth curves and precise De estimates, especially when the Super-K procedure is used to enrich the sample in the most potassic grains. Preliminary observations suggest that plagioclase 225ºC post-IR IRSL signals are significantly weaker than those of K-feldspar (Fig.3). IRSL measurement using a laser power of 90% did not appear to cause problems, though it is possible that at this power grains are heated above the nominal measurement temperature during laser exposure. Many samples display grains with a relatively uniform minimum De value (Fig. 4a and b), and the MAM or alternative approach to determine the De from the minimum values consistent with an assumed OD value (here 15%) is applied. Other samples display an interesting apparently linear relationship between De and rank sensitivity, dimmer grains having lower minimum dose values (Fig. 4c and d). For these samples, the minimum combined dose value of the most sensitive grains is determined (MAM or alternative approach). Higher dose values often appear to represent De values associated with older sedimentary units within each catchment, based on comparison with other samples within larger sample suites.
Some uncertainty surrounds fading measurement and correction. At least one sample shows more laboratory fading of the 225ºC signal than of the 50ºC IRSL (though the natural equivalent dose values are in the expected
order), and some samples show slight “negative” fading,
9
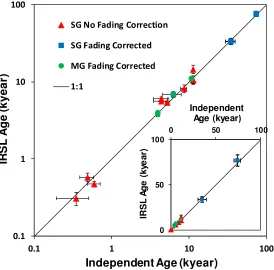
Fig. 6. Comparison of K-feldspar Post-IR IRSL at 225ºC sediment age estimates measured at UCLA with independent chronological control from a range of different fluvial, alluvial and lake shoreline deposits in active tectonic settings in California, Mexico, Tibet and Mongolia. Ages range from around 400 to 80,000 years; inset shows same data on linear axes. The plots show single-grain (SG) data plus three multiple-grain (MG) single aliquot IRSL determinations (circles). Note that while some single-grain data required correction for anomalous fading (squares), many results did not (triangles). Samples shown with square symbols had 10
Be age control, while those shown by triangles and circles had 14
C age control.
Fig. 6 shows preliminary post-IR IRSL225 ages for a range of samples with independent chronological control from 14C and 10Be (and one quartz OSL age). Samples from the latest Pleistocene (<15ka) and Holocene provide ages in agreement with no fading correction, while older samples agree when the measured fading values are applied (as described in section 4.0 above). A very high degree of agreement is observed, providing confidence in this approach.
The mechanisms responsible for the declining base dependence of minimum dose on sensitivity are intriguing but as yet remain largely unexplored. The magnitude of the decline is significantly greater than can be explained by differences in internal dose rate alone, assuming the dimmer grains are less potassic. It is noted that this effect will not be visible if results are inspected only using a radial plot, and significant apparent age underestimates would result if all grains were included in the age analysis. Some samples appear to contain an initial flat base, followed by a declining base for just the dimmer grains; this may represent a mixture of different feldspar species or polymorphs.
It is important to note that the cause of high equivalent dose values may be incomplete zeroing of the signal for that grain prior to deposition, but other explanations are possible, such as a high thermal transfer stimulated by the first preheat. Similarly, low dose values may be interpreted as intrusive grains, introduced by bioturbation from above, but might alternatively arise from
strong fading of the natural signal, not detected by short duration laboratory fading experiments. It should be noted that the primary reason to undertake single grain measurements is precisely to isolate and exclude results from grains that do not record the target environmental event, usually sediment deposition, but exclusion of outlying data produced by other causes may lead to a bias in age estimates. At the present, it is hard to quantify the relative importance of different effects, but future research into modern samples, and those from well-dated contexts, in addition to more detailed research into the nature and origin of the measured IRSL signals and novel statistical approaches, is expected to help clarify this situation.
6. Conclusions
This single-grain approach appears to have great potential for dating a wide range of relatively high-energy fluvial contexts, despite the lower bleaching rate of the post-IR IRSL signal at 225ºC than quartz OSL or the IR at 50ºC. Several samples have fewer sensitive grains, but most contain many bright grains from which meaningful De values and ages can be determined. Based on apparent agreement between samples and different techniques, an OD value of 15% appears to be appropriate to describe intrinsic variability of well-bleached grain populations in single samples. A brief HF treatment and the new Super-K heavy liquid procedure improve the proportion of sensitive grains significantly for some samples, and further methods 0.1
1 10 100
0.1 1 10 100
IR
S
L
A
g
e
(
k
y
e
a
r)
Independent Age (kyear)
SG No Fading Correction
SG Fading Corrected
MG Fading Corrected
1:1
IR
SL
A
g
e
(k
ye
a
r)
Independent
Age (kyear)
0 50 100
[image:10.612.169.443.85.355.2]10 to enhance this result are being sought. An approach using a reduced temperature preheat (180ºC) and post-IR IRSL measurement (150ºC) is being assessed for young samples; initial results indicate a significantly greater proportion of bleached grains is observed, though little indication of signal stability is yet available.
Acknowledgements
Thanks is given to all collaborators on many projects, in particular James Dolan, Sally McGill, James Hollingsworth, Tom Rockwell, Eric McDonald, Jose Luis
Antinao, Carlos Sancho, Willeke Wendrich, Simon Holdaway, Russ van Dissen, Ed Nissen, and Josh West. Special thanks are owed to the dedicated UCLA laboratory support team including Dallon Stang, Wendy Barrera, Lupe Ochoa, Evan Wolf, Tomas Capaldi and Alex Shmurakov. Brian Anderson assisted with Mongolia data, Steve Okubo with the sensitivity distributions. NSF (EAR-1123929, 1145038, 1251690, 1321912) and SCEC (12174, 13073, 13090, 14202, 14217) funding is gratefully acknowledged.
References
Bailiff, I.K., Barnett, S.M., 1994. Characteristics of infrared stimulated luminescence from a feldspar at low temperatures. Radiation Measurements 23, 541–546. Banerjee, D., Murray, A.S., Bøtter-Jensen, L., Lang, A., 2001.
Equivalent dose estimation using a single aliquot of
polymineral fine grains. Radiation Measurements 33,
73–94.
Brown, N.D., Rhodes, E.J., Antinao, J.L., McDonald, E.V. Single-grain post-IR IRSL signals of K-feldspars from alluvial fan deposits in Baja California Sur, Mexico. Quaternary International, this volume.
Buylaert, J.P., Murray, A.S., Thomsen, K.J., Jain, M., 2009. Testing the potential of an elevated temperature IRSL signal from K-feldspar. Radiation Measurements 44, 560-565.
Chen, Y., Li, S.-H., Li, B., 2013. Residual doses and sensitivity change of post IR IRSL signals from potassium feldspar under different bleaching conditions. Geochronometria 40, 229-238, DOI 10.2478/s13386-013-0128-3 Clarke, M.L., Rendell, H.M., 1998. Climate change impacts on
sand supply and the formation of desert sand dunes in the south-west U.S.A. Journal of Arid Environments 39, 517–531.
Curie, D., 1963. Luminescence in Crystals. Methuen, London. Dawson, T.E., McGill, S.F., Rockwell, T.K., 2003. Irregular
recurrence of paleoearthquakes along the central Garlock Fault near El Paso Peaks, California. Journal of Geophysical Research 108, No. B7, 2356, doi: 10. 1029/2001JB001744.
Fitzsimmons, K.E., Rhodes, E.J., Magee, J.W., Barrows, T.T., 2007. The timing of dune activity in the Strzelecki and Tirari Deserts, Australia. Quaternary Science Reviews 26, 2598-2616.
Fuchs, M., Lang, A., 2001. OSL dating of coarse-grain fluvial quartz using single-aliquot protocols on sediments from NE-Peloponnese, Greece. Quaternary Science Reviews 20, 783–787.
Galbraith, R.F., 2005. Statistics for Fission Track Analysis. Chapman and Hall/CRC, London.
Galbraith, R.F., Roberts, R.G., Laslett, G.M., Yoshida, H., Olley, J.M., 1999. Optical dating of single and multiple grains of quartz from Jinmium rock shelter, northern Australia: Part I, experimental design and statistical models. Archaeometry 41, 339–364.
Godfrey-Smith, D.I., Huntley, D.J., Chen, W.H., 1988. Optical dating studies of quartz and feldspar sediment extracts. Quaternary Science Reviews 7, 373–80.
Huntley, D.J., 2006. An explanation of the power-law decay of luminescence. Journal of Physics: Condensed Matter 18, 1359-1365.
Huntley, D.J., Godfrey-Smith, D.I., Thewalt, M.L.W., 1985. Optical dating of sediments. Nature 313, 105-107.
Huntley, D.J., Lamothe, M., 2001. Ubiquity ofanomalous fading in K-feldspars and the measurement and correction for it in optical dating. Canadian Journal of Earth Sciences 38, 1093–1106.
Hütt, G., Jaek, I., Chonka, J., 1988. Optical dating: K-feldspars optical response stimulation spectra. Quaternary Science Reviews, 7, 384-387.
Jacobs, Z., Duller, G.A.T., Wintle, A.G., 2003. Optical dating of dune sand from Blombos Cave, South Africa: II-single grain data. Journal of Human Evolution 44, 613–625. Jain, M., Andersen, C.E., Bøtter-Jensen, L., Murray, A.S., Haack,
H., Bridges, J.C., 2006. Luminescence dating on Mars: OSL characteristics of Martian analogue materials and GCR dosimetry. Radiation Measurements 41, 755–761. Jain, M., Ankjærgaard, C., 2011. Towards a non-fading signal in feldspar: Insight into charge transport and tunnelling from time-resolved optically stimulated luminescence. Radiation Measurements 46, 292-309, doi: 10.1016/j.radmeas.2010.12.004
Lamothe, M., Auclair, M., Hamzaoui, C., Huot, S., 2003. Towards a prediction oflong-term anomalous fading of feldspar IRSL. Radiation Measurements 37, 493–498, doi:10.1016/S1350-4487(03)00016-7
Lawson, M.J., Roder, B.J., Stang, D.M., Rhodes, E.J., 2012. Characteristics of quartz and feldspar from southern California, USA. Radiation Measurements 47, 830-836, doi: 10.1016 /j.radmeas.2012.03.025
Murray, A.S., Roberts, R.G., 1997. Determining the burial time of single grains of quartz using optically stimulated luminescence. Earth and Planetary Science Letters 152, 163-180.
Murray, A.S., Wintle, A.G., 2000. Luminescence dating of quartz using an improved single-aliquot regenerative-dose protocol. Radiation Measurements 32, 57–73. Murray, A.S., Wintle, A.G., 2003. The single aliquot regenerative
dose protocol: potential for improvements in reliability. Radiation Measurements 37, 377-381.
Nian, X, Bailey, R.M., Zhou, L., 2012. Investigations of the post-IR post-IRSL protocol applied to single K-feldspar grains from fluvial sediment samples. Radiation Measurements 47, 703-709.
Nissen E., Walker, R. T., Bayasgalan, A., Carter, A., Fattahi, M., Molor, E., Schnabel, C., West, A.J., Xu, S., 2009. The late Quaternary slip-rate of the Har-Us-Nuur fault (Mongolian Altai) from cosmogenic 10Be and
luminescence dating. Earth and Planetary Science Letters 286, 467-478.
Poolton, N.R.J., Wallinga, J., Murray, A.S., Bulur, E., Bøtter-Jensen, L. 2002a. Electrons in feldspar I: on the wavefunction of electrons trapped at simple lattice defects. Phys Chem Minerals 29, 210-216. DOI 10.1007/s00269-001-0217-3
11
states on luminescence processes. Phys Chem Minerals 29, 217-225. DOI 10.1007/s00269-001-0218-2 Preusser, F., Ramseyer, K., Schluchter, C., 2006, Characterisation
of low OSL intensity quartz from the New Zealand Alps. Radiation Measurements 41, 871 – 877. doi:10.1016/j.radmeas.2006.04.019
Rhodes, E.J., Fanning, P.C., Holdaway, S.J., 2010. Developments in optically stimulated luminescence age control for geoarchaeological sediments and hearths in western New South Wales, Australia. Quaternary Geochronology 5, 348-352.
Rhodes, E.J., 2007. Quartz single grain OSL sensitivity distributions: implications for multiple grain single aliquot dating. Geochronometria 26, 19-29.
Rhodes, E.J., 2011. Optically Stimulated Luminescence Dating of Sediments over the Past 200,000 Years. Annual Review of Earth and Planetary Sciences 39, 461–488, doi: 10.1146/annurev-earth-040610-133425.
Rhodes, E.J., Bailey, R.M., 1997. The effect of thermal transfer on the zeroing of the luminescence of quartz from recent glaciofluvial sediments. Quaternary Science Reviews (Quaternary Geochronology) 16, 291-298.
Rhodes, E.J., Pownall, L., 1994. Zeroing of the OSL signal in quartz from young glaciofluvial sediments. Radiation Measurements 23, 329-333.
Roder, B.J., Lawson, M.J., Rhodes, E.J., Dolan, J.F., McAuliffe, L., McGill, S.F., 2012. Assessing the potential of luminescence dating for fault slip rate studies on the Garlock fault, Mojave Desert, California, USA. Quaternary Geochronology 10, 285-290, doi: 10.1016 /j.quageo.2012.03.013
Smith, B.W., Rhodes, E.J., Stokes, S., Spooner, N.A., Aitken, M.J., 1990. Optical dating of sediments: initial results from Oxford. Archaeometry 32, 19-31.
Srivastava, P., Bhakuni, S. S., Luirei, K., Misra, D. K., 2009. Fluvial records from the Brahmaputra River exit, NE Himalaya: climate-tectonic interplay during Late Pleistocene-Holocene. Journal of Quaternary Science 24, 175–188, DOI: 10.1002/jqs.1190
Stevens, S.S., 1946. On the theory of scales of measurement. Science 103, 677-680, DOI: :10.1126/science.103.2684.677
Templer, R.H., 1985. The removal of anomalous fading in zircon. Nuclear Tracks and Radiation Measurements 10, 531-537.
Thomsen, K.J., Murray, A.S., Jain, M., 2011. Stability of IRSL signals from sedimentary K-feldspar samples. Geochronometria 38, 1-13.
Vasiliniuc S, Vandenberghe DAG, Timar-Gabor A, Panaiotu C, Cosma C and van den Haute P, 2012. Testing the potential of elevated temperature post-IR IRSL signals for dating Romanian loess. Quaternary Geochronology 10: 75-80, DOI 10.1016/j.quageo.2012.02.014 Visocekas, R., 1985. Tunnelling radiative recombination in
labradorite: its association with anomalous fading of thermoluminescence. Nuclear Tracks and Radiation Measurements 10, 521–529.
Wintle, A.G., 1973. Anomalous fading of thermoluminescence in mineral samples. Nature 245,143–4.
Yoshida, H., Roberts, R.G., Olley, J.M., Laslett, G.M., Galbraith, R.F., 2000. Extending the age range of optical dating
using single ‘supergrains’ of quartz. Radiation