promoting access to White Rose research papers
White Rose Research Online
Universities of Leeds, Sheffield and York
http://eprints.whiterose.ac.uk/
"© ACM, (2008). This is the author's version of the work. It is posted here by
permission of ACM for your personal use. Not for redistribution. The definitive
version was published in Proceedings of the 2008 ACM symposium on Applied
computing , (2008).
http://doi.acm.org/10.1145/1363686.1363970
White Rose Research Online URL for this paper:
http://eprints.whiterose.ac.uk/5408/
Published conference paper
Cohen, M., Brodlie, K.W. and Phillips, N. (2008)
The volume in focus:
hardwareassisted focus and context effects for volume visualization.
In:
Proceedings of the 2008 ACM symposium on Applied computing. ACM
Symposium on Applied Computing, March 16 - 20, 2008, Fortaleza, Brazil. ,
Fortaleza, Brazil, pp. 1231-1235.
http://dx.doi.org/10.1145/1363686.1363970
The Volume in Focus:
Hardware-assisted Focus and Context Effects for
Volume Visualization
Marcelo Cohen
School of Informatics PUCRS
[email protected]
Ken W. Brodlie
School of Computing University of Leeds
[email protected]
Nick Phillips
Leeds General Infirmary
[email protected]
ABSTRACT
In many volume visualization applications there is some region of specific interest where we wish to see fine detail - yet we do not want to lose an impression of the overall picture. In this research we apply the notion of focus and context to texture-based volume rendering. A framework has been developed that enables users to achieve fast volumetric distortion and other effects of practical use. The framework has been implemented through direct programming of the graphics processor and integrated into a volume rendering system. Our driving application is the effective visualization of aneurysms, an important issue in neurosurgery. We have devel-oped and evaluated an easy-to-use system that allows a neurosur-gical team to explore the nature of cerebral aneurysms, visualizing the aneurysm itself in fine detail while still retaining a view of the surrounding vasculature.
Categories and Subject Descriptors
I.3.3 [Computer Graphics]: Picture/Image Generation—Display algorithms; I.3.3 [Computer Graphics]: Picture/Image Genera-tion—Viewing algorithms; I.3.3 [Computer Graphics]: Three-Dimensional Graphics and Realism—Color, shading, shadowing, and texture
Keywords
Focus+Context, Volume Rendering, Volume Distortion, GPU Tech-niques
1. INTRODUCTION
The practical use of volume rendering in Medicine has been rather limited to the systems that come with acquisition devices such as CT and MR. These systems are not suitable for use in the operating theatre, as they usually offer a complex user interface and are closely tied to the equipment in use. Thus the initial motivation for the present work was the development of an easy to use, flexible system to aid in the visualization of medical datasets. The applica-tion itself came from the field of neurosurgery, where the surgeon
Permission to make digital or hard copies of all or part of this work for personal or classroom use is granted without fee provided that copies are not made or distributed for profit or commercial advantage and that copies bear this notice and the full citation on the first page. To copy otherwise, to republish, to post on servers or to redistribute to lists, requires prior specific permission and/or a fee.
SAC’08March 16-20, 2008, Fortaleza, Cear´a, Brazil
Copyright 2008 ACM 978-1-59593-753-7/08/0003 ...$5.00.
wanted to understand the nature of a brain aneurysm. This is a con-dition that can happen when there is a weakening of a blood vessel wall and it starts to give way, forming a “balloon”. If not treated, the aneurysm can break open with serious consequences. However, aneurysms can present themselves in a number of configurations, and sometimes it can be hard to identify them amongst the vessel network of the brain. Hence there is a need to fully visualize the vessel network but at the same time more detail is desired on the aneurysm and its immediate surroundings.
In this paper we present a versatile framework developed to ob-tain these goals, based on volume rendering and a concept known as focus and context. The framework has been implemented through programming of a fragment shader, i.e. an algorithm that runs in-side the graphics processor (GPU) and exploits the programma-bility features and speed of the specialized GPU. This allows the system to achieve interactive speeds.
This work is organized as follows: section 2 reviews the re-lated work that led us to the method here described, then section 3 presents the theoretical aspects on which the framework has been built. Section 4 follows on describing the implementation of the framework itself. Section 5 shows the results obtained through the VolFocussystem, which effectively uses the framework to provide an easy to use, responsive system for medical visualization. Finally section 6 presents the evaluation procedure carried out with medi-cal professionals and section 7 offers some conclusions and ideas for future work.
2. RELATED WORK
When dealing with a large dataset, the most common approach to visualizing a specific part in detail is normally the enlargement of that part or region. However, sometimes it is desirable to be able to visualize the entire dataset as a whole, even though we are still interested in that particular region and would rather view it with greater detail than the rest.
The concept of focus and context addresses this problem: we call focusthe section of our data that is most important to us,context being the other sections. This method usually requires some sort of spatial distortion, in such a way that the focus region is displayed with greater accuracy or size and the context region with less - but it must be kept visible. Practical examples of focus and context ideas such as the bifocal display are reviewed in [10].
(a) Normal (b) Bifocal (c) Fisheye (d) Volume lens
Figure 1: Mapping effects in 3D: (a) no effects; in (b) the bifocal effect helped to distinguish between the focus and context regions; in (c) the fisheye effect better preserved the spatial relationships of the data; in (d) the volume lens effect produced a magnified view of just the focus region.
rather different approach, McGuffin et al [8] developed a distortion method based on surgical metaphors such as cutting, peeling and spreading. Implementing these metaphors through direct manipu-lation techniques in 3D and rendering point primitives, his method achieved interactive speeds.
Viola et al [11] associated an importance value to segmented parts of the dataset, allowing the rendering process to remove or suppress those parts of lesser importance - their method was based on a ray casting software renderer.
Recently, Wang et al [12] proposed the idea of a “magic lens” for volume visualization, where they used ray casting through the GPU to implement a number of volumetric effects based on opti-cal modelling of a lens. It did not provide interactive performance with large datasets (although the authors mentioned that further op-timization is possible).
An automated approach was recently proposed by Bruckner et al [1]: the opacity of each voxel is attenuated by a model that com-bines gradient magnitude with the actual shading intensity result-ing from lightresult-ing computations, amongst other variables. Hence no focus region needs to be set, and the user just needs to classify the different materials using colour, leaving the opacity to be computed by their model.
Those approaches offer good visual results, however interactive performance is an issue. This paper describes a method that is both efficient and flexible, based on GPU programming and the idea of a framework for focus and context.
3. FOCUS AND CONTEXT FRAMEWORK
We have created a unified framework that brings together various focus and context effects, such as distortion. The following sections present the three elements (or effects) of the framework in detail: mapping,highlightingandattenuation.
3.1 Mapping Effect
A mapping effect is a transformation function, which modifies the coordinates of each voxel in order to obtain the “distorted” val-ues, in such a way that this will achieve an enlargement or compres-sion, depending on the region.We have implemented three different mapping effects to illustrate the flexibility of this approach: bifocal distortion, fisheye distortion and volume lens.
Abifocal distortionis similar to a bifocal display [10] (see p. 103), but in 3D: it creates a focus region of uniform magnification, compressing everything outside.
Note that it is simpler to use three distinct mapping functions, one for each dimension, instead of a single function depending on
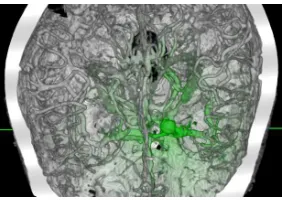
Figure 2: Applying the highlighting effect in a complex dataset volume: with a quadratic highlighting function, the aneurysm and some nearby arteries can be clearly seen.
x, y and z coordinates. The visual result from the application of the bifocal function can be seen in figure 1(b).
This distortion is interesting as it produces a clear separation be-tween focus and context regions. However, this can also be seen as a disadvantage due to the abrupt changes.
The second effect is called thefisheye distortionand again, it is based on a 2D counterpart: the fisheye display [6]. Now the idea is to present the data in a continuous way, without a clear distinction between focus and context regions. This is useful as it does a better job of preserving the spatial relations of the dataset but also creates a lot of distortion towards its edges. Thus there is no focus region, but a single focal point and a distortion factor. Figure 1(c) shows the visual result in 3D.
The third mapping effect, calledvolume lens, is probably the most intuitive one, as it replicates the behaviour of a real lens: magnification is limited to a specific region and the rest of the dataset is largely unaffected. In order to achieve this, the trans-formation function must contain a transition region so that we can move smoothly from the non-magnified outside to the highly mag-nified inside. However, most of the contents of the transition re-gion are so compressed that it will be difficult to visualize any de-tail. Nevertheless, the lens is still a very useful exploration tool as it works in 3D space, i.e. affects a defined 3D region within the dataset, regardless of the viewpoint. Therefore the user can posi-tion the lens, for example, behind other structures and still use it to magnify that region. Note that this is a different approach from the one implemented by Wang et al [12], as their lens affects everything that is directly in front of the viewer.
[image:3.595.366.507.247.347.2]3.2 Highlighting Effect
It is often desirable to be able to highlight what we are interested in, so it is natural to use some sort of highlighting when dealing with volume data. Hence the framework includes ahighlighting ef-fect - this combines a user-selected highlighting colour (e.g. green) with the colour at each voxel, according to the highlight value as-sociated with that voxel - from 0 (no highlight, original colour) to 1 (full highlight, combined colours). Ahighlighting functioncontrols the exact behaviour.
For example, a simple way of computing the value is to use the distance from the voxel to the centre of focus or edge of focus re-gion. In practice, we define this function independently forx,yand z. Hence forx:
hx=max
¡
1−2¯¯xf−x
¯
¯,0¢ (1)
In equation 1, the coordinates are normalized to [0,1] andxf is
the centre of focus. The functionhxis a hat function, with
maxi-mum of 1 at the centre of focus and with slope of 2. We can also raise the result to a power, to obtain e.g. quadratic or cubic func-tions. Alternatively, the highlight could be restricted to the focus region: in this case, the highlighting function would be a constant.
Note that thecombinedhighlighting value for a given voxel (hxyz)
is given by the multiplication of the highlight values for each di-mension (hx,hyandhz). Once computed,hxyz must be somehow
applied to the voxel and this can be carried out in a number of ways. For instance, one may obtain the resulting voxel colour (V0
rgb) by
blending the highlighting colour (Hrgb) with the voxel colour (Vrgb),
using the highlighting value as weight (equation 2):
Vrgb0 =Vrgb·(1−hxyz) +Hrgb·hxyz (2)
Figure 2 shows how the visibility of the aneurysm can be greatly increased by simply highlighting the region around it. In that case, the problem is that the bones behind the vessels prevent a better visualization. Clipping the volume could be a solution, but as the figure shows, there are vessels very close to the skull bones, making this rather difficult. Thus in this situation the lens mapping effect can be helpful to bring out more detail around the aneurysm region, without requiring the user to zoom in - figure 2(c). Note that we kept the previous highlighting effect.
3.3 Attenuation Effect
When dealing with volume data, it is common that the feature of interest is located deep inside the volume - this can make it difficult to visualize properly. For example, consider a 3D dataset of the hu-man brain: the major problem here is the skull, which will always be around the inner structures. Even with a suitable transfer func-tion, it may not be possible to remove it and preserve the desired feature at the same time. This led to the inclusion of the attenu-ationeffect in the framework, which provides an opacity scaling factor for each voxel - 1 meaning no attenuation (original opacity) and 0 meaning full attenuation (fully transparent). Once more, the behaviour is specified by anattenuation function.
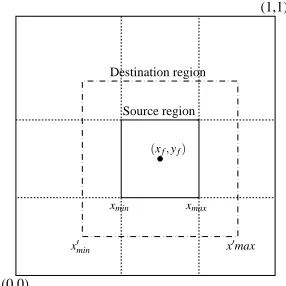
The following parameters are used in the attenuation function (see figure 3 for a 2D example):
• xmin,xmax- limits of the original focus region
• x0
min,x0max- limits of the enlarged focus region
We have modelled attenuation as the ratio between two distances. These are the distances from the closest dataset edge (0 or 1) to: the
(0,0)
(1,1)
Source region Destination region
(xf,yf)
x0
min x0max
[image:4.595.365.508.57.200.2]xmin xmax
Figure 3: Limits used in the attenuation function.
current distorted coordinate (x) and to the closest distorted bound-ary of the focus region (x0
minorx0max).
ax=
x x0
min x<x
0
min
1−x
1−x0
max x>x
0
max
1 x0min<=x<=x0max
(3)
Observe that equation 3 guarantees that regardless of the position of the distorted focus region/centre of focus, the opacity factor (ax)
at the edges of the dataset will be zero. This helps the focus region to be revealed, especially if it is close to an edge of the dataset -we assume that the focus region is strictly within the dataset. Also note that in the case of the fisheye mapping effect, there is no focus region and therefore, we would replacex0minandx0maxin equation 3 withxf. The linear function generally creates a rather subtle effect, hence we can raise the result to a power and obtain a better attenuation effect.
The combined opacity factor is obtained by multiplying the opac-ity factor from each dimension, as we did to compute the combined highlighting value.
This approach yet has a problem: the primary objective of atten-uation is to remove voxels which are potentially in front of the focus region, but as it is presented, it removes voxels fromalldirections. This is often not desirable, as some voxels behind the focus region may contain useful information. Therefore, an alternative function can be computed taking into account the viewing direction in 3D space. This has the goal of creating a region of transparency only in front of the focus region, while keeping the remaining regions unchanged.
In this case, the procedure is slightly more complex: first the current viewpoint is used to compute a normalized gaze vector (gazexyz), which points from the centre of focus to the viewer. Then
the individual components of the gaze vector are used to adjust the resulting opacity factor for each dimension.
For example, if the viewer is looking from the left (gazex<0)
thenaxcan be computed by equation 4:
ax=
(
1−x0min−x
x0
min |gazex| x<x
0
min
1 x>=x0
min
(4)
This formulation reduces the opacity from 1 by an amount that depends on the absolute value of the component of the gaze di-rection, and the relative distance to the edge of the focus region. Therefore, if the gaze direction is, say, (-1,0,0) thenaxwill linearly
(a) No attenuation (b) Distance-based attenuation (c) Viewpoint-based attenuation
Figure 4: Using attenuation to remove occluding features: in (a) there is no attenuation, hence the skull bone completely occludes the aneurysm; in (b) linear distance-based attenuation has been applied, which helped but was not not effective to allow a clear visual path to the aneurysm; in (c) the viewpoint-based method has been used, creating an effective visualization of the aneurysm.
[image:5.595.106.247.243.293.2]
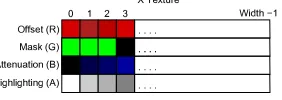
!" #$
Figure 5: Mapping the framework effects to a 1D texture.
that in this caseayandazwill remain equal to 1 throughout. A
similar formulation is used if the viewer is looking from the right (gazex>0).
Figure 4 demonstrates how effective the attenuation can be in removing the skull bone, for example.
4. FRAMEWORK IMPLEMENTATION
The framework was implemented on top of a volume renderer based on 3D texture mapping. The reason for this was that the end users of our system are medical professionals who expect interac-tive speeds, especially if the system would be used in the operating theatre, for example. Although this offers less image quality than approaches such as ray casting, it was an acceptable compromise.
The system uses a fragment shader and three 1D RGBA floating-point textures, one for each dimension. To allow the addressing of any voxel, the length of each texture corresponds to the exact dataset size in that dimension. The key idea is that all effects of the framework (mapping, highlighting, attenuation) for a specific di-mension can be mapped to a colour component on the correspond-ing texture (see figure 5). This method allows the system to quickly recompute the contents of each texture, while at the same time min-imizing the amount of texture memory required.
To encode the mapping effect function for each dimension, the system computes theoffsetbetween each original and distorted tex-ture coordinates (as first suggested by [4]) and stores it in the red colour component of the corresponding texture. Note that we use the inverse of the transformation function, as we must deal with tex-ture coordinates instead of voxel coordinates - the fragment shader cannot change the final pixel position on screen. At the same time, the corresponding (x,y or z) component of amaskvalue is also created. The mask value indicates whether a voxel is distorted or not. If all components of the mask are 1, then the mapping effect is applied to the particular voxel, otherwise no distortion is applied. For example, in the case of the bifocal and fisheye distortions, the mask is always 1, as the effect will be applied throughout the vol-ume. But in the case of the volume lens, the effect must be only applied inside the focus region, so the mask will contain 0 for all voxels outside it. The attenuation and highlight values are
com-puted as well, according to the desired functions, and then stored in the blue and alpha colour components of the texture. Finally, the mask is stored in the green colour component of the texture.
Once the textures have been created, the fragment shader per-forms a number of steps, summarized as follows. First, we fetch the encoded effects forx,yandzat the present voxel and compute the corresponding offset values for each dimension (if the voxel is within the region defined by the 3D mask). Then the original tex-ture coordinates are added to the final offset values, and we fetch the voxel data with the result. The resulting attenuation and high-lighting factors are computed by doing component-wise multipli-cation of the corresponding values for each dimension. Finally, the original voxel colour is blended with the highlight colour, and the alpha of the result is multiplied by the computed attenuation factor. The content of the textures must be computed again every time one of the effects is changed, but this has a negligible impact on the application performance.
5. THE VOLFOCUS SYSTEM
In order to validate all the effects of the framework in a single user interface, we developed a volume renderer system called Vol-Focus1. The system enables users to visualize medical volumes directly from a set of images files (such as JPEG or PNG), DICOM medical data and raw files.
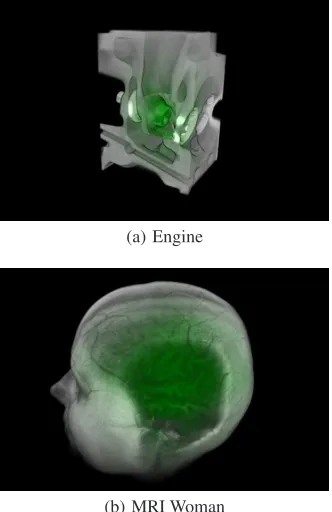
Although the system was originally developed for neurosurgi-cal use, we carried out some experiments with well known datasets (figure 6): these have shown that the system can be potentially used with a variety of data. It can render reasonably sized datasets at in-teractive speeds: for instance, a 512 x 512 x 146 dataset can be rendered at 18 frames per second in a 640 x 480 display window, using all framework effects. In comparison, the same dataset is ren-dered by a conventional direct volume renderer (also based on 3D texture mapping) at 43 frames per second. The lower performance of our method is a direct result of the operations carried out by the fragment shader. Finally, we note that those tests were run on a Pentium 4 3.6 GHz machine with a Quadro FX 4400 card - more recent graphics hardware should be able to achieve higher frame rates.
6. EVALUATION
To provide a better understanding of the applicability of the frame-work effects in a real scenario, we have carried out a very limited evaluation by eight members of a neurosurgery team at Leeds
(a) Engine
[image:6.595.91.257.61.317.2](b) MRI Woman
Figure 6: Wider applicability of the framework: in (a) the en-gine part is both highlighted and enlarged by the volume lens; in (b) the attenuation effect works similarly to a cutting plane.
eral Infirmary. Due to time constraints, we have decided to position in advance the focus region around the aneurysm, so the subjects were asked to use the framework effects just to help them in deter-mining the nature of the aneurysm (i.e. its configuration in relation to the surrounding vessels) - this is the crucial aspect when plan-ning for surgery or treatment, as there are many different configu-rations of aneurysms in relation to the surrounding vessels, and the operative approach must be adapted for each.
The subjects were then asked to rate each one of the effects ac-cording to their personal preference - from bad (1) to excellent (5). Here we wanted to find out whether the effects were effec-tive/helpful or not, however we could not measure how well each subject performed the task.
At the end, the subjects were asked to fill in a form containing those questions and a further section on general usability of the sys-tem. On the latter, we wanted to get some feedback on the graphics user interface - although it was not possible to go through a proper usability test due to the subjects’ limited availability.
The lens effect did not have a very good acceptance - most peo-ple complained that it clipped the connections between the vessel network and the focus region, making it unsuitable for clinical use. Similar comments were made about the bifocal method, due to the unusual distortion produced by it. Therefore, the only method that preserved the entire vessel tree was the fisheye - surprisingly, the heavy distortion was of no concern to most subjects.
The attenuation effect was well received - its effectiveness to re-move the outer skull bone was greatly appreciated. Highlighting was also considered useful, but to a lesser extent - some suggested that it could be very effective if the system was used as an educa-tional tool. The system was regarded as very easy to use, requiring minimal training. Overall the surgeons saw great potential in the system, including its application to the study of tumours.
More detailed results of the evaluation can be found in [3].
7. CONCLUSIONS AND FUTURE WORK
To address the needs of a neurosurgeon, we have developed a volume rendering system with strong emphasis on ease of use and flexibility in importing a variety of medical data. The issue of clearly visualizing aneurysms required substantial research on novel methods. Hence the idea of integrating focus and context tech-niques and volume rendering was successfully evolved in the form of a versatile framework implemented using direct programming of the GPU. The system has been preliminarily evaluated, proving its relevance in a real life scenario.
As the graphics hardware continues to improve, in the future it may be possible to incorporate better quality rendering - such as pre-integrated classification [5] or higher order filtering [9] - with-out sacrificing the frame rate. We also could envisage the system having applicability not just to other medical conditions such as tu-mours, but for feature exploration in a wide range of datasets, for example vortices in CFD datasets.
8. REFERENCES
[1] S. Bruckner, S. Grimm, A. Kanitsar, and M. E. Gr¨oller. Illustrative context-preserving volume rendering. In Proceedings of EuroVis 2005, pages 69–76, May 2005.
[2] M. S. T. Carpendale, D. J. Cowperthwaite, and F. D. Fracchia. Making distortions comprehensible. InVisual Languages, pages 36–45, 1997.
[3] M. Cohen.Focus and Context for Volume Visualization. PhD thesis, School of Computing, University of Leeds, July 2006. 206 pp.
[4] K. Engel, M. Hadwiger, J. M. Kniss, A. E. Lefohn, C. R. Salama, and D. Weiskopf. Real-time volume graphics. In SIGGRAPH 2004 course notes, New York, NY, USA, 2004. ACM Press.
[5] K. Engel, M. Kraus, and T. Ertl. High-quality pre-integrated volume rendering using hardware-accelerated pixel shading. In A. SIGGRAPH and Eurographics, editors,Graphics Hardware, 2001.
[6] G. W. Furnas. Generalized fisheye views. InProceedings of the SIGCHI conference on Human factors in computing systems, pages 16–23. ACM Press, 1986.
[7] E. C. LaMar, B. Hamann, and K. I. Joy. A magnification lens for interactive volume visualization. InIEEE Pacific Conference on Computer Graphics and Applications, pages 223–232, 2001.
[8] M. J. McGuffin, L. Tancau, and R. Balakrishnan. Using deformations for browsing volumetric data. InIEEE Visualization 2003, pages 401–408, October 2003.
[9] C. Sigg and M. Hadwiger.GPU Gems 2: programming techniques for high-performance graphics and
general-purpose computation, chapter 20, pages 313–329. Addison-Wesley, 1st edition, 2005.
[10] R. Spence.Information Visualization. Pearson Education, 2nd edition, 2007.
[11] I. Viola, A. Kanitsar, and M. E. Gr¨oller. Importance-driven volume rendering. InProceedings of IEEE Visualization’04, pages 139–145, 2004.