Towards a Simple Gaussian Model to Describe Multiple
Source Areas during Wind Erosion Events.
H.J. Butler: Department of Mathematics & Computing, U.S.Q, Toowoomba, Queensland, 4350. W.L. Hogarth: Faculty of Environmental Science, Griffith University, Nathan , Queensland, 4111. G.H. McTainsh: Faculty of Environmental Science, Griffith University, Nathan , Queensland, 4111.
Abstract Wind erosion is a broad-scale process in inland Australia. When conditions are conducive
to wind erosion, dust storms can entrain fine sediment over large areas of the continent, however closer examination indicates that the dust source areas are often spatially discrete. The fine sediment entrained from these sources, is transported as dust plumes, which may coalesce at some point downwind. While some progress has been made in estimating the dust load in these plumes (Knight, McTainsh & Simpson 1995), the accuracy of these estimates is limited by the size and shape of the source region assumed. In addition, soil loss per unit area is a more appropriate measure of soil erosion than total plume load, but estimating loss per unit area requires accurate estimation of source areas. The new model developed hopes to overcome these limitations by working from the source area downwind, rather than back-tracking to estimate the source area as done by Knight et al. (1995). As a result of this, the new model is quite
distinct from that of Knight et al. (1995), in that it no longer assumes that entrainment is uniform across a single source area, and consequently that the concentration profile is uniform across the source area. The new model uses a Gaussian plume model (Zannetti 1990), with the dispersion parameters based on the Hanna, Briggs & Hosker (1982) estimates for rural areas. As a first approximation, the model describes dust loads emanating from sources of different strength and spacing along a crosswind line. This configuration is indicative of spatially discrete sources, with different soil erodibility and cover protection, producing different source strengths. Initial results from the model indicate that the nature of the downwind dust concentration profile is dependent on the following factors: downwind distance from source, source strengths,and crosswind source separation. A detailed discussion of the relationship between the above factors is presented. As a result of this discussion a number of conjectures are made about the nature of the physical system.
1
INTRODUCTION
AND
BACKGROUND
Wind erosion is a major geomorphic process in much of inland Australia, especially when drought conditions prevail and adequate ground cover levels are hard to maintain. In any given wind erosion event, much of the fine material picked up by the wind is transported from the
source in dust plumes (McTainsh 1989). Since the amount of material available to the wind for entrainment is limited by factors such as soil erodibility, ground cover and soil moisture, the resultant dust plume (cloud) could be made up of material from a number of discrete sources. The number, location and size of these source
areas has, to date, proved difficult to describe.
mod-elling dust plumes in Australia (Knight 1990, Knight et al. 1995) and overseas (D’Almeida 1986, McMahon, Denison & Fleming 1976, Foda 1983). The majority of these models lack the ability to describe spatial variability in dust concentration in the plume and use backtrack-ing techniques to describe the source areas (see figure 1).
The Composite Box Model of Knight et al. (1995), is the only model to be currently ap-plied to Australian conditions. In the originat-ing source box (Box 1)(i.e the Birdsville Box see figure 2) the whole source area covered by the box is assumed to be entraining at constant rate. The only other source box assumed to be entraining dust is the Charleville box (Box 3) and here entrainment is limited to only a certain percentage of the area of the box. The amount of material entrained is estimated by using the amount produced if the total area was entrain-ing, then taking a percentage of this. It is further assumed that the dust concentration within each box is constant.
While this last assumption “maybe” consis-tent with the dust concentration profile observed in the Brisbane box (Box 4), where there is little variation in dust concentration across the box,
its validity in and around the Charleville box must be questioned. In the Charleville box, we have a situation where only discrete regions of the box are eroding and producing dust plumes. Around each of these regions one would expect a substantial increase in the concentration of dust
in the air (i.e local hot spots). Clearly then
this assumption is inadequate in its description of dust concentrations within and around boxes that contain discrete source regions.
In order to describe spatial variations of dust concentrations around individual source regions, it is necessary to describe the dust concentra-tions that may result from discrete sources that may occur in that region. To achieve this the source model must be able to treat each source as
a discrete identity, and predict how these sources will intermix with the given source region.
Figure 1: Calculated back-trajectories of the 1987 event that effected South-East Queensland, Australia (after Knight et al. (1995)).
Figure 2: The location of the various Boxes
used by Knight et al. (1995).
This estimate has to include at least two
factors:-• the strength of each of the local source
ar-eas in the source region during the event.
• the percentage area of the source region
that is entraining during an event.
Reasonably accurate estimates of these factors can be made if field data is collected for an event (McTainsh, Nickeling, Leys & Lynch 1995), but if this is not available a fair amount of guess work, based on passed experience of the re-searcher is used to provide estimates for these factors on an event basis. Our source model in final form will allow the strength of each source to be defined separately from calculations based upon measured environmental conditions. Field data will also allow better estimates of the lo-cation of local source areas on an event basis to be made. This data will also be used, along
with sensitivity analysis to determine a suitable source profile (source distribution) for the model that best describes the reality of the situation.
2
THE SOURCE MODEL
The source model is based on a Gaussian Plume Dispersion model (see Zannetti (1990)), with the following assumptions:
• local source areas have a constant source
strength with timeQ(µgs−1).
• The average dust concentrations in the
vertical and crosswind directions follow a Gaussian distribution.
• The effective height of the source above
the ground is 0 m (i.e sources are ground based and there is no thermal or turbulent plume rise away from the surface).
• Wind speed (u) is uniform throughout the
source area.
• No deposition occurs in the source
re-gion (this will be relaxed following future model development).
• All material entrained is reflected from the
surface i.e there is no absorption of en-trained material by the surface (this will be relaxed once experimental data be-comes available).
Given these assumptions, Hanna et al.
(1982) state that the concentration C(µgm−3) at
any point downwind of a point source is given
by:-C(x, y, z) = Q
πσyσzu
exp
−y
2
2σ2
y
exp
− z
2
2σ2
z
(1)
wherezis the height above the ground,yis the
andσy(x)andσz(x)are the standard deviations
(Dispersion Parameters) of the concentration in
theyandzdirections respectively.
In choosing the functional form of the
dis-persion parameters (σy(x)andσz(x)) , it is
as-sumed that they are functions of only the
down-wind distancexand the stability of the system.
The stability of the system is included in the model by using pasquill-stability categories out-lined by Hanna et al. (1982), as a basis for classi-fying the turbulent stability of the system. Once the stability category for the system has been determined, than the functional form of the dis-persion parameters (which are only functions of downwind distance) is chosen for the given sta-bility conditions.
As an initial approximation, it is assumed that they have a similar functional form to that outlined by Zannetti (1990) for
neu-tral rural meteorological conditions.
Math-ematically they take the following
form:-σy(x) =
0·08x √
1 + 0·0001x (2)
and
σz(x) =
0·06x
√
1 + 0·0015x (3)
As an initial approximation, local area sources are assumed to be line sources located
along a cross-wind line. Each distinct line
source is assumed to consist of a number of dis-tinct point sources. This is done for a variety of
reasons, such
as:-1. it allows the functional form of the source strength across any source region to be easily altered (i.e it is possible to have a line source with a higher strength in the
centre to that observed at the ends.) This situation is more representative of natural occurring sources.
2. If at any stage in the future it is required that sources be angled to the wind, then
this can be implemented in the model, without substantial modifications.
By taking this approach, each local source area can be assigned a unique source strength (currently this is still assumed to be constant across each source in our model) and separation distance from its neighbour.
2.1
The Functional Forms of
σ
y
(
x
)
and
σ
z
(
x
)
While the functional forms ofσy(x)andσz(x),
represent a reasonable starting point for the pur-pose of developing and testing the model, their relevance to Australian conditions, must at some stage be consolidated, in terms of some of the concepts outlined below.
Since the purpose of this model is to de-scribe a dispersion process that involves multi-sized particles of differing specific densities, the very assumption that the dispersion parameters are independent of the physical properties of the particles, needs to be questioned. In order to change this assumption, the turbulent forces act-ing on the various particles must be sufficiently different, to have a noticeable effect on the dis-persion of the particles. However, at present there is insufficient experimental data on parti-cle size related dispersion effects, from which to base any change.
It is also obvious that the actual functional form of the dispersion parameters may also need to be revised along the following
lines:-• Do Australian soil particles behave
sim-ilarly to those used in US based experi-ments for determining the dispersion pa-rameters?
• Are atmospheric dispersion conditions in
Once these issues are resolved with empir-ical data the functional forms of the dispersion parameters can be changed to better describe Australian conditions.
3
THE
PROBLEM
OF
SCALES
The broad–scale nature of wind erosion and dust transport, means that we should describe the process at three distinct spatial scales ( i.e the local, regional and continental scale). Eventu-ally it maybe possible to describe these in one model, rather then using separate models to de-scribe essentially the same process. The major problem with using the same approach in each case, is picking how to define the source area at each scale.
To understand why this is such a major prob-lem consider a source area made up of numerous discrete sources (as in figure 3). If an observer is located at a sufficient distance downwind of the source, a number of the dust plumes would have coalesced and appear as single concentra-tion profile. Thus if you are trying to describe the concentration at some point after this has oc-curred a single source initially could be used to describe the sources that coalesced. The point where coalescing occurs is dependent on three factors: the dispersion parameters, source sepa-ration and the relative strengths of each source. Therefore picking adequate source descriptions for each scale will depend on our understanding of how these factors interact. Much of this un-derstanding will come through the work, being done on our current model.
4
RESULTS
FROM
THE
MODEL
4.1
Separation of Sources
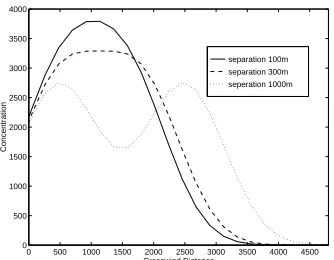
Source separation has a direct effect on the downwind distance before the plumes from each
source coalesce into a single profile.
Dur-ing transition from multiple plumes to a sDur-ingle plume the model predicts that their will be three distinct transitional stages (see Figure 4). These stages are outlined
below:-1. Each source has a distinct peak in the pro-file, that is clearly associated with that source.
2. A plateau (or shoulder, see discussion in section 4.2) is apparent in the profile.
3. The profile is similar to that generated from a single point source.
Between each of these distinct profiles there is a transition profile.
Each of these stages represents various phys-ical stages in the model. The first stage, where each source has a distinct peak, is represen-tative of the where the source plumes mix only slightly. This mixing gradually increases with downwind distance until the centre of the plumes are beginning to mix, so that a plateau is produced around the two centres (if sources are of equal strength, otherwise a shoulder is pro-duced see figure 4 and figure 5.) The mixing gradually increases with downwind distance un-til the plumes have totally combined and are in-distinguishable from a single point source “pro-file” (i.e a simple gaussian distribution).
4.2
Source Strength Effects
strength also plays a role. If one source is sig-nificantly stronger than the other, the weaker has little effect on the major source, except to produce a distinct tail in the profile, depend-ing on separation of the sources. This distortion in the profile soon becomes insignificant as the sources mix further, especially when compared to the concentration change in the region of the stronger source (i.e the effect is still present but produces only a small change in concentration when compared to changes due to the dispersion of material near the stronger source).
If however, the sources are of similar (but not equal) strength the stages outlined in 4.1 are quite distinct (see Figure 5). Here the shoulder is produced by the mixing of two different strength sources.
Source strength also has an effect on the
plateau stage. As mentioned earlier, if the
same separation is maintained, but with differ-ent source strengths the plateau effect reverts to a shoulder/step effect. However if the source strength remains equal but is increased (or de-creased), the profile produced represents a in-crease (or dein-crease) in the concentration present across the profile, but the plateau effect is main-tained (see figure 6).
In the model while the source strength is in-creased, the cross–wind dispersion remains con-stant. Thus the two plumes coalesce at the same point, producing the plateau. However whether this phenomena actually occurs in the physical system must be questioned. The reason this may not be case, is that the more material present in the plume, the higher the inter-particle forces and the more collisions that will occur in the
plume. Then if sufficient material is present
in the cloud, the increase in these two factors should induce greater dispersion rates within the
plume. The opposing argument is that inside the plume restoration forces will balance out any in-crease in these two factors.
4.3
Downwind Effects
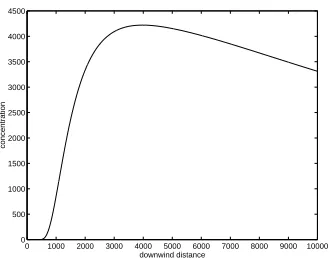
As you would expect from the above, both the separation and the strength play an important role in the effects seen in the downwind profiles. These variables control not only when the effect is seen, but also the strength of the effect.
The nature of the effect is seen in figure 7, which is a downwind profile taken half way be-tween two line sources. As can be seen clearly in this profile there is a gradual build up in the con-centration with downwind distance until a maxi-mum concentration is reached, and then there is a gradual decrease as the plumes continue to dis-perse and mix. This is in contrast to downwind profiles taken in the centre of one of the sources, which are illustrated in figure 8. Here all that is evident as the two sources combine, is a kink in the profile.
Figure 3: A pictorial representation of a
possible distribution of area sources within two distinct source regions.
separation 100m separation 300m separation 1000m
0 500 1000 1500 2000 2500 3000 3500 4000 4500 5000 0
500 1000 1500 2000 2500 3000 3500 4000
Crosswind Distance
[image:7.595.321.497.270.472.2]Concentration
Figure 5: Crosswind profiles illustrating the
effects of source strength on the resultant crosswind profile. Source Details: two 1km line
sources, with the source strength of second
being 0·75 the first. Profile taken at: 10km
downwind of the source line and at a height of 10m.
separation 100m separation 300m seperation 1000m
0 500 1000 1500 2000 2500 3000 3500 4000 4500 0
500 1000 1500 2000 2500 3000 3500 4000
Crosswind Distance
Concentration
Figure 4: Illustration showing the effects of
three different source separations on the concentration profile. Source Details: two 1km line sources of equal strength. Profile taken at: 10km downwind of the source line and at a
height of 10m.
Both strengths doubled Orginal strengths Quarter of orginal strength
0 500 1000 1500 2000 2500 3000 3500 4000 4500 5000 0
1000 2000 3000 4000 5000 6000 7000
Crosswind Distance
Concentration
Figure 6: illustration of the effect of
increasing the source strength of both sources equally on the plateau produced when both sources are equal. Source Details: two 1km line
sources of equal strength. Profile taken at: 10km downwind of the source line and at a
[image:7.595.102.267.299.429.2]0 1000 2000 3000 4000 5000 6000 7000 8000 9000 10000 0
500 1000 1500 2000 2500 3000 3500 4000 4500
downwind distance
[image:8.595.327.495.98.233.2]concentration
Figure 7: The downwind concentration profile
taken halfway between the two sources. Source Details: two 1km line sources of equal strength.
Profile taken at: a height of 10m.
0 1 2 3 4 5 6
x 104
0 2000 4000 6000 8000 10000 12000
downwind distance
concentration
Figure 8: The downwind concentration profile
taken in the centre of the first source. Source Details: two 1km line sources of equal strength.
Profile taken at: a height of 10m.
5
IMPLICATIONS
OF
THESE RESULTS
While the source model we have outlined here is crude in many respects, it does however provide some incite into the behaviour of dust plumes from multiple local dust source areas. It is obvi-ous from the initial results of the model that care must be taken in the description of sources if ac-curate results are to be achieved. The eventual positioning of local source areas will of course be determined by the field data for the source re-gion. The model also indicates that source prop-erties (separation etc.) must be included in any transport model if accurate regions of peak con-centrations are to be predicted from the model.
In sections 2 and 4 a number of assump-tions are raised concerning aspects of the model. These areas of the model require significantly more research before they can be relaxed. How-ever, they do provide a reasonable initial frame-work for the model.
6
WHERE TO FROM HERE
?
Over the next six months, experimental field and laboratory data will be collected to verify as-pects of the model in its current form and model changes will be made based on these results. Also during this time it is planned to introduce dry and wet deposition into the model, to ac-count for these two processes over the source area.
[image:8.595.103.268.99.228.2]7
SUMMARY
The Gaussian model outlined here, provides a useful method to model spatial concentrations of dust within a given source region. The model does however have inherent problems in terms of a number of unrealistic assumptions. How-ever, until better experimental data from current studies become available, it is extremely hard to improve on these assumptions.
In particular, the current model also lacks one vital component in any transportation
model; a deposition term. However, as this
component of the model controls or influences much of the physical behaviour of the model, particular care must be taken in its inclusion model. Current experimental work on deposi-tion is centred around obtaining accurate theo-retical/empirical estimates of deposition veloc-ity and washout rates of dust particles. Once this work is completed deposition will form an inte-gral part of the source model.
8
ACKNOWLEDGEMENTS
The authors acknowledge the support of the Australian Research Council in funding both the theoretical and experimental aspects of this re-search.
9
TERMINOLOGY
backtracking A technique used in meteorology
to backtrack the path of air parcels over a given period.
source region A area of land that contains a
number of discrete sources (see figure 3).
source area A term used to denote the smallest
discrete source (see figure 3)
separation of sources The distance between
line sources which is taken to be the
dis-tance from the trailing edge of one source to beginning of the next source.
entrainment The term given to the process of
particles being ejected into the air.
References
D’Almeida, G. A. (1986), ‘A model for Saha-ran dust tSaha-ransport’, Journal of Climate and Applied Meteorology 25(7), 903–916.
Foda, M. A. (1983), ‘Dry-fall of fine dust on sea’, Journal of Geophysical Research
88, 6021–6026.
Hanna, S., Briggs, G. & Hosker, R. (1982), Handbook on Atmospheric Diffusion, Technical Information Center U.S
Depart-ment of Energy.
Knight, A. (1990), ‘Estimates of long dis-tance dust transport over Eastern Aus-tralia’, Honours Dissertation, Griffith Uni-versity.
Knight, A., McTainsh, G. & Simpson, R. (1995), ‘Sediment loads in an Australian dust storm: Implications for present and past dust processes’. Submitted to CATENA (in press).
McMahon, T. A., Denison, P. & Fleming, R. (1976), ‘A long-distance air pollution transport model incorporating washout and dry deposition components’, Atmospheric Environment 10, 751–761.
McTainsh, G. (1989), ‘Quaternary aelian dust processes and sediments in the aus-tralian region’, Quatenary Science Re-views 8, 235–253.
channel country, w queensland, In prepa-ration.
Zannetti, P. (1990), Air Pollution Modelling: