Pro2ram Visualization
in
Pro2rammin2 Environment
A thesis
submitted in partial fulfilment
of the requirements for the degree
of
Master of Science in Computer Science
at
Massey University
By
Shurong Dong
Department of Computer Science
Massey University
New Zealand
Abstract
Acknowledgements
I would like to thank Professor Mark D. Apperley who proposed
and supervised the project. His support and encouragement has enabled
this thesis to be completed in the time possible.
Thanks are also due to Colin Engle, John Holley and other staff of
the School of Information Sciences who support computers in the
laboratory.
Table of Contents:
Abstract
Acknowledgements
1.
Introduction
1.1 Development of the Programming Environments
1.2 Program Visualization
1.3 Considerations for Program Visualization
2. Program Comprehension
2.1 Programs in the Large
2.2 Programmers
2.3 Program Comprehension and Manipulation through an
interactive interface
3. Current Display Techniques for Large Documents
3 .1 Techniques
3 .2 Interface Design Principles
4. Programming Environment
4.1 The Analysis of A Programming Environment
4.2 High Level Data Store and Processing
4.3 Current Development of Supporting Tools
4.4 Advanced Programming Environments
5. A Practical Prototype
5 .1 Features
5.2 Layout
5.3 Objects of the Source Code
5 .4 Macro Functions
5.5 Some Specifications
References
Appendix 1 :
Quick Use of HI
Appendix 2 :
A Simple Program for Testing
Appendix 3 :
Abstract Program
Appendix 4 :
Compressing One Procedure
Appendix 5 :
Compressing All Procedures
Appendix 6 :
Multiple Text Subwindow & Structure Diagram
Appendix 7 :
Comment
Appendix 8 :
A Complete Map of A Complex Program
Appendix 9 :
Map of A Simple Program Showing A Variable
1
Chapter 1
Introduction
A program is subject to modification during its life cycle. In order to modify it, the program must be easy to understand by programmers. This is particularly important during the maintenance phase of a software system life
cycle.
Software maintenance is a time-consuming task, and occupies most of the time in a software life cycle. Many factors influence the time taken for maintenance. These include the readability of the program, the complexity of algorithms, the available tools, and various other factors. For a very large and complex piece of software, an efficient and powerful environment that supports the interaction of the user with the source code would be of great benefit.
Until now, the main technique used to read and understand a program has been a mental simulation of computer runs, along with the reading of specifications. However, running a program does not give any sense of how a program is organized, nor how to modify and improve it. This is because programs are written for execution on a computer, not for reading. The comm~nts associated with source code are peculiar to the programmer who created the source code, and may be difficult for others to follow. There is a demand for a simple and standard representation of source code.
2
implementation of a prototype of a simple interactive programming environment
with a graphical representation of the program.
1.1 Development of The Programming Environment
1.1.1 Introduction to Programming Environments
The earliest programming environments were concerned only with the
communication between source code and the computer. The user told the
computer how to do the tasks, not simply what to do. As techniques in
computing developed, the languages used, from assemblers to high level
languages, became more understandable by humans. Facilities included
operating systems, debugging tools, text editors and so on, and became more
and more powerful and efficient. These assisted in the interaction between the
programmer and the code.
Command and batch oriented systems are a poor match for the human
cognitive system, which is very visually oriented and computes incrementally.
So people began to realise the need to improve the user interface and its
performance, and developed data oriented systems. A data oriented system is
one in which users interact directly with system data, instead of using a complex
set of commands.
The "Smalltalk" system developed at the Xerox Palo Alto Research Centre
[Goldberg, 1983] is an interpreter for an Object-Oriented Language based on
message passing. "Smalltalk" is extremely good at application prototyping. It is
not only a programming language, but also a programming environment. It
successfully uses a window-based graphic display system to reduce complexity.
There are many other environments created on the basis of "Smalltalk", which
use a high resolution display with more powerful interaction provided by the use
of graphics or multiple views of a program.
1.1.2 Proposed Development
The goal is to develop a unified programming environment that stimulates
program conception at a high level of abstraction, promotes programming by
3
to be displayed in multiple views while editing programs, and provides extensive diagnostic facilities during program execution. This can be achieved by
providing programmers with more powerful tools to cope with the increased
complexity of modem systems. Such tools will enhance the interaction between
programmer and code.
To achieve this goal, the source code should be considered as a structured
database which is one of the objects in a vast space - that is the programming
environment implemented on a screen. In the past, what a user could see was the
source code only. Now, as a whole, source code is just one of the objects which
needs to be analysed and manipulated visually. Other objects in the space are
tools that users can use to act on the source code database. These tools include a
compiler, a debugger, a run-time tool, those which support the environment
such as icons and windows for text and graphics, and also control objects, such
as a mouse, cursor, menus and buttons.
The environment not only has to provide for all queries the user may want
to make of the source code database but also to call related tools to give the user
the proper feedback.
1.2 Program Visualization
Glinert has drawn a destination between visual programming and program
visualization [Glinert, 1990]. Visual programming refers to the use of graphics
to define or to help define programs. The purpose of it is to make programming
easier. PV is the use of graphics to make programs, and their execution,
understandable.
Some high level languages are similar to natural language in order to be
more understandable. The higher level the language is, the more complex the
grammar will be. Even though programming language can be made the same as
English grammar, this is still impractical because people do not all speak in the
same way. So a formal programming language is still needed in writing. On the
other hand, to understand a program, users should be able to read it in the way
which they think they can understand it the best. This requires different kinds of
4
language to different representations will be a great help for users to understand
the program.
Program visualization can be used in teaching algorithms, complex data
structures, program debugging, algorithm design and so on. It is used to support the basic and particular needs of users. The primary needs of a
programmer during development and maintenance are getting information,
finding the relationships between data (i.e source code or tools), and viewing
objects in different ways [ Rajlich, 1990].
1.3 Considerations for Program Visualization
1.3.1 Type of Information
One problem with program visualization is how to represent different
types of information. The information can be as small as one character or one
symbol, and it also can be as large as a graphics with many times screen size or a
document with thousands lines. Information type can be anything which is able
to be shown on the screen. The designer have to choose the most useful and
important ones in order to make the interface clear and efficient.
For example, in a map, how should a procedure be represented? Are
variables local or global? Which information is static, and which is dynamic?
How should feedback on correct actions be provided to the user? All the
information has to be presented in a suitable way and it should be consistent. For
example, the static information, which should always be shown in a particular
place such as the main frame, includes the text window, abstraction window,
message/control window, and an additional window(see Figure 1.3.1). In order
to distinguish the main frame from other frames, the main frame can be defined
using a double outline, while others can be single outlines. Different types,
Abstract
Text Window Graphic
Window
Windows
Message & Control
.
Additional Window
/
'
/Dynamic~'
Static Frame / [image:11.596.127.420.53.315.2]Frames
Figure 1.3.1 Different Information in Different Windows
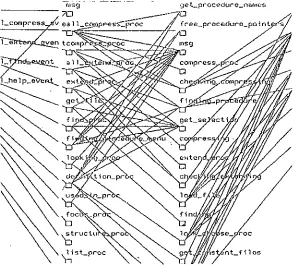
Figure 1.3.2 The Complexity of A Map
(Part of Map in Appendix 8)
[image:11.596.119.412.373.638.2]6
1.3.2 Map Size and Complexity
A map is a diagram which shows the relationship between procedures in a program, and is used by programmers as an aid in understanding the program. For a small program, programmers probably view a map in one or two views. When the program is very large, i.e. the number of procedures is about 100 or more, the map to represent the structure will be very large and complex. In these cases a clear, comprehensible, and well designed map is needed. Figure 1.3.2 shows an example which is part of the map used in the prototype introduced in Chapter 5. Although the map has been simplified, it still appears complex even to a moderately sized program.
1.3.3 Speed
The generation of a map should be fast enough to be used in practical
situations. During programming, interactive formatting and syntax checking can take some time. If the time delay is too long, users will be dissatisfied no matter how good the interface looks. In a graphical environment, many of these operations are slow. Algorithms to accelerate the creation of a map are currently being studied by others.
1.3.4 Limited Screen Size
Screen size is the bottle neck between human and computers. How can all of the information be displayed? What information is more important, and
should the user make use of tools? Such problems have been considered for a long time by many people and still exist. With the spread of applications of computers, much more information needs to pass through the size-limited screen. Although the screen size can be enhanced or several computer screens
can be used at a time for one task, the cost is very high and some others problems emerge, such as the inconvenience of multiple screen views, and difficulty in concentrating on one particular point on a very large screen, which may be beyond the direct control of humans.