ESTADÍSTICAS DEMOGRÁFICAS
BEFOLKNINGSSTATISTIK
BEVÖLKERUNGSSTATISTIK
ΔΗΜΟΓΡΑΦΙΚΕΣ ΣΤΑΤΙΣΤΙΚΕΣ
DEMOGRAPHIC STATISTICS
STATISTIQUES DÉMOGRAPHIQUES
STATISTICHE DEMOGRAFICHE
BEVOLKINGSSTATISTIEK
ESTATÍSTICAS DEMOGRÁFICAS
1989
eurostat
OFICINA ESTADÍSTICA DE LAS COMUNIDADES EUROPEAS DE EUROPÆISKE FÆLLESSKABERS STATISTISKE KONTOR STATISTISCHES AMT DER EUROPÄISCHEN GEMEINSCHAFTEN ΣΤΑΤΙΣΤΙΚΗ ΥΠΗΡΕΣΙΑ ΤΩΝ ΕΥΡΩΠΑΪΚΩΝ ΚΟΙΝΟΤΗΤΩΝ STATISTICAL OFFICE OF THE EUROPEAN COMMUNITIES OFFICE STATISTIQUE DES COMMUNAUTÉS EUROPÉENNES ISTITUTO STATISTICO DELLE COMUNITÀ EUROPEE
BUREAU VOOR DE STATISTIEK DER EUROPESE GEMEENSCHAPPEN SERVIÇO DE ESTATÍSTICA DAS COMUNIDADES EUROPEIAS
L2920 Luxembourg Tél. 43011 Télex : Comeur Lu 3423
B1049 Bruxelles, bâtiment Berlaymont, rue de la Loi 200 (bureau de liaison) Tél. 2351111
Las publicaciones de Eurostat están clasificadas por temas y por series. La clasificación se encuentra al final de la obra. Para mayor información sobre las publicaciones, rogamos se pongan en contacto con Eurostat.
Para los pedidos, diríjanse a las oficinas de venta cuyas direcciones figuran en la página interior de la contracubierta.
Eurostats publikationer er klassificeret efter emne og serie. En oversigt herover findes bag i hæftet. Yderligere oplysninger om publikationerne kan fås ved henvendelse til Eurostat.
Bestilling kan afgives til de salgssteder, der er anført på omslagets side 3.
Die Veröffentlichungen von Eurostat sind nach Themenkreisen und Reihen gegliedert. Die Gliederung ist hinten in jedem Band aufgeführt. Genauere Auskünfte über die Veröffentlichungen erteilt Eurostat. Ihre Bestellungen richten Sie bitte an die Verkaufsbüros, deren Anschriften jeweils auf der dritten Umschlagseite der Veröffentlichungen zu finden sind.
Οι εκδόσεις της Eurostat ταξινομούνται κατά θέμα και κατά σειρά. Η ακριβής ταξινόμηση αναφέρεται στο τέλος κάθε έκδοσης. Για λεπτομερέστερες πληροφορίες σχετικά με τις εκδόσεις, μπορείτε να απευθύνεσθε στην Eurostat.
Για τις παραγγελίες μπορείτε να απευθύνεσθε στα γραφεία πώλησης, των οποίων οι διευθύνσεις αναγράφονται στη σελίδα 3 του εξωφύλλου.
Eurostat's publications are classified according to themes and series. This classification is indicated at the end of the publication. For more detailed information on publications, contact Eurostat.
Orders are obtainable from the sales offices mentioned on the inside back cover.
Les publications de l'Eurostat sont classées par thème et par série. Cette classification est précisée à la fin de l'ouvrage. Pour des informations plus détaillées sur les publications, contactez l'Eurostat.
Pour les commandes, adressez-vous aux bureaux de vente dont les adresses sont indiquées à la page 3 de la couverture.
Le pubblicazioni dell'Eurostat sono classificate per tema e per serie. Tale classificazione è precisata alla fine dell'opera. Per informazioni più dettagliate sulle pubblicazioni rivolgersi all'Eurostat.
Per eventuali ordinazioni rivolgersi a uno degli uffici di vendita i cui indirizzi figurano nella 3a pagina
della copertina.
De publikaties van Eurostat zijn ingedeeld naar onderwerp en serie. Deze indeling is achter in het boek opgenomen. Voor nadere informatie over de publikaties kunt u zich wenden tot Eurostat.
Gelieve bestellingen op te geven bij de verkoopbureaus, waarvan de adressen op bladzijde 3 van de omslag zijn vermeld.
As publicações do Eurostat estão classificadas por tema e por série. Esta classificação está indicada no fim da obra. Para mais informações sobre as publicações é favor contactar Eurostat.
ESTADÍSTICAS DEMOGRÁFICAS
BEFOLKNINGSSTATISTIK
BEVÖLKERUNGSSTATISTIK
ΔΗΜΟΓΡΑΦΙΚΕΣ ΣΤΑΤΙΣΤΙΚΕΣ
DEMOGRAPHIC STATISTICS
STATISTIQUES DÉMOGRAPHIQUES
STATISTICHE DEMOGRAFICHE
BEVOLKINGSSTATISTIEK
Una ficha bibliográfica figura al fin de la obra Bibliografiske data findes bagest i denne publikation
Bibliographische Daten befinden sich am Ende der Veröffentlichung Βιβλιογραφικό σημείωμα δίδεται στο τέλος του βιβλίου
Cataloguing data can be found at the end of this publication Une fiche bibliographique figure à la fin de l'ouvrage Una scheda bibliografica figura alla fine del volume
Bibliografische data bevinden zich aan het einde van deze publikatie Urna ficha bibliográfica encontra-se no fim da obra
Luxembourg: Office des publications officielles des Communautés européennes, 1989 ISBN 92-825-9379-7
Kat./cat.: CA-53-88-342-9A-C
© CECA - CEE - CEEA, Bruxelles · Luxembourg, 1989
Reproduction autorisée, sauf à des fins commerciales, moyennant indication de la source.
Indice
Página
Introducción 5
Población total en la Comunidad 6
Principales términos utilizados en las cabeceras de los cuadros 7
CUADROS
Cuadros comunitarios
Pirámide de edades EUR 12 al 1/1/1987 58
I. — Variación de la población, crecimiento natural, saldo migratorio 59
— Población de los Estados miembros (1950-1987) 60
— Población por sexo y grupos de edad (media anual) 62
IV. — Nacimientos y defunciones (cifras absolutas) 63
V. — índices de natalidad y mortalidad 64
VI. — Comparaciones internacionales de los principales índices demográficos 1960, 1970, 1980,
1986/87 66
Cuadros y pirámides de edades al 1/1/1987 con los datos de cada país:
Bélgica 71
Dinamarca 85
R. F. de Alemania 101
Grecia 115
España 129
Francia 143
Irlanda 159
Italia 173
Luxemburgo 187
Contenido de los cuadros por países
1 — Variación de población, crecimiento natural, saldo migratorio
2 — Población por sexo y grupos de edad al 1 de enero
3 — Población por sexo y grupos de edad (media anual)
4 — Población por sexo y edad (en años) al 1 de enero de 1987
4A — Población por sexo y edad (en años) al 1 de enero de 1988
(Dinamarca, Francia, Italia y Países Bajos)
5 — Nacimientos y defunciones (cifras absolutas)
6 — índices de natalidad y mortalidad
7 — Matrimonios y divorcios
8 — Tasas bruta y neta de reproducción; nacidos vivos por orden de nacimiento;
edad al nacer el primer hijo
9 — índices de fecundidad por grupos de edad; fecundidad total
10 — Esperanza de vida a ciertas edades
Introducción
El contenido de los cuadros de esta publicación
surge, en primer lugar, como respuesta a las
princi-pales necesidades de los servicios de la Comisión en
materia de estadísticas demográficas. Sin embargo,
hemos podido comprobar que, también fuera de la
Comunidad, existe un gran interés por las
estadísti-cas demográfiestadísti-cas de los Estados miembros,
estable-cidas de tal forma que permitan la comparación entre
ellas. Por esta razón, la presente publicación está
destinada a una difusión general. Los cuadros se han
establecido sobre la base de datos procedentes, ya
sea de los servicios estadísticos nacionales, ya sea
de las publicaciones nacionales. Los datos se
presen-tan en forma de un conjunto de cuadros para cada
país, precedidos todos ellos por los cuadros en los
que se indican los totales comunitarios. Por razones
técnicas, no hemos podido establecer agregados
co-munitarios para todos los fenómenos tratados en los
cuadros nacionales.
Aunque las series estadísticas presentadas existen,
por regla general, para la mayoría e incluso para la
totalidad de los Estados miembros, su nivel de
actua-lización no es el mismo en todas partes. Así, ciertos
países ya han establecido su estimación de la
pobla-ción por grupos de edad al 1 de enero de 1988,
mien-tras que otros no disponen de datos más recientes
que los referidos al 1 de enero de 1987. Sin embargo,
se ha optado por una presentación uniforme para
to-dos los países, de forma que, en algunos casos, la
columna «1 de enero de 1988» ha debido quedar
va-cía. Por regla general, no se han redondeado las
ci-fras, salvo en aquellos casos en que es costumbre
del país en cuestión proporcionar cifras redondeadas.
La Oficina Estadística agradece a los distintos
servi-cios nacionales su eficaz colaboración.
El presente volumen ha sido elaborado por la división
«Síntesis sociales» de la dirección «Estadísticas
socia-les y regionasocia-les».
Población total en la Comunidad
A mediados de 1987, la población de la Europa de los
Doce se elevaba a 324 millones de personas, o sea,
un 14 % más que la URSS y, aproximadamente, un
33% más que EEUU. Los 66 países asociados ACP
(África, Caribe y Pacífico) contaban en 1986 con un
total de 441 millones de habitantes.
En la República Federal de Alemania y en Dinamarca, el
índice de natalidad es inferior al índice de mortalidad,
mientras que en la mayoría de los demás Estados
miembros es tan sólo ligeramente superior. Por
consi-guiente, el índice de crecimiento de la población en la
Comunidad es bastante bajo en relación con el resto
del mundo. Las últimas previsiones disponibles
indi-can un aumento de la población comunitaria situado
en el 2 % para el año 2010, frente al 17 % de EEUU, al
9% de Japón, al 19% de la URSS y al 39% de la
población mundial. El porcentaje de la población
co-munitaria en la población mundial pasaría del 6,4 %
en 1987 al 4,7% en el año 2010.
Población total, índices de natalidad y mortalidad. Provisiones de población
Bélgica Dinamarca R. F. de Alemania Grecia
España Francia Irlanda Italia Luxemburgo Países Bajos Portugal Reino Unido
EUR 12 URSS
EEUU Japón Mundo
Población 1987 (1 000)
9 870 5 127 61 199 9 990 38 832 55 630 3 543 57 345 372 14 665 10 250 56 930 323 753 283 000 244 000 122 000 5 024 000
índice de natalidad 1987 (i/oo)
11.9 11,0 10,5 10,7 11,2(') 13,8 16,6 9,6 11,4 12,7 12,0 13,6 11,8 19,4 15,5 11,1 26,0
índice de mortalidad 1987 (i/oo)
10,7 11,3 11,2 9,6 7,9(') 9,5 8,8 9,3 10,8 8,3 9,3 11,3 9,9 10,6 8,7 6,2
9,9
Proyección de población (1 000)
2000 2010
9 700 9 400 5 200 5 100 61 000 58 600 10 100 10 600 40 700 41 200 57 900 58 800 3 500 3 400 57 600 56 400
378 377 15 700 16 100
11 100 11 150 58 900 59 400 332 000 331 000 314 500 337 000 268 000 286 000 130 000 133 000 6 122 000 6 989 000
Variación de 1987-2010
(0/0)
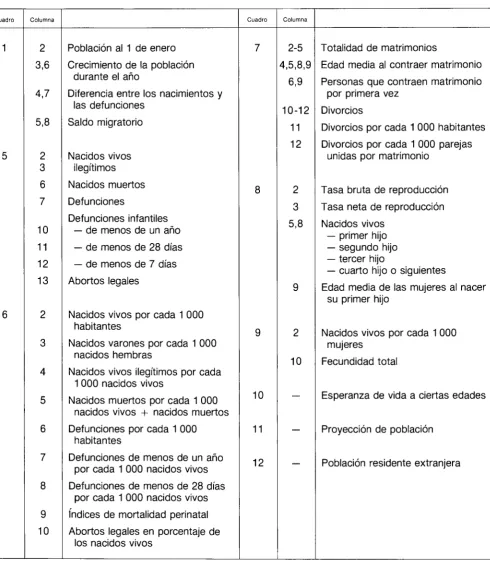
Principales términos utilizados en las cabeceras de los cuadros
[image:9.595.49.540.189.752.2] [image:9.595.36.559.197.750.2]Β
Cuadro
1
5
6
Columna
2
3,6
4,7
5,8
2
3
6
7
10
11
12
13
2
3
4
5
6
7
8
9
10
Población al 1 de enero
Crecimiento de la población
durante el año
Diferencia entre los nacimientos y
las defunciones
Saldo migratorio
Nacidos vivos
ilegítimos
Nacidos muertos
Defunciones
Defunciones infantiles
— de menos de un año
— de menos de 28 días
— de menos de 7 días
Abortos legales
Nacidos vivos por cada 1 000
habitantes
Nacidos varones por cada 1 000
nacidos hembras
Nacidos vivos ilegítimos por cada
1 000 nacidos vivos
Nacidos muertos por cada 1 000
nacidos vivos + nacidos muertos
Defunciones por cada 1 000
habitantes
Defunciones de menos de un año
por cada 1 000 nacidos vivos
Defunciones de menos de 28 días
por cada 1 000 nacidos vivos
índices de mortalidad perinatal
Abortos legales en porcentaje de
los nacidos vivos
Cuadro
7
8
9
10
11
12
Columna
25
4,5,8,9
6,9
1012
11
12
2
3
5,8
9
2
10
—
—
Totalidad de matrimonios
Edad media al contraer matrimonio
Personas que contraen matrimonio
por primera vez
Divorcios
Divorcios por cada 1 000 habitantes
Divorcios por cada 1 000 parejas
unidas por matrimonio
Tasa bruta de reproducción
Tasa neta de reproducción
Nacidos vivos
— primer hijo
— segundo hijo
— tercer hijo
— cuarto hijo o siguientes
Edad media de las mujeres al nacer
su primer hijo
Nacidos vivos por cada 1 000
mujeres
Fecundidad total
Esperanza de vida a ciertas edades
Proyección de población
Inholdsfortegnelse
Side
Indledning 11
Fællesskabets samlede befolkningstal 12
De vigtigste udtryk anvendt i tabelhovederne 13
TABELLER
Fællesskabstabeller
Alderspyramide EUR 12 pr. 1/1/1987 58
I — Ændringer i befolkningstallet; naturlig befolkningstilvækst; nettovandringer 59
II - Medlemslandenes befolkning, 1950-1987 60
III — Befolkningen fordelt efter køn og aldersklasser, middelfolketal 62
IV — Fødsler og dødsfald, (i absolutte tal) 63
V — Fødsels-og dødsfaldskvotient 64
VI — Internationale sammenligninger af de vigtigste demografiske indikatorer 1960, 1970, 1980,
1986/87 66
Tabeller og alderspyramider pr. 1/1/1987 for de enkelte lande i nedenstående rækkefølge:
Belgien 71
Danmark 85
Forbundsrepublikken Tyskland 101
Β
Indholdet af tabellerne for de enkelte lande:
1 — Ændringer i befolkningstallet; naturlig befolkningstilvækst; nettovandringer
2 — Befolkningen fordelt efter køn og aldersklasser, pr. 1. januar
3 — Befolkningen fordelt efter køn og aldersklasser, middelfolketal
4 — Befolkningen fordelt efter køn og alder pr. 1. januar 1987
4A — Befolkningen fordelt efter køn og alder pr. 1. januar 1988
(for Danmark, Frankrig, Italien og Nederlandene)
5 — Fødsler og dødsfald, (i absolutte tal)
6 — Fødsels og dødsfaldskvotient
7 — Vielser og skilsmisser
8 — Brutto og nettoreproduktionstal; levendefødte fordelt efter barnets fødselsnummer;
gennemsnitsalder ved det første barns fødsel
9 — Aldersbetingede fertilitetskvotienter; samlet fertilitet
10 — Middellevetid ved forskellige aldre
11 — Befolkningsfremskrivninger
12 — Fastboende udlændinge
Indledning
Tabellernes indhold i denne publikation er først og
fremmest bestemt af de behov for
befolkningsstati-stik, som oftest opstår inden for Kommissionens
for-skellige tjenestegrene. Det har imidlertid vist sig, at
der også uden for Kommissionen er betydelig
efter-spørgsel efter befolkningsstatistikker for
Fællesska-bets medlemsstater udarbejdet på et sammenligneligt
grundlag, og derfor præsenteres materialet herved i
en publikation til almindelig distribution. Tabellerne er
baseret både på opgørelser fra de nationale
statistis-ke kontorer og på nationale publikationer.
Oplysnin-gerne præsenteres i form af et sæt tabeller med de
samlede tal for Fællesskabet efterfulgt af et sæt
ta-beller for hvert land. Af tekniske grunde har det ikke
været muligt at opgive de samlede tal for hele
Fæl-lesskabet for alle de punkter, der medtages i de
natio-nale tabeller.
vedkommende er skønnene over befolkningens
for-deling efter aldersklasser foretaget pr. 1. januar 1988,
medens de seneste oplysninger for andre lande er pr.
1. januar 1987. Der er imidlertid gennemført en
ensar-tet opstilling for alle lande, således at det i visse
tilfæl-de har været nødvendigt at latilfæl-de rubrikkerne for 1.
ja-nuar 1988 stå tomme. Almindeligvis er tallene ikke
af-rundede bortset fra de tilfælde, hvor denne
frem-gangsmåde anvendes i den pågældende nationale
publikation.
Det Statistiske Kontor retter en tak til de nationale
statistiske kontorer for deres aktive medvirken.
Publikationen er blevet udarbejdet af afdelingen
»Sammenfattende Sociale Analyser« under
Direktora-tet »Social- og Regionalstatistik«.
Selv om de anførte statistiske oplysninger i
alminde-lighed findes for de fleste eller alle medlemslandene,
Fællesskabets samlede befolkningstal
D
Midt i 1987 udgjorde befolkningen i EUR 12 323
mil-lioner mennesker, hvilket overstiger befolkningstallet
for USSR med 14% cg tallet for USA med ca. 33%.
De 66 associerede AVS-lande (Afrika, Vestindien og
Stillehavet) havde i 1986 et samlet befolkningstal på
441 millioner.
I Forbundsrepublikken Tyskland og Danmark er
fødselskvotienten lavere end dødsfaidskvotienten,
medens den for adskillige andre medlemsstater kun
knap når op over dødsfaldskvotienten. Som følge
heraf er væksten i befolkningstallet i Fællesskabet
meget lille i sammenligning med den øvrige verden.
Den nyeste befolkningsfremskrivning regner kun med
en stigning til udgangen af år 2010 på 2% i
Fælles-skabets befolkningstal. Dette skal sammenholdes med
en formodet vækst på 17 % i USA, 9 % i Japan 19 % i
USSR og 39% for verdens samlede befolkning.
Fæl-lesskabets andel forventes at falde fra 6,4 % i 1987 til
4,7% i år 2010.
Befolkning i alt, fødsels- og dødsfaldskvotient - befolkningsfremskrivning
Belgien Danmark
Forbundsrepublikken Tyskland Grækenland
Spanien Frankrig Irland Italien Luxembourg Nederlandene Portugal
Det Forenede Kongerige EUR 12 USSR
USA Japan Verden
Befolkning 1987 (1 000)
9 870 5 127 61 199 9 990 38 832 55 630 3 543 57 345 372 14 665 10 250 56 930 323 753 283 000 244 000 122 000
5 024 000
Fødsels-kvotient 1987 (»/oo)
11,9 11,0 10,5 10,7 11,2 (') 13,8 16,6 9,6 11,4 12,7 12,0 13,6 11,8 19,4 15,5 11,1
26,0
Dødsfalds-kvotient
1987
(%o)
10,7 11,3 11,2 9,6 7,9 C) 9,5 8,8 9,3 10,8 8,3 9,3 11,3 9,9 10,6 8,7 6,2
9,9
Befolkningsfremskrivning (1 000)
2000 2010
9 700 9 400 5 200 5 100 61 000 58 600 10 100 10 600 40 700 41 200 57 900 58 800 3 500 3 400 57 600 56 400
378 377 15 700 16 100
11 100 11 150 58 900 59 400 332 000 331 000 314 500 337 000 268 000 286 000 130 000 133 000
6 122 000 6 989 000
Ændringer i befolk-1987-2010
(0/0) -4,4 -1,0 -4,3 5,7 5,7 5,6 -3,6 -1,6 1,3 9,8 8,7 4,3 2,0 19,1 17,3 9,1 39,1 (') Spanien, 1986.
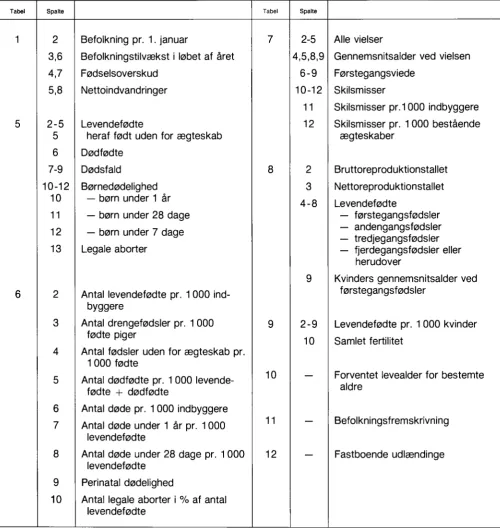
De vigtigste udtryk anvendt i tabelhovederne
Tabel
1
5
6
Spalte
2
3,6
4,7
5,8
2-5
5
6
7-9
10-12
10
11
12
13
2
3
4
5
6
7
8
9
10
Befolkning pr. 1. januar
Befolkningstilvækst i løbet af året
Fødselsoverskud
Nettoindvandringer
Levendefødte
heraf født uden for ægteskab
Dødfødte
Dødsfald
Børnedødelighed
— børn under 1 år
— børn under 28 dage
— børn under 7 dage
Legale aborter
Antal levendefødte pr. 1 000
ind-byggere
Antal drengefødsler pr. 1 000
fødte piger
Antal fødsler uden for ægteskab pr.
1 000 fødte
Antal dødfødte pr. 1 000
levende-fødte + dødlevende-fødte
Antal døde pr. 1 000 indbyggere
Antal døde under 1 år pr. 1000
levendefødte
Antal døde under 28 dage pr. 1000
levendefødte
Perinatal dødelighed
Antal legale aborter i % af antal
levendefødte
Tabel
7
8
9
10
11
12
Spalte
2-5
4,5,8,9
6-9
10-12
11
12
2
3
4-8
9
2-9
10
—
—
Alle vielser
Gennemsnitsalder ved vielsen
Førstegangsviede
Skilsmisser
Skilsmisser pr. 1000 indbyggere
Skilsmisser pr. 1 000 bestående
ægteskaber
Bruttoreproduktionstallet
Nettoreproduktionstallet
Levendefødte
— førstegangsfødsler
— andengangsfødsler
— tredjegangsfødsler
— fjerdegangsfødsler eller
herudover
Kvinders gennemsnitsalder ved
førstegangsfødsler
Levendefødte pr. 1 000 kvinder
Samlet fertilitet
Forventet levealder for bestemte
aldre
Befolkningsfremskrivning
[image:15.595.39.540.201.734.2] [image:15.595.41.545.201.729.2]Inhalt
Seite
Einleitung 17
Die Gesamtbevölkerung der Gemeinschaft 18
Die wichtigsten in den Tabellenköpfen verwendeten Ausdrücke 19
TABELLEN
Gemeinschaftstabellen
Alterspyramide EUR 12 zum 1.1.1987 58
I — Bevölkerungsveränderung, Geburtenüberschuß, Wanderungssaldo 59
II — Bevölkerung der Mitgliedstaaten, 1950-1987 60
III — Bevölkerung nach Geschlecht und Altersgruppen — Jahresdurchschnitt 62
IV — Geburten und Sterbefälle (Grundzahlen) 63
V — Geburten und Sterbefälle (Verhältniszahlen) 64
VI — Internationaler Vergleich der wichtigsten Bevölkerungsindikatoren, 1960, 1970, 1980,
1986/87 66
Ländertabellen und Alterspyramiden zum 1.1.1987 ¡n folgender Reihenfolge:
Inhalt der Ländertabellen:
1 — Bevölkerungsveränderung, Geburtenüberschuß, Wanderungssaldo
2 — Bevölkerung nach Geschlecht und Altersgruppen am 1. Januar
3 — Bevölkerung nach Geschlecht und Altersgruppen — Jahresdurchschnitt
4 — Bevölkerung nach Geschlecht und Altersjahren am 1. Januar 1987
4A — Bevölkerung nach Geschlecht und Altersjahren am 1. Januar 1988
(nur für Dänemark, Frankreich, Italien und die Niederlande)
5 — Geburten und Sterbefälle (Grundzahlen)
6 — Geburten und Sterbefälle (Verhältniszahlen)
7 — Eheschließungen und Ehescheidungen
8 — Brutto- und Nettoreproduktionsziffern, Lebendgeborene nach der
Lebendgeburtenfolge, Alter bei der Geburt des ersten Kindes
9 — Fruchtbarkeitsziffern nach Altersgruppen; Fruchtbarkeit insgesamt
10 — Lebenserwartung in bestimmten Lebensaltern
11 — Voraussichtliche Bevölkerungsentwicklung
12 — Ausländische Wohnbevölkerung
Einleitung
Derlnhalt der Tabellen dieser Veröffentlichung wurde in
erster Linie auf den Bedarf der
Kommissionsdienststel-len an Bevölkerungsstatistiken abgestimmt. Da jedoch
auch außerhalb der Kommission eine beträchtliche
Nachfrage nach Bevölkerungsstatistiken der
Gemein-schaftsländer auf vergleichbarer Grundlage besteht,
wird hier das Zahlenmaterial in einer Veröffentlichung
zur allgemeinen Verbreitung zur Verfügung gestellt.
Die Tabellen beruhen auf Angaben der statistischen
Ämter der Mitgliedstaaten und auf einzelstaatlichen
Veröffentlichungen. Die Daten werden in Form eines
Tabellensatzes für jedes Land dargestellt. Ein Satz mit
Übersichten für die Gemeinschaft ist vorangestellt. Aus
technischen Gründen war es nicht möglich,
Gesamt-zahlen für die Gemeinschaft zu allen Punkten
anzuge-ben, die in den Abschnitten über die einzelnen Länder
aufgeführt sind.
Obwohl die dargestellten Statistischen Reihen im
all-gemeinen für die meisten oder für sämtliche
Mitglied-staaten bestehen, sind sie nicht überall in gleichem
Maße aktuell. So waren zum Beispiel für einige Länder
die Schätzungen in bezug auf die Bevölkerung nach
Altersgruppen zum 1. Januar 1988 verfügbar, während
sich bei anderen die neuesten Informationen auf den
Stand vom 1. Januar 1987 beziehen. Trotzdem wurde
für alle Länder eine einheitliche Darstellung gewählt, so
daß in einigen Fällen die Spalten für die Daten zum 1.
Ja-nuar 1988 frei bleiben mußten. Die Zahlen wurden im
allgemeinen nicht auf- oder abgerundet,
ausgenom-men in den Fällen, in denen dies der entsprechenden
nationalen Veröffentlichungspraxis widersprechen
würde.
Der besondere Dank des Statistischen Amtes gilt all
den Angehörigen nationaler statistischer Dienste, auf
deren wirkungsvolle Zusammenarbeit es sich stützen
konnte.
Diese Veröffentlichung wird von der Abteilung
„Syn-thesen und Sozialstatistik" der Direktion „Sozial- und
Regionalstatistik" betreut.
Die Gesamtbevölkerung der Gemeinschaft
Mitte 1987 belief sich die Bevölkerung von EUR 12
auf 324 Millionen; sie war damit 14% höher als die
der UdSSR und etwa um 33 % höher als die der USA.
Die 66 assoziierten AKP(afrikanischen, karibischen
und pazifischen)-Länder hatten 1986 insgesamt 441
Millionen Einwohner.
In der Bundesrepublik Deutschland und Dänemark ist
die Geburtenziffer niedriger als die Sterbeziffer,
wo-gegen sie in den meisten anderen Ländern nur etwas
höher ist. Somit ist der Gesamtüberschuß der
Bevöl-kerung der Gemeinschaft ganz schwach gegenüber
dem Rest der Welt. Nach den letzten bekannten
Vor-ausschätzungen ist ein Bevölkerungswachstum in
der Gemeinschaft von 2 % bis zum Jahre 2010 zu
er-warten, gegenüber den Vorausschätzungen von
17 % in den USA, 9 % in Japan, 19 % in der UdSSR und
39 % für die Bevölkerung der ganzen Welt. Der Anteil
der Bevölkerung der Gemeinschaft an der
Gesamtbe-völkerung der Welt würde von 6,4 % im Jahre 1987
auf 4,7% im Jahre 2010 zurückgehen.
Gesamtbevölkerung, Geburten- und Sterbeziffer, Bevölkerungsentwicklung
Belgien Dänemark BR Deutschland Griechenland Spanien Frankreich Irland Italien Luxemburg Niederlande Portugal
Vereinigtes Königreich
EUR 12 UdSSR
USA Japan Welt
Bevölkerung 1987 (1 000)
9 870 5 127 61 199 9 990 38 832 55 630 3 543 57 345 372 14 665 10 250 56 930 323 753 283 000 244 000 122 000 5 024 000
Geburten-ziffer 1987
(%o)
11,9 11,0 10,5 10,7 11,2 (') 13,8 16,6 9,6 11,4 12,7 12,0 13,6
11,8 19,4 15,5 11,1 26,0
Sterbe-ziffer 1987 ("/oo)
10,7 11,3 11,2 9,6 7,9 n 9,5 8,8 9,3 10,8 8,3 9,3 11,3 9,9 10,6 8,7 6,2 9,9
Voraussichtliche Bevölkerungsentwicklung (1 000)
2000 2010
9 700 9 400 5 200 5 100 61 000 58 600 10 100 10 600 40 700 41 200 57 900 58 800 3 500 3 400 57 600 56 400
378 377 15 700 16 100
11 100 11 150 58 900 59 400 332 000 331 000 314 500 337 000 268 000 286 000 130 000 133 000 6 122 000 6 989 000
Veränderung der 1987-2010
(0/0)
-4,4 -1,0 -4,3 5,7 5,7 5,6 -3,6 -1,6 1,3 9,8 8,7 4,3 2,0
19,1 17,3 9,1 39,1 (') Spanien: 1986.
Die wichtigsten in den Tabellenköpfen verwendeten Ausdrücke
Tab.
1
5
6
Col.
2
3,6
4,7
5,8
2
3
6
7
10
11
12
13
2
3
4
5
6
7
8
9
10
Bevölkerung am 1. Januar
Bevölkerungszunahme im Jahr
Geburtenüberschuß
Wanderungssaldo
Lebendgeborene
darunter unehelich Geborene
Totgeborene
Sterbefälle
Sterbefälle
— im ersten Lebensjahr
— weniger als 28 Lebenstage
— weniger als 7 Lebenstage
Legale
Schwangerschaftsunter-brechungen
Lebendgeborene auf 1 000
Ein-wohner
Knaben auf 1000 lebendgeborene
Mädchen
Unehelich Lebendgeborene auf
1 000 Lebendgeborene
insgesamt
Totgeborene auf 1 000
Lebend-und Totgeborene
Sterbefälle auf 1 000 Einwohner
Sterbefälle im ersten Lebensjahr
auf 1 000 Lebendgeborene
Sterbefälle in den ersten 27
Le-benstagen auf 1 000
Lebend-geborene
Perinatale Sterblichkeitsrate
Legale
Schwangerschaftsunter-brechungen in % der
Lebendgeburten
Tab.
7
8
9
10
11
12
Col.
2-5
4,5,8,9
6,9
10-12
11
12
2
3
5,8
9
2
10
—
—
—
Alle Eheschließungen
Durchschnittsalter bei der
Eheschließung
Personen, die zum 1. Mal heiraten
Ehescheidungen
Ehescheidungen je 1000 Einwohner
Ehescheidungen je 1 000 Ehen
Bruttoreproduktionsziffer
Nettoreproduktionsziffer
Lebendgeborene
— erstes Kind
— zweites Kind
— drittes Kind
— viertes oder weiteres Kind
Durchschnittsalter der Frauen bei
der Geburt des ersten Kindes
Lebendgeborene auf 1 000 Frauen
Fruchtbarkeit insgesamt
Lebenserwartung in bestimmten
Lebensaltern
Voraussichtliche
Bevölkerungs-entwicklung
Περιεχόμενα
Σελίδα
Εισαγωγή 23
Συνολικός πληθυσμός της Κοινότητας 24
Κυριότεροι όροι που χρησιμοποιούνται στις επικεφαλίδες των πινάκων 25
ΠΙΝΑΚΕΣ
Κοινοτικοί πίνακες:
Πυραμίδα ηλικιών ΕΥΡ 12 την 1η Ιανουαρίου 1987 58
Ι — Μεταβολές του πληθυσμού, φυσική αύξηση, καθαρή παλιννόστηση 59
II — Πληθυσμός των κρατών μελών, 1950-1987 60
III — Πληθυσμός κατά φύλο και ομάδες ηλικίας — ετήσιος μέσος όρος 62
IV — Γεννήσεις και θάνατοι (απόλυτοι αριθμοί) 63
V — Ποσοστά γεννητικότητας και θνησιμότητας, γάμων και διαζυγίων 64
VI — Διεθνείς συγκρίσεις κύριων δημογραφικών δεικτών για τα έτη 1960, 1970, 1980,
1986/87 66
Πίνακες και πυραμίδες ηλικιών την 1η Ιανουαρίου 1987 για κάθε χώρα με την εξής σειρά:
Βέλγιο 71
Δανία 85
Ομοσπονδιακή Δημοκρατία της Γερμανίας 101
Ελλάδα 115
Ισπανία 129
Γαλλία 143
Ιρλανδία 159
Ιταλία 173
Περιεχόμενο των πινάκων για κάθε χώρα:
1 — Μεταβολές του πληθυσμού, φυσική αύξηση, καθαρή παλιννόστηση
2 — Πληθυσμός κατά φύλο και ομάδες ηλικίας την 1 η Ιανουαρίου
3 — Πληθυσμός κατά φύλο και ομάδες ηλικίας — ετήσιος μέσος όρος
4 — Πληθυσμός κατά φύλο και κατά ηλικία την 1 η Ιανουαρίου 1987
4Α — Πληθυσμός κατά φύλο και κατά ηλικία την 1 η Ιανουαρίου 1988
(Δανία, Γαλλία, Ιταλία και Κάτω Χώρες)
5 — Γεννήσεις και θάνατοι (απόλυτοι αριθμοί)
6 — Ποσοστά γεννητικότητας και θνησιμότητας
7 — Γάμοι και διαζύγια
8 — Μεικτά και καθαρά ποσοστά αναπαραγωγής, γεννήσεις ζωντανών παιδιών κατά τάξη, ηλικία
κατά τη γέννηση του πρώτου παιδιού
9 — Ποσοστά γονιμότητας κατά ομάδες ηλικίας, συνολική γονιμότητα
10 — Προσδοκία ζωής για ορισμένες ηλικίες
11 — Προβολές πληθυσμού
12 — Αλλοδαπός μόνιμος πληθυσμός
Εισαγωγή
Το περιεχόμενο των πινάκων του παρόντος
δημοσιεύματος καθορίστηκε κυρίως από τις
κυριότερες ανάγκες για δημογραφικές στατι
στικές που παρουσιάζονται στις υπηρεσίες
της Επιτροπής. Παρ' όλα αυτά έχει επίσης
παρατηρηθεί ότι και εκτός της Επιτροπής
υπάρχει σημαντική ζήτηση για συγκρίσιμες
δημογραφικές στατιστικές των χωρών της
Κοινότητας, και έτσι τα δεδομένα παρουσιά
ζονται σε ένα δημοσίευμα που προορίζεται για
γενικότερη χρήση. Οι πίνακες βασίζονται και σε
στοιχεία που μας εστάλησαν από τις εθνικές
στατιστικές υπηρεσίες και σε εθνικά δημοσιεύ
ματα. Τα δεδομένα δίνονται υπό τη μορφή μιας
ομάδας πινάκων για κάθε χωρά, αφού προηγου
μένως παρουσιάσουμε μερικούς πίνακες που
περιέχουν κοινοτικά συνολικά μεγέθη. Για
τεχνικούς λόγους δεν ήταν δυνατό να δώσουμε
κοινοτικά συνολικά μεγέθη για όλες τις
κατηγορίες που εμφανίζονται στα τμήματα κατά
χώρα.
εκτιμήσεις του πληθυσμού κατά ομάδες ηλικιών
αναφέρονται στην 1η Ιανουαρίου του 1988, ενώ για
άλλες οι πιο πρόσφατες πληροφορίες αναφέρονται
στην 1η Ιανουαρίου του 1987. Επειδή όμως
υιοθετήθηκε μια ομοιόμορφη παρουσίαση για
όλες τις χώρες, αναγκαστήκαμε σε μερικές
περιπτώσεις να αφήσουμε κενές τις στήλες για
την 1η Ιανουαρίου του 1988. Γενικά, τα στοιχεία
δεν έχουν στρογγυλοποιηθεί, εκτός εάν αυτό
αντίκειται στην πρακτική που ακολουθείται για
τα αντίστοιχα εθνικά δημοσιεύματα.
Η Στατιστική Υπηρεσία θα ήθελε να ευχα
ριστήσει τις εθνικές στατιστικές υπηρεσίες
για την αποτελεσματική τους συνεργασία.
Το παρόν δημοσίευμα καταρτίστηκε από το τμήμα
«Κοινωνικές μελέτες σύνθεσης» της διεύθυνσης
«Κοινωνικές και περιφερειακές στατιστικές».
Αν και οι στατιστικές σειρές που παρουσιά
ζουμε υπάρχουν στα περισσότερα ή όλα τα κράτη
μέλη, δεν είναι παντού στον ίδιο βαθμό ενημερω
Ο συνολικός πληθυσμός της Κοινότητας
Περί τα μέσα του 1987 ο πληθυσμός της Ευρώπης
των Δώδεκα ανερχόταν σε 324 εκατομμύρια άτομα,
ήτοι κατά 14 % μεγαλύτερος εκείνου της ΕΣΣΔ και
περίπου 33 % μεγαλύτερος εκείνου των ΗΠΑ. Οι 66
συνδεδεμένες χώρες ΑΚΕ (Αφρικής, Καραϊβικής
και Ειρηνικού) αριθμούσαν το 1986 συνολικά 441
εκατομμύρια κατοίκους.
Στην Ομοσπονδιακή Δημοκρατία της Γερμανίας
και τη Δανία το ποσοστό γεννήσεων είναι κατώ
τερο του ποσοστού θανάτων, ενώ στην πλειοψηφία
των άλλων κρατών μελών το ποσοστό γεννήσεων
σπάνια υπερβαίνει το ποσοστό θανάτων. Συνεπώς,
το γενικό ποσοστό αύξησης του πληθυσμού στην
Κοινότητα είναι χαμηλό για τα παγκόσμια
πρότυπα. Οι τελευταίες διαθέσιμες προβολές
δείχνουν μια αύξηση 2% του πληθυσμού της
Κοινότητας για το έτος 2010 συγκρινόμενη με
προσδοκώμενες αυξήσεις 17 % στις ΗΠΑ, 9 % στην
Ιαπωνία, 19% στην ΕΣΣΔ και 39% στο συνολικό
παγκόσμιο πληθυσμό. Το μερίδιο του κοινοτικού
πληθυσμού της Κοινότητας στο σύνολο του
παγκόσμιου πληθυσμού αναμένεται να πέσει από
6,4% το έτος 1987 στο 4,7% το έτος 2010.
Συνολικός πληθυσμός, ποσοστά γεννήσεων και θανάτων, προβολές πληθυσμού
Βέλγιο Δανία
ΟΔ της Γερμανίας Ελλάδα
Ισπανία Γαλλία Ιρλανδία Ιταλία Λουξεμβούργο Κάτω Χώρες Πορτογαλία Ηνωμένο Βασίλειο
EUR 12
ΕΣΣΔ ΗΠΑ Ιαπωνία
Παγκόσμιο σύνολο
Πληθυσμός 1987 (1000)
9 870 5 127 61 199 9 990 38 832 55 630 3 543 57 345 372 14 665 10 250 56 930
323 753
283 000 244 000 122 000
5 024 000
Ποσοστό γεννήσεων
1987
(0/00)
11,9 11,0 10,5 10,7 11,20 13,8 16,6 9,6 11,4 12,7 12,0 13,6
11,8
19,4 15,5 11,1
26,0
Ποσοστό θανάτων 1987
(0/00)
10,7 11,3 11,7 9,6 7,9(') 9,5 8,8 9,3 10,8 8,3 9,3 11,3
9,9
10,6 8,7 6,2
9,9
Προβολή πληθυσμού (1000)
2000 2010
9 700 9 400 5 200 5 100 61 000 58 600 10 100 10 600 40 700 41 200 57 900 58 800 3 500 3 400 57 600 56 400
378 377 15 700 16 100
11 100 11 150 58 900 59 400
332 000 331 000
314 500 337 000 268 000 286 000 130 000 133 000
6 122 000 6 989 000
Μεταβολές πληθυσμού
<%)
-4,4 -1,0 -4,3 5,7 5,7 5,6 -3,6 -1,6 1,3 9,8 8,7 4,3
2,0
19,1 17,3 9,1
39,1 (') Ισπανία. 1986.
Κυριότεροι όροι που χρησιμοποιούνται στις επικεφαλίδες των πινάκων
Πίνακας
1
5
6
Στήλη
2
3,6
4,7
5,8
2
3
6
7
10
11
12
13
2
3
4
5
6
7
8
9
10
Πληθυσμός κατά την 1 η Ιανου
αρίου
Αύξηση του πληθυσμού κατά τη
διάρκεια του έτους
Υπεροχή των γεννήσεων έναντι
των θανάτων
Καθαρή παλιννόστηση
Γεννήσεις ζώντων
από τα οποία εξώγαμα
Γεννήσεις νεκρών
θάνατοι βρεφών
— κάτω του ενός έτους
— κάτω των 28 ημερών
— κάτω των 7 ημερών
Νόμιμες αμβλώσεις
Γεννήσεις ζώντων ανά 1 000
κατοίκους
Γεννήσεις αρρένων ανά 1 000
γεννήσεις θηλέων
Γεννήσεις ζώντων εξωγάμων ανά
1 000 γεννήσεις ζώντων
Γεννήσεις νεκρών ανά 1 000
γεννήσεις ζώντων και
γεννήσεις νεκρών
θάνατοι ανά 1 000 κατοίκους
θάνατοι κάτω του ενός έτους ανά
1 000 γεννήσεις ζώντων
θάνατοι κάτω των 28 ημερών ανά
1 000 γεννήσεις ζώντων
Ποσοστό περιγεννητικής θνησι
μότητας
Νόμιμες αμβλώσεις επί τοις % των
γεννήσεων ζώντων
Πίνακας
7
8
9
10
11
12
Στήλη
2-5
4,5,8,9
6,9
10-12
11
12
2
3
5,8
9
2
10
—
Σύνολο γάμων
Μέση ηλικία γάμου
Άτομα συνάπτοντα γάμο για
πρώτη φορά
Διαζύγια
Διαζύγια ανά 1 000 κατοίκους
Διαζύγια ανά 1 000 υπάρχοντες
γάμους
Μεικτό ποσοστό αναπαραγωγής
Καθαρό ποσοστό αναπαραγωγής
Γεννήσεις ζώντων
— πρώτη γέννηση
— δεύτερη γέννηση
— τρίτη γέννηση
— τέταρτη γέννηση ή επόμενες
Μέση ηλικία γυναικών κατά τη
γέννηση του πρώτου παιδιού
Γεννήσεις ζώντων ανά 1 000
γυναίκες
Συνολική γονιμότητα
Προσδοκία ζωής για ορισμένες
ηλικίες
Προβολή πληθυσμού
Contents
Page
Introduction 29
The total population of the Community 30
Principal terms used in table headings 31
TABLES
Community tables
Age pyramid of EUR 12 at 1.1.1987 58
I — Population change, natural increase, net migration 59
II — Population of member countries 1960-87 60
III — Population by sex and age group — annual average 62
VI — Births, deaths, marriages, divorces (absolute numbers) 63
V — Birth, death, marriage and divorce rates 64
VI — International comparisons of principal demographic indicators, 1960, 1970, 1980,
1986/87 66
Country tables and age pyramids at 1.1.1987, in the following order:
Belgium 71
Denmark 85
FR of Germany 101
Greece 115
Spain 129
France 143
Ireland 159
Italy 173
Luxembourg 187
The Netherlands 201
Content of country tables:
1 — Population change, natural increase, net migration
2 — Population by sex and age group at 1 January
3 — Population by sex and age group — annual average
4 — Population by sex and year of age at 1 January 1987
4A — Population by sex and year of age at 1 January 1988
(for Denmark, France, Italy and the Netherlands)
5 — Births and deaths (absolute numbers)
6 — Birth and death rates
7 — Marriages and divorces
8 — Gross and net reproduction rates; live births by parity; average age at birth of first child
9 — Fertility rates by age group; total fertility
10 — Expectation of life at certain ages
11 — Population projections
12 — Foreign residents
Introduction
The content of the tables in this publication has been
determined primarily by the needs for demographic
statistics arising most frequently within the services
of the Commission. However, it has been noted that
outside the Community there is also a considerable
demand for demographic statistics of the countries of
the Community on a comparable basis, and the
mate-rial is therefore presented in a publication for general
distribution. The tables are based both on returns
pro-vided by the national statistical services and on national
publications. The data are presented in the form of a set
of tables for each country, preceded by a set containing
Community totals. For technical reasons it has not been
possible to give Community totals in respect of all the
items featured in the country sections.
Although the statistical series shown generally exist
for most or all member countries, they are not equally
up-to-date everywhere. For example, for some
coun-tries estimates of the population by age group are
available for 1 January 1988 but in others the most
recent information is for 1 January 1987. A uniform
presentation has, nevertheless, been adopted for all
countries so that in some cases it is necessary to leave
the columns for 1 January 1988 blank. Generally, the
figures given are unrounded except where this is
con-trary to the practice in the relevant national
publica-tion.
The Statistical Office would like to thank the national
statistical services for their effective cooperation.
This publication was prepared by the Division 'Social
digests', which forms part of the Directorate 'Social
and regional statistics'.
The total population of the Community
S3
In mid-1987 the population of EUR 12 amounted to 324
million persons, 14 % more than that of the USSR and
some 33 % greater than that of the USA. The 66
asso-ciated ACP (African, Caribbean and Pacific) countries
had, in 1986, a total of 441 million inhabitants.
In the Federal Republic of Germany and in Denmark
the birth rate is below the death rate while in a number
of other member countries also the birth rate scarcely
exceeds the death rate. In consequence the overall
rate of population growth in the Community is low by
world standards. The latest available projections
indi-cate a rise of 2 % in the population of the Community by
the year 2010 compared with expected increases of
17 % in the USA, 9 % in Japan, 19 % in the USSR and
39 % in the total world population. The proportion of the
total world population within the Community is
expected to decline from 6.4 % in 1987 to 4.7 % in the
year 2010.
Total population, birth and death rates, population projections
Country
Belgium Denmark FR of Germany Greece Spain France Ireland Italy Luxembourg The Netherlands Portugal United Kingdom
EUR 12 USSR
USA Japan World
Population 1987 (1 000)
9 870 5 127 61 199 9 990 38 832 55 630 3 543 57 345 372 14 665 10 250 56 930 323 753 283 000 244 000 122 000 5 024 000
Birth rate 1987 (%o)
11.9 11.0 10.5 10.7 11.20 13.8 16.6 9.6 11.4 12.7 12.0 13.6
11.8 19.4 15.5 11.1 26.0
Death rate 1987
(%o)
10.7 11.3 11.7 9.6 7.90 9.5 8.8 9.3 10.8 8.3 9.3 11.3
9.9 10.6 8.7 6.2 9.9
Population projection (1 000)
2000 2010
9 700 9 400 5 200 5 100 61 000 58 600 10 100 10 600 40 700 41 200 57 900 58 800 3 500 3 400 57 600 56 400
378 377 15 700 16 100
11 100 11 150 58 900 59 400 332 000 331 000 314 500 337 000 268 000 286 000 130 000 133 000 6 122 000 6 989 000
Population change
(%) 1987-2010
-4.4 -1.0 -4.3 5.7 5.7 5.6 -3.6 -1.6 1.3 9.8 8.7 4.3
2.0 19.1 17.3 9.1 39.1 O 1986 for Spain.
Principal terms used in table headings
Tab.
1
5
6
Col.
2
3,6
4,7
5,8
2
3
6
7
10
11
12
13
2
3
4
5
6
7
8
9
10
Population on 1 January
Population increase over year
Excess of births over deaths
Net migration
Live births
of which illegitimate
Still births
Deaths
Infant deaths
— under 1 year
— under 28 days
— under 7 days
Legal abortions
Live births per 1 000 population
Males born per 1 000 female births
Illegitimate live births per 1 000 total
live births
Still births per 1 000 live + still
births
Deaths per 1 000 population
Deaths under 1 year per 1 000 live
births
Deaths under 28 days per 1 000 live
births
Perinatal mortality rate
Legal abortions as % of live births
Tab.
7
8
9
10
11
12
Col.
2-5
4,5,8,9
6,9
10-12
11
12
2
3
5,8
9
2
10
—
—
—
All marriages
Average age at marriage
Persons marrying for the first time
Divorces
Divorces per 1000 population
Divorces per 1 000 existing
marriages
Gross reproduction rate
Net reproduction rate
Live births
- first
— second
- third
— fourth or higher order
Average age of women at birth
of first child
Live births per 1 000 women
Total fertility
Expectation of life at certain ages
Population projection
Table des matières
Page
Introduction 35
Population totale dans la Communauté 36
Principaux termes utilisés dans les en-têtes des tableaux 37
TABLEAUX
Tableaux communautaires: 58
Pyramide des âges EUR 12 au 1
erjanvier 1987
I — Variation de la population, accroissement naturel, solde migratoire 59
II — Population des pays membres, 1950-1987 60
III — Population par sexe et groupe d'âge — Moyenne annuelle 62
IV — Naissances et décès (chiffres absolus) 63
V — Taux de natalité et de mortalité 64
VI — Comparaisons internationales des principaux indicateurs démographiques 1960, 1970, 1980,
1986-1987 66
Tableaux et pyramides des âges au 1
e' janvier 1987 pour chaque pays dans l'ordre suivant:
Belgique 71
Danemark 85
République fédérale d'Allemagne 101
Grèce 115
Espagne 129
France 143
Irlande 159
Italie 173
Luxembourg 187
Contenu des tableaux pour chaque pays:
1 — Variation de la population; accroissement naturel; solde migratoire
2 — Population par sexe et groupe d'âge au 1
erjanvier
3 — Population par sexe et groupe d'âge — Moyenne annuelle
4 — Population par sexe et par années d'âge au 1
erjanvier 1987
4A — Population par sexe et par années d'âge au 1
erjanvier 1988 (pour le Danemark,
la France, l'Italie et les Pays-Bas)
5 — Naissances et décès (chiffres absolus)
6 — Taux de natalité et de mortalité
7 — Mariages et divorces
8 — Taux brut et net de reproduction; naissances vivantes par rang; âge à la naissance du premier enfant
9 — Taux de fécondité par groupe d'âge; somme des naissances réduites
10 — Espérance de vie à certains âges
11 — Projections de la population
12 — Population étrangère résidente
Introduction
Le contenu des tableaux de cette publication a été
déterminé, en premier lieu, par les besoins principaux
des services de la Commission en matière de
statisti-ques démographistatisti-ques. Toutefois, nous avons
cons-taté qu'en dehors de la Communauté, il existe aussi
un vif intérêt à l'égard des statistiques
démographi-ques des pays membres, établies sous une forme
permettant des comparaisons, et c'est pourquoi la
présente publication est destinée à une diffusion
générale. Les tableaux ont été établis sur la base de
données provenant soit des services statistiques
na-tionaux, soit de publications nationales. Les données
sont présentées sous forme d'un jeu de tableaux
pour chaque pays, le tout étant précédé de tableaux
donnant les totaux communautaires. Pour des
rai-sons techniques, nous n'avons pu établir des
agré-gats communautaires pour tous les phénomènes
trai-tés dans les tableaux nationaux.
pays membres, leur niveau d'actualisation n'est pas
le même partout. Ainsi, certains pays ont déjà établi
leur estimation de la population par groupe d'âge au
1
erjanvier 1988, alors que, pour d'autres, les données
les plus récentes se réfèrent au 1
erjanvier 1987. Une
présentation uniforme a cependant été adoptée pour
tous les pays, de sorte que, dans certains cas, la
co-lonne «1
erjanvier 1988» a dû rester vide. En général,
les chiffres n'ont pas été arrondis, sauf quand l'usage
national est de donner des chiffres arrondis.
L'Office statistique tient à remercier les services
na-tionaux de leur collaboration efficace.
Le présent volume a été élaboré par la division
«Syn-thèses sociales» de la direction «Statistiques sociales
et régionales».
Bien que les séries statistiques présentées existent
Population totale de la Communauté
A la mi-1987, la population de l'Europe des Douze
s'élevait à 324 millions de personnes, soit 14% de
plus que celle de l'URSS et supérieure de quelque
33% à celle des USA. Les 66 pays associés ACP
(Afrique, Caraïbes et Pacifique) comptaient en 1986
un total de 441 millions d'habitants.
En République fédérale d'Allemagne et au Danemark,
le taux de natalité est inférieur au taux de mortalité,
tandis qu'il ne lui est que très légèrement supérieur
dans la plupart des autres pays membres. En
consé-quence, le taux d'accroissement global de la
popu-lation dans la Communauté est faible par rapport au
reste du monde. Les dernières progressions
disponi-bles indiquent pour l'an 2010 une augmentation de
2 % de la population communautaire, comparée avec
les prévisions d'augmentation de 17% aux USA, 9%
au Japon, 19% en URSS et 39% pour la population
mondiale. La part de la population de l'Europe des
Douze dans la population mondiale passerait de
6,4% en 1987 à 4,7% en l'an 2010.
Population totale, taux de naissance et de décès. Projections de la population
Belgique Danemark RF d'Allemagne Grèce
Espagne France Irlande Italie Luxembourg Pays-Bas Portugal Royaume-Uni
EUR 12 URSS
USA Japon
Monde
Population 1987 (1 000)
9 870 5 127 61 199 9 990 38 832 55 630 3 543 57 345 372 14 665 10 250 56 930 323 753 283 000 244 000 122 000
5 024 000
Taux de naissance
1987 (»/oo)
11,9 11,0 10,5 10,7 11,2(') 13,8 16,6 9,6 11,4 12,7 12,0 13,6
11,8 19,4 15,5 11,1 26,0
Taux de mortalité
1987 (%o)
10,7 11,3 11,2 9,6 7,9(') 9,5 8,8 9,3 10,8 8,3 9,3 11,3
9,9 10,6 8,7 6,2
9,9
Projection de la population (1 000)
2000 2010
9 700 9 400 5 200 5 100 61 000 58 600 10 100 10 600 40 700 41 200 57 900 58 800 3 500 3 400 57 600 56 400
378 377 15 700 16 100
11 100 11 150 58 900 59 400 332 000 331 000 314 500 337 000 268 000 286 000 130 000 133 000
6 122 000 6 989 000
Changement de la 1987-2010
-4,4 -1,0 -4,3 5,7 5,7 5,6 -3,6 -1,6 1,3 9,8 8,7 4,3 2,0 19,1 17,3 9,1 39,1 (') 1986 pour l'Espagne.
Principaux termes utilisés dans les en-têtes des tableaux
Tableau
1
5
6
Colonne
2
3,6
4,7
5,8
2
3
6
7
10
11
12
13
2
3
4
5
6
7
8
9
10
Population au 1
erjanvier
Accroissement de la population
pendant l'année
Excédent des naissances sur les
décès
Solde migratoire
Naissances vivantes
dont illégitimes
Mort-nés
Décès
Décès d'enfants
— de moins de un an
— de moins de 28 jours
— de moins de 7 jours
Avortements légaux
Nés vivants pour 1 000 habitants
Naissances masculines pour 1 000
naissances féminines
Naissances vivantes illégitimes pour
1 000 naissances vivantes
Mort-nés pour 1 000 nés vivants +
mort-nés
Décès pour 1 000 habitants
Décès de moins de un an pour 1000
nés vivants
Décès de moins de 28 jours pour
1 000 nés vivants
Taux de mortalité périnatale
Avortements légaux en pourcentage
des naissances vivantes
Tableau
7
8
9
10
11
12
Colonne
2-5
4,5,8,9
6,9
10-12
11
12
2
3
5,8
9
2
10
—
Ensemble des mariages
Âge moyen au mariage
Personnes se mariant pour la
première fois
Divorces
Divorces pour 1000 habitants
Divorces pour 1 000 couples unis
par le mariage
Taux brut de reproduction
Taux net de reproduction
Naissances vivantes
— premières naissances
— deuxièmes naissances
— troisièmes naissances
— quatrièmes naissances et
suivantes
Âge moyen des femmes à la
naissance de leur premier enfant
Naissances vivantes pour 1 000
femmes
Somme des naissances réduites
Espérance de vie à certains âges
Projection de la population
Indice
Pagina
Introduzione 41
La popolazione totale della Comunità 42
Principali espressioni utilizzate nelle tabelle 43
TABELLE
Tabelle per l'insieme della Comunità:
Piramide della popolazione EUR 12 all'1/1/1987 58
I — Movimenti della popolazione, incremento naturale, saldo migratorio 59
II - Popolazione degli Stati membri, 1950-1987 60
III — Popolazione per sesso e classi d'età (media annuale) 62
IV — Nascite e decessi (valori assoluti) 63
V — Tassi di natalità e di mortalità 64
VI — Confronti internazionali dei principali indicatori demografici 1960, 1970, 1980,
1986/87 66
Tabelle e piramidi della popolazione all' 1/1/1987 per paese nell'ordine seguente:
Belgio 71
Danimarca 85
RF di Germania 101
Grecia 115
Spagna 129
Francia 143
Irlanda 159
Italia 173
Lussemburgo 187
Elenco delle tabelle per paese:
1 — Movimenti della popolazione, incremento naturale, saldo migratorio
2 — Popolazione per sesso e classi d'età, 1° gennaio
3 — Popolazione per sesso e classi d'età (media annuale)
4 — Popolazione per sesso e anni d'età, 1° gennaio 1987
4A — Popolazione per sesso e anni d'età, 1° gennaio 1988 (solo per Danimarca, Francia, Italia e Paesi Bassi)
5 — Nascite e decessi (valori assoluti)
6 — Tassi di natalità e di mortalità
7 — Matrimoni e divorzi
8 — Tasso lordo e tasso netto di riproduzione, nati vivi per ordine di nascita, età media alla nascita del primo
figlio
9 — Tassi di fecondità per classi d'età: fecondità totale
10 — Speranza di vita a determinate età
11 — Proiezioni della popolazione
12 — Stranieri residenti
Introduzione
Il contenuto delle tabelle di questa pubblicazione è
stato determinato essenzialmente con riferimento alle
esigenze d'informazione nel campo delle statistiche
demografiche manifestatesi con maggior frequenza
nell'ambito dei servizi della Commissione. Si è rilevato
peraltro che anche al di fuori della Commissione
esiste una considerevole richiesta di statistiche
de-mografiche dei paesi della Comunità, su base
compa-rabile; per questo motivo il materiale disponibile viene
presentato in una pubblicazione destinata alla
diffu-sione generale.
Le tabelle si basano sia su dati statistici
appositamen-te forniti dai servizi nazionali di statistica, sia su
pub-blicazioni nazionali. I dati sono presentati sotto forma
di una serie di tabelle per ogni paese, preceduti da
una serie con i totali comunitari. Per motivi tecnici non
è stato possibile fornire i totali della Comunità per
tutte le voci considerate nelle sezioni per paese.
Le serie statistiche riportate sono generalmente
di-sponibili per tutti o quasi tutti i paesi membri, ma non
sono sempre aggiornate alla stessa data. Per esempio
le stime della popolazione per classi di età relative a
taluni paesi sono disponibili al 1° gennaio 1988; nel
caso di altri paesi, invece, le informazioni più recenti non
risalgono che al 1 ° gennaio 1987. Si è tuttavia scelto un
tipo di presentazione uniforme per tutti i paesi,
sicché in taluni casi si sono dovute lasciare in bianco
le colonne relative al 1 ° gennaio 1988. Di massima, si
forniscono cifre non arrotondate a meno che ciò non
contrasti con la prassi seguita nelle corrispondenti
pubblicazioni nazionali.
L'Istituto satistico desidera ringraziare tutti coloro
che, nell'ambito dei servizi nazionali di statistica,
han-no fornito una proficua e fattiva collaborazione.
La presente pubblicazione è stata compilata dalla
di-visione «Sintesi sociali» della direzione delle
«Statisti-che sociali e regionali».
La popolazione totale della Comunità
Verso la metà del 1987 la popolazione dell'Europa dei
dodici era di 324 milioni di persone, una cifra
supe-riore del 14% a quella della popolazione dell'URSS e
del 33% circa a quella della popolazione degli Stati
Uniti. 166 paesi associati ACP (Africa, Caraibi e
Pacifi-co) avevano nel 1986 una popolazione totale di 441
milioni di abitanti.
Nella Repubblica federale di Germania e in Danimarca
si è registrato un tasso di natalità inferiore al tasso di
mortalità mentre nella maggior parte degli altri
paesi esso è leggermente superiore. Di conseguenza,
il tasso globale d'incremento della popolazione nella
Comunità risulta basso rispetto a quello del resto del
mondo. Le ultime proiezioni disponibili mostrano, per
l'anno 2010, un aumento della popolazione
comunita-ria del 2 %, mentre detto aumento sarà del 17 % negli
USA, del 9% nel Giappone, del 19% in URSS e del
39% sul totale della popolazione mondiale. La
per-centuale della popolazione comunitaria rispetto alla
popolazione mondiale, molto probabilmente,
scende-rà dal 6,4% nel 1987 al 4,7% nel 2010.
Popolazione totale, tassi di natalità e di mortalità, proiezioni della popolazione
Belgio Danimarca RF di Germania Grecia Spagna Francia Irlanda Italia Lussemburgo Paesi Bassi Portogallo Regno Unito
EUR 12 URSS
USA Giappone Mondo
Popolazione 1987 (1 000)
9 870 5 127 61 099 9 990 38 832 55 630 3 543 57 345 372 14 665 10 250 56 930 323 753 283 000 244 000 122 000
5 024 000
Tassi di natalità
1987
11,9 11,0 10,5 10,7 11,2(') 13,8 16,6 9,6 11,4 12,7 12,0 13,6 11,8 19,4 15,5 11,1 26,0
Tassi di mortalità
1987
10,7 11,3 11,2 9,6 7,9 n 9,5 8,8 9,3 10,8 8,3 9,3 11,3 9,9 10,6 8,7 6,2
9,9
Proiezioni della popolazione (1 000)
2000 2010
9 700 9 400 5 200 5 100 61 000 58 600 10 100 10 600 40 700 41 200 57 900 58 800 3 500 3 400 57 600 56 400
378 377 15 700 16 100
11 100 11 150 58 900 59 400 332 000 331 000 314 500 337 000 268 000 286 000 130 000 133 000
6 122 000 6 989 000
Cambiamenti nella
(%)
1987-2010
-4,4 -1,0 -4,3 5,7 5,7 5,6 -3,6 -1,6 1,3 9,8 8,7 4,3 2,0
19,1 17,3 9,1 39,1 (') Spagna: 1986.
Principali espressioni utilizzate nelle tabelle
Tab.
1
5
6
Col.
2
3,6
4,7
5,8
2
3
6
7
10
11
12
13
2
3
4
5
6
7
8
9
10
Popolazione al 1 ° gennaio
Incremento annuo della
popola-zione
Saldo tra nati e morti
Saldo migratorio
Nati vivi
di cui illegittimi
Nati morti
Morti
Mortalità infantile
— a meno di un anno di età
— a meno di 28 giorni
— a meno di 7 giorni
Aborti legali
Nati vivi per 1 000 abitanti
Nati maschi per 1 000 nati
fem-mine
Nati vivi illegittimi per 1 000 nati
vivi
Nati morti per 1 000 nati (vivi e
morti)
Morti per 1 000 abitanti
Morti nel primo anno per 1 000 nati
vivi
Morti a meno di 28 giorni per 1 000
nati vivi
Tasso di mortalità perinatale
Aborti legali in % dei nati vivi
Tab.
7
8
9
10
11
12
Col.
2-5
4,5,8,9
6,9
10-12
11
12
2
3
5,8
9
2
10
—
—