Advance Access publication 2018 March 16
The relationship between Class I and Class II methanol masers at high
angular resolution
T. P. McCarthy,
1,2‹S. P. Ellingsen,
1M. A. Voronkov
2and G. Cim`o
3,4 1School of Natural Sciences, University of Tasmania, Private Bag 37, Hobart, Tasmania 7001, Australia2Australia Telescope National Facility, CSIRO, PO Box 76, Epping, NSW 1710, Australia 3Joint Institute for VLBI ERIC (JIVE), Postbus 2, NL-7990AA, Dwingeloo, the Netherlands
4Netherlands Institute for Radio Astronomy (ASTRON), Postbus 2, NL-7990AA, Dwingeloo, the Netherlands
Accepted 2018 March 1. Received 2018 February 27; in original form 2017 November 10
A B S T R A C T
We have used the Australia Telescope Compact Array (ATCA) to make the first high-resolution observations of a large sample of class I methanol masers in the 95-GHz (80–71A+) transition. The target sources consist of a statistically complete sample of 6.7-GHz class II methanol masers with an associated 95-GHz class I methanol maser, enabling a detailed study of the relationship between the two methanol maser classes at arcsecond angular resolution. These sources have been previously observed at high resolution in the 36- and 44-GHz transitions, allowing comparison between all three class I maser transitions. In total, 172 95-GHz maser components were detected across the 32 target sources. We find that at high resolution, when considering matched maser components, a 3:1 flux density ratio is observed between the 95- and 44-GHz components, consistent with a number of previous lower angular resolution studies. The 95-GHz maser components appear to be preferentially located closer to the driving sources and this may indicate that this transition is more strongly inverted nearby to background continuum sources. We do not observe an elevated association rate between 95-GHz maser emission and more evolved sources, as indicated by the presence of 12.2-GHz class II masers. We find that in the majority of cases where both class I and class II methanol emission is observed, some component of the class I emission is associated with a likely outflow candidate.
Key words: masers – radio lines: ISM.
1 I N T R O D U C T I O N
Interstellar masers are one of the most readily observable sign-posts of young high-mass star formation regions as strong emission is commonly observed towards them from a range of molecular species and transitions. The most commonly observed maser species in star formation regions are from the OH, water, and methanol molecules, with the latter having the richest centimetre wavelength spectrum of the group. Methanol is an asymmetric top molecule with hindered internal rotation around the C–O bond and it is these characteristics which produce a large number of near-degenerate rotational energy levels. Methanol maser transitions are empirically divided into two classes, known as class I and class II. The class II masers are the better studied methanol masers, with more than 1200 sources having been observed in the 6.7-GHz transition through-out the Milky Way (e.g. Caswell et al.2010, 2011; Green et al. 2010,2012, 2017; Breen et al.2015) and more than 20 different
E-mail:[email protected]
transitions having been detected (see Ellingsen et al.2012, and references therein). Class II transitions are closely associated with main-line OH masers, water masers and are found in compact clus-ters (a typical linear scale of less than 0.03 pc; Caswell1997) close to the infrared sources which mark the location of a young, high-mass star. Class I methanol masers have historically been harder to study as the strongest common transitions are at frequencies of 36- and 44-GHz, which are accessible to less telescopes and fur-thermore, until recently there was no reliable method for targeting searches for these masers. The class I methanol masers are often observed to be distributed over scales of 0.1–1 pc and are further off-set from high-mass stars than class II masers (e.g. Kurtz, Hofner &
´
Voronkov et al.2006,2014). However, these masers may also be associated with shocks resulting from expansion of HIIregions, EGOs, or cloud–cloud interactions (Cyganowski et al.2009,2012; Sjouwerman et al.2010; Voronkov et al.2010,2014).
Early studies of class I and class II methanol masers led to sugges-tions that they might be associated with different types of sources, however this turned out to be an observational bias in that some of the best-studied class I (e.g. Orion KL) and class II (e.g. W3(OH)) maser sources show no emission, or only very weak emission in the other class. Slysh et al. (1994) made a search for 44-GHz class I masers towards a sample of star formation regions known to host either OH maser and/or 6.7-GHz class II methanol masers. They de-tected many new class I methanol masers in this search and claimed an anticorrelation between the velocity ranges and the peak inten-sity of the class I and class II methanol masers in the same sources. Ellingsen (2005) searched for 95-GHz class I methanol masers to-wards a statistically complete sample of class II methanol masers, obtaining detections towards approximately 40 per cent of the sam-ple, however Ellingsen found no evidence for the anticorrelations between the two classes claimed by Slysh et al.
The observations of Ellingsen were made with a single dish and so while they established the statistical relationship between the fraction of class II methanol maser sources which also host a class I methanol maser nearby, they did not show whether the two classes of methanol maser are driven by the same young high-mass star, nor the detailed spatial relationship between them. Here we report interfer-ometric observations made with the Australia Telescope Compact Array (ATCA) of the 95-GHz class I methanol masers towards the sources detected by Ellingsen (2005). The locations of the class II methanol masers in all of these sources are known to sub-arcsecond precision from previous observations (Caswell et al.2011; Green et al.2012) and so we have the opportunity to make the first study of the relationship between class I and class II methanol masers at high resolution in a statistically complete sample.
2 O B S E RVAT I O N S
The observations were undertaken with the ATCA between 2004 September 24 and 26 (project code C1273). The array was in the H75 configuration, with minimum and maximum baselines of 30.6 and 89.2 m, respectively, and the synthesized beam width for the observations at 95-GHz was approximately 6×5 arcsec. The cor-relator was configured with 256 spectral channels across a 32-MHz bandwidth. At an observing frequency of 95-GHz, this corresponds to a total velocity range of 100 km s−1with a velocity resolution of 0.47 km s−1for uniform weighting of the lag function (a channel width of 0.4 km s−1).
The target sources were the detected 95-GHz class I methanol masers from Ellingsen (2005). Ellingsen used the Mopra telescope to search for 95-GHz class I methanol masers towards a statisti-cally complete sample of 6.7-GHz methanol masers in the Galactic longitude rangel=325◦−335◦,b= ±0.53◦. We observed ev-ery source within the aforementioned Galactic longitude range that were observed to have 95-GHz emission in Ellingsen (2005). Not every source observed by Ellingsen was member of their statis-tically complete sample of 6.7-GHz methanol masers. Therefore, 11 of the 32 sources reported here are not within the statistically complete sample due to them falling outside the coordinate/LSR velocity range or being excluded for reasons described in Ellingsen (2005). These 11 sources have been clearly noted in the observa-tion tables, and are not included in analysis where a statistically complete sample is described.
The data were reduced withMIRIADusing the standard techniques for ATCA 3 mm spectral line observations. Amplitude calibration with respect to Uranus and PKS B1921-293 was observed as the bandpass calibrator. The data were corrected for atmospheric opity and the absolute flux densopity calibration is estimated to be ac-curate to 20 per cent. This was estimated by comparing the mea-sured flux density of the bandpass and phase calibrator sources over each of the 3 d of the observations. The observing strategy inter-leaved 5 min on-source for each of the maser targets with 2.5 min observations of a phase calibrator, alternating between two differ-ent phase calibrator sources 1600-44 and 1613-586. The data were self-calibrated (phase-only) using the emission from the brightest 95-GHz methanol maser in each pointing. After self-calibration we used continuum subtraction (modelled using the spectral channels without maser emission) to isolate the spectral line and continuum emission components.
The 95-GHz maser emission was then subsequently imaged with a velocity plane width of 0.25 km s−1. Imaging at higher than the spectral resolution of our observations does not affect our results due to the restrictions we place on determination of individual com-ponents. The pointing centre for each of the observations is listed in Table1, along with information on the total time on-source for each source and the RMS noise for both the continuum data and a 0.25 km s−1spectral resolution image cube. We adopted a rest frequency of 95.169489-GHz for the 80–71A+transition of methanol (M¨uller, Menten & M¨ader2004).
3 R E S U LT S
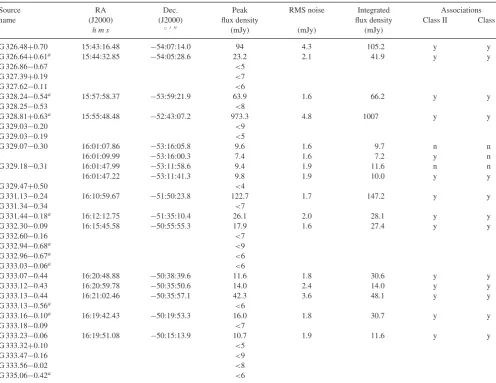
We detected 95-GHz methanol maser emission towards all 32 of our target sources. A continuum source was detected in 14 out of 32 target pointings. The majority of continuum sources detected were point sources, however, more extended continuum emission was observed in four cases (G 326.641+0.61, G 331.132−0.24, G 333.068−0.44, and G 333.163−0.10). Table 2contains details of the location and flux density of these continuum sources, along with information on whether the 6.7-GHz pointing target or 95-GHz class I masers were associated. An association was considered to exist between the 95-GHz continuum emission and the two maser species, if the maser components were within 3 s of arc from the peak continuum emission.
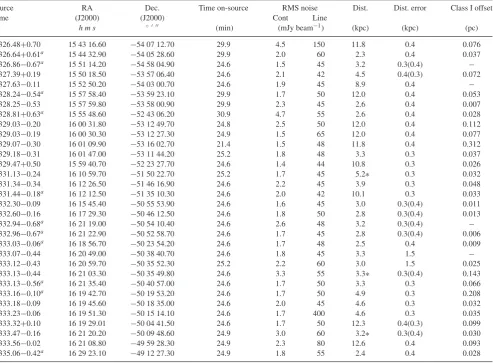
Table 1. The coordinates of the pointing centre for each of the 6.7-GHz class II maser sites observed, along with on-source time and RMS noise for the observations. Distance estimates to the target sources along with their associated error (values in parenthesis are the negative error bars in cases where errors are asymmetrical) are also included and drawn from Green & McClure-Griffiths (2011). Three sources (G 331.13−0.24, G 333.128−0.44, and G 333.466−0.16) did not have previously estimated linear distances, for these sources a near kinematic distance has been assumed using the same parameters and methodology presented in Green & McClure-Griffiths (2011) and their distances denoted with an asterisk. The final column reports the linear offset between each class II pointing target and the closest detected 95-GHz maser component with velocity coincident to the velocity range of the class II emission (for the estimated distance). Velocity range values for the class II sources are drawn from Caswell et al. (2011) and Green et al. (2012).
Source RA Dec. Time on-source RMS noise Dist. Dist. error Class I offset
name (J2000) (J2000) Cont Line
h m s ◦ (min) (mJy beam−1) (kpc) (kpc) (pc)
G 326.48+0.70 15 43 16.60 −54 07 12.70 29.9 4.5 150 11.8 0.4 0.076
G 326.64+0.61a 15 44 32.90 −54 05 28.60 29.9 2.0 60 2.3 0.4 0.037
G 326.86−0.67a 15 51 14.20 −54 58 04.90 24.6 1.5 45 3.2 0.3(0.4) −
G 327.39+0.19 15 50 18.50 −53 57 06.40 24.6 2.1 42 4.5 0.4(0.3) 0.072
G 327.63−0.11 15 52 50.20 −54 03 00.70 24.6 1.9 45 8.9 0.4 −
G 328.24−0.54a 15 57 58.40 −53 59 23.10 29.9 1.7 50 12.0 0.4 0.053
G 328.25−0.53 15 57 59.80 −53 58 00.90 29.9 2.3 45 2.6 0.4 0.007
G 328.81+0.63a 15 55 48.60 −52 43 06.20 30.9 4.7 55 2.6 0.4 0.028
G 329.03−0.20 16 00 31.80 −53 12 49.70 24.8 2.5 50 12.0 0.4 0.112
G 329.03−0.19 16 00 30.30 −53 12 27.30 24.9 1.5 65 12.0 0.4 0.077
G 329.07−0.30 16 01 09.90 −53 16 02.70 21.4 1.5 48 11.8 0.4 0.312
G 329.18−0.31 16 01 47.00 −53 11 44.20 25.2 1.8 48 3.3 0.3 0.037
G 329.47+0.50 15 59 40.70 −52 23 27.70 24.6 1.4 44 10.8 0.3 0.026
G 331.13−0.24 16 10 59.70 −51 50 22.70 25.2 1.7 45 5.2∗ 0.3 0.032
G 331.34−0.34 16 12 26.50 −51 46 16.90 24.6 2.2 45 3.9 0.3 0.048
G 331.44−0.18a 16 12 12.50 −51 35 10.30 24.6 2.0 42 10.1 0.3 0.033
G 332.30−0.09 16 15 45.40 −50 55 53.90 24.6 1.6 45 3.0 0.3(0.4) 0.011
G 332.60−0.16 16 17 29.30 −50 46 12.50 24.6 1.8 50 2.8 0.3(0.4) 0.013
G 332.94−0.68a 16 21 19.00 −50 54 10.40 24.6 2.6 48 3.2 0.3(0.4) −
G 332.96−0.67a 16 21 22.90 −50 52 58.70 24.6 1.7 45 2.8 0.3(0.4) 0.006
G 333.03−0.06a 16 18 56.70 −50 23 54.20 24.6 1.7 48 2.5 0.4 0.009
G 333.07−0.44 16 20 49.00 −50 38 40.70 24.6 1.8 45 3.3 1.5 −
G 333.12−0.43 16 20 59.70 −50 35 52.30 25.2 2.2 60 3.0 1.5 0.025
G 333.13−0.44 16 21 03.30 −50 35 49.80 24.6 3.3 55 3.3∗ 0.3(0.4) 0.143
G 333.13−0.56a 16 21 35.40 −50 40 57.00 24.6 1.7 50 3.3 0.3 0.066
G 333.16−0.10a 16 19 42.70 −50 19 53.20 24.6 1.7 50 4.9 0.3 0.208
G 333.18−0.09 16 19 45.60 −50 18 35.00 24.6 2.0 45 4.6 0.3 0.032
G 333.23−0.06 16 19 51.30 −50 15 14.10 24.6 1.7 400 4.6 0.3 0.035
G 333.32+0.10 16 19 29.01 −50 04 41.50 24.6 1.7 50 12.3 0.4(0.3) 0.099
G 333.47−0.16 16 21 20.20 −50 09 48.60 24.9 3.0 60 3.2∗ 0.3(0.4) 0.030
G 333.56−0.02 16 21 08.80 −49 59 28.30 24.9 2.3 80 12.6 0.4 0.093
G 335.06−0.42a 16 29 23.10 −49 12 27.30 24.9 1.8 55 2.4 0.4 0.028
Note.aSources are not within the statistically complete sample of 6.7-GHz methanol masers
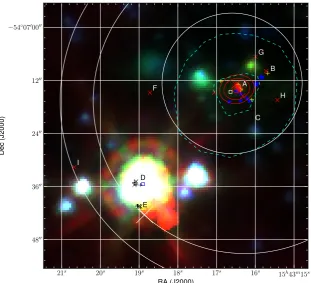
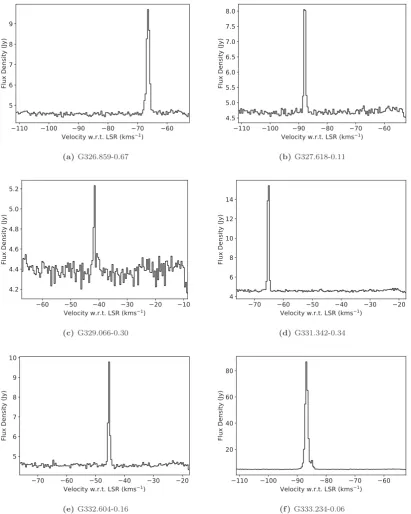
We aim to compare our observations to those presented in Voronkov et al. (2014), who imaged 71 southern class I methanol maser sources at 36- and 44-GHz with the ATCA, with typ-ical 1σ RMS noise levels of ∼70 and ∼120 mJy at 36- and 44-GHz, respectively. Voronkov et al. identified class I compo-nents that were roughly spatially associated and assigned them a letter name for ease of reference. We have used these same lo-cations for grouping and referring to the components presented here. The 95-GHz components, along with the 36- and 44-GHz components from Voronkov et al. (2014), have been plotted on a series of field images (see Fig.1). There are 30 field images to-tal, covering the 32 targets sources from our observations, as two fields have multiple pointings (G329.03–0.20 and G333.13–0.44). In addition to these field images, Fig.2 shows scalar averaged spectra for all sources (except G328.25−0.53 where scalar aver-aging prevented emission from being clearly identifiable). These spectra all appear very similar to those presented in Ellingsen, Shabala & Kurtz (2005) for the same sources, albeit with generally higher SNR.
In all but three instances, locations containing 95-GHz compo-nents also harbour 44-GHz emission (as specified by Voronkov et al.2014). The exceptions occur in the sources G328.25−0.53 and G328.81+0.63, where the 95-GHz masers are located within
∼4 arcsec of a class II 6.7-GHz maser, but do not have an associated 44-GHz class I component.
Table 2. Details of the continuum sources detected in 14 of the pointing targets. Including location of the peak emission, peak flux density, integrated flux density and whether any association is observed with either class II 6.7-GHz masers or detected 95-GHz masers.
Source RA Dec. Peak RMS noise Integrated Associations
name (J2000) (J2000) flux density flux density Class II Class I
h m s ◦ (mJy) (mJy) (mJy)
G 326.48+0.70 15:43:16.48 −54:07:14.0 94 4.3 105.2 y y
G 326.64+0.61a 15:44:32.85 −54:05:28.6 23.2 2.1 41.9 y y
G 326.86−0.67 <5
G 327.39+0.19 <7
G 327.62−0.11 <6
G 328.24−0.54a 15:57:58.37 −53:59:21.9 63.9 1.6 66.2 y y
G 328.25−0.53 <8
G 328.81+0.63a 15:55:48.48 −52:43:07.2 973.3 4.8 1007 y y
G 329.03−0.20 <9
G 329.03−0.19 <5
G 329.07−0.30 16:01:07.86 −53:16:05.8 9.6 1.6 9.7 n n
16:01:09.99 −53:16:00.3 7.4 1.6 7.2 y n
G 329.18−0.31 16:01:47.99 −53:11:58.6 9.4 1.9 11.6 n n
16:01:47.22 −53:11:41.3 9.8 1.9 10.0 y y
G 329.47+0.50 <4
G 331.13−0.24 16:10:59.67 −51:50:23.8 122.7 1.7 147.2 y y
G 331.34−0.34 <7
G 331.44−0.18a 16:12:12.75 −51:35:10.4 26.1 2.0 28.1 y y
G 332.30−0.09 16:15:45.58 −50:55:55.3 17.9 1.6 27.4 y y
G 332.60−0.16 <7
G 332.94−0.68a <9
G 332.96−0.67a <6
G 333.03−0.06a <6
G 333.07−0.44 16:20:48.88 −50:38:39.6 11.6 1.8 30.6 y y
G 333.12−0.43 16:20:59.78 −50:35:50.6 14.0 2.4 14.0 y y
G 333.13−0.44 16:21:02.46 −50:35:57.1 42.3 3.6 48.1 y y
G 333.13−0.56a <6
G 333.16−0.10a 16:19:42.43 −50:19:53.3 16.0 1.8 30.7 y y
G 333.18−0.09 <7
G 333.23−0.06 16:19:51.08 −50:15:13.9 10.7 1.9 11.6 y y
G 333.32+0.10 <5
G 333.47−0.16 <9
G 333.56−0.02 <8
G 335.06−0.42a <6
NOte.aSources are not within the statistically complete sample of 6.7-GHz methanol masers.
3.1 Notes on individual sources
With the exception of G333.07−0.44, all the sources reported here have previous high resolution observations of the 36- and 44-GHz transitions by Voronkov et al. (2014). In the comments below, we have not repeated the information given by Voronkov et al. relating to the general class I maser distribution, we comment only on the specifics of the new 95-GHz methanol maser information.
The field images presented in this study are created in the same way as those previously presented by Voronkov et al. (2014) and therefore any prior comment on theSpitzerbackground images for individual sources will apply here.
3.1.1 G326.48+0.70
The majority of 95-GHz methanol maser emission is associated with site A, close to the north-west class II 6.7-GHz maser. 95-GHz components trace the same linear structure, beginning at A and extending south-west, observed in the 36- and 44-GHz transi-tions. Within the FWHM of the 95-GHz primary beam, there are two EGOs, both considered likely outflow candidates (Cyganowski et al. 2008). There is an EGO located at A (obscured by maser
symbols at this location in Fig.1), along with a larger region sev-eral arcseconds to the east. Class I methanol maser emission is associated with both of these EGOs (only the western edge of the larger EGO), however, 95-GHz methanol maser emission is only spatially associated with the EGO at A. In addition to these two EGOs, there is another infrared source with 4.5-µm excess within the half-power range of our observations, located south-east of G. There is 3.5-mm continuum source detected at A, with peak inten-sity coincident with the densest cluster of class I methanol maser emission. 36- and 44-GHz emission has been detected in a second nearby 6.7-GHz maser, located in the south-east of this field and associated with a strong infrared source. However, this region is far beyond the half-power point of our 95-GHz pointing. A follow-up observation of this south-eastern class II source would likely pro-vide additional detections of 95-GHz class I methanol emission in this region.
3.1.2 G326.64+0.61
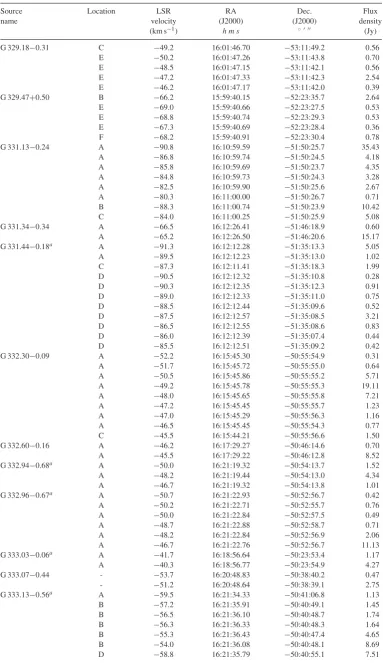
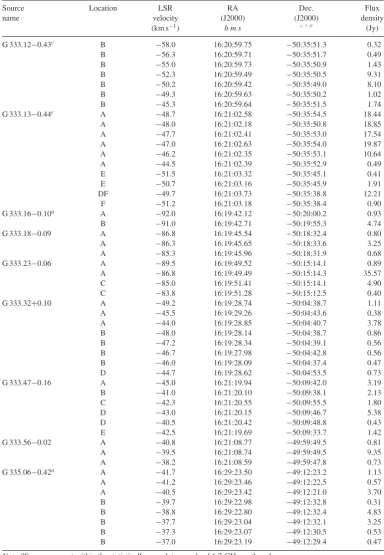
Table 3. Detailed list of the 95 GHz components detected in each maser site, including their alphabetical location as defined by Voronkov et al. (2014), positions, and flux density. Source names have been converted from those of the individual pointings to those used by Voronkov et al. (2014); This results in two cases where two 95‘GHz pointings have been combined into one source.
Source Location LSR RA Dec. Flux
name velocity (J2000) (J2000) density
(km s−1) h m s ◦ (Jy)
G 326.48+0.70 A −47.0 15:43:16.67 −54:07:16.9 0.31
A −46.3 15:43:16.38 −54:07:16.6 0.33
A −45.2 15:43:16.49 −54:07:14.5 0.85
A −44.0 15:43:16.46 −54:07:14.3 6.04
A −41.7 15:43:16.37 −54:07:15.1 8.18
A −40.5 15:43:16.15 −54:07:16.7 14.62
A −37.7 15:43:16.22 −54:07:16.1 1.96
B −39.5 15:43:15.98 −54:07:12.9 3.56
B −39.3 15:43:15.84 −54:07:11.3 4.31
G 326.64+0.61a B −43.0 15:44:33.60 −54:05:20.9 0.50
B −37.3 15:44:33.60 −54:05:23.0 1.57
D −41.0 15:44:32.96 −54:05:31.0 0.99
D −40.8 15:44:32.72 −54:05:33.2 1.27
D −40.0 15:44:32.95 −54:05:30.8 3.17
D −38.2 15:44:32.85 −54:05:32.3 6.45
G 326.86−0.67 A −67.3 15:51:13.84 −54:58:04.7 3.22
A −66.7 15:51:13.73 −54:58:05.0 8.31
A −66.0 15:51:13.76 −54:58:05.1 5.79
A −65.5 15:51:13.91 −54:58:05.2 1.44
B −68.8 15:51:14.11 −54:58:03.8 0.53
B −67.8 15:51:14.05 −54:58:03.9 2.04
G 327.39+0.19 B −88.8 15:50:18.53 −53:57:06.3 3.30
B −87.3 15:50:18.32 −53:57:07.8 1.96
B −86.5 15:50:18.13 −53:57:07.4 0.57
G 327.62−0.11 A −88.0 15:52:50.20 −54:03:00.9 6.78
B −86.8 15:52:50.31 −54:03:05.5 0.88
G 328.24−0.54a A −42.3 15:57:58.38 −53:59:22.9 0.99
A −41.7 15:57:58.34 −53:59:20.3 1.12
A −40.8 15:57:58.27 −53:59:17.7 7.55
A −40.0 15:57:58.39 −53:59:20.5 0.42
A −39.3 15:57:58.55 −53:59:19.5 0.54
A −37.7 15:57:58.66 −53:59:19.8 0.42
B −44.0 15:57:58.46 −53:59:31.3 0.49
B −43.2 15:57:58.28 −53:59:31.3 1.86
G 328.25−0.53 - −44.0 15:57:59.93 −53:57:57.4 0.53
- −43.5 15:57:59.82 −53:58:01.5 0.47
- −41.7 15:57:59.81 −53:58:00.5 1.67
G 328.81+0.63 A −42.0 15:55:50.23 −52:43:21.7 4.72
B −42.5 15:55:49.15 −52:43:23.6 3.66
C −41.0 15:55:48.25 −52:43:19.8 2.46
C −40.3 15:55:48.49 −52:43:19.5 14.89
J −44.7 15:55:48.48 −52:43:06.5 1.22
J −43.5 15:55:48.53 −52:43:05.8 1.66
J −38.0 15:55:48.84 −52:43:07.1 0.50
G 329.03−0.20a b A −46.5 16:00:30.33 −53:12:28.7 1.65
F −43.2 16:00:31.98 −53:12:45.7 18.87
F −42.0 16:00:31.84 −53:12:47.2 9.09
G −41.2 16:00:31.90 −53:12:55.8 3.67
G −40.5 16:00:31.76 −53:12:51.5 3.12
G −39.7 16:00:31.81 −53:12:52.6 3.13
G −38.2 16:00:32.05 −53:12:53.7 1.40
G −37.5 16:00:32.01 −53:12:54.7 4.15
G 329.03−0.19b A −46.5 16:00:30.29 −53:12:28.6 16.06
A −44.7 16:00:30.06 −53:12:26.0 1.09
B −45.5 16:00:30.45 −53:12:13.5 2.99
D −44.2 16:00:30.46 −53:12:19.6 0.67
G 329.07−0.30 D −41.7 16:01:08.95 −53:16:07.8 2.87
D −40.5 16:01:09.33 −53:16:03.5 0.37
Table 3 –continued
Source Location LSR RA Dec. Flux
name velocity (J2000) (J2000) density
(km s−1) h m s ◦ (Jy)
G 329.18−0.31 C −49.2 16:01:46.70 −53:11:49.2 0.56
E −50.2 16:01:47.26 −53:11:43.8 0.70
E −48.5 16:01:47.15 −53:11:42.1 0.56
E −47.2 16:01:47.33 −53:11:42.3 2.54
E −46.2 16:01:47.17 −53:11:42.0 0.39
G 329.47+0.50 B −66.2 15:59:40.15 −52:23:35.7 2.64
E −69.0 15:59:40.66 −52:23:27.5 0.53
E −68.8 15:59:40.74 −52:23:29.3 0.53
E −67.3 15:59:40.69 −52:23:28.4 0.36
F −68.2 15:59:40.91 −52:23:30.4 0.78
G 331.13−0.24 A −90.8 16:10:59.59 −51:50:25.7 35.43
A −86.8 16:10:59.74 −51:50:24.5 4.18
A −85.8 16:10:59.69 −51:50:23.7 4.35
A −84.8 16:10:59.73 −51:50:24.3 3.28
A −82.5 16:10:59.90 −51:50:25.6 2.67
A −80.3 16:11:00.00 −51:50:26.7 0.71
B −88.3 16:11:00.74 −51:50:23.9 10.42
C −84.0 16:11:00.25 −51:50:25.9 5.08
G 331.34−0.34 A −66.5 16:12:26.41 −51:46:18.9 0.60
A −65.2 16:12:26.50 −51:46:20.6 15.17
G 331.44−0.18a A −91.3 16:12:12.28 −51:35:13.3 5.05
A −89.5 16:12:12.23 −51:35:13.0 1.02
C −87.3 16:12:11.41 −51:35:18.3 1.99
D −90.5 16:12:12.32 −51:35:10.8 0.28
D −90.3 16:12:12.35 −51:35:12.3 0.91
D −89.0 16:12:12.33 −51:35:11.0 0.75
D −88.5 16:12:12.44 −51:35:09.6 0.52
D −87.5 16:12:12.57 −51:35:08.5 3.21
D −86.5 16:12:12.55 −51:35:08.6 0.83
D −86.0 16:12:12.39 −51:35:07.4 0.44
D −85.5 16:12:12.51 −51:35:09.2 0.42
G 332.30−0.09 A −52.2 16:15:45.30 −50:55:54.9 0.31
A −51.7 16:15:45.72 −50:55:55.0 0.64
A −50.5 16:15:45.86 −50:55:55.2 5.71
A −49.2 16:15:45.78 −50:55:55.3 19.11
A −48.0 16:15:45.65 −50:55:55.8 7.21
A −47.2 16:15:45.45 −50:55:55.7 1.23
A −47.0 16:15:45.29 −50:55:56.3 1.16
A −46.5 16:15:45.45 −50:55:54.3 0.77
C −45.5 16:15:44.21 −50:55:56.6 1.50
G 332.60−0.16 A −46.2 16:17:29.27 −50:46:14.6 0.70
A −45.5 16:17:29.22 −50:46:12.8 8.52
G 332.94−0.68a A −50.0 16:21:19.32 −50:54:13.7 1.52
A −48.2 16:21:19.44 −50:54:13.0 4.34
A −46.7 16:21:19.32 −50:54:13.8 1.01
G 332.96−0.67a A −50.7 16:21:22.93 −50:52:56.7 0.42
A −50.2 16:21:22.71 −50:52:55.7 0.76
A −50.0 16:21:22.84 −50:52:57.5 0.49
A −48.7 16:21:22.88 −50:52:58.7 0.71
A −48.2 16:21:22.84 −50:52:56.9 2.06
A −46.7 16:21:22.76 −50:52:56.7 11.13
G 333.03−0.06a A −41.7 16:18:56.64 −50:23:53.4 1.17
A −40.3 16:18:56.77 −50:23:54.9 4.27
G 333.07−0.44 - −53.7 16:20:48.83 −50:38:40.2 0.47
- −51.2 16:20:48.64 −50:38:39.1 2.75
G 333.13−0.56a A −59.5 16:21:34.33 −50:41:06.8 1.13
B −57.2 16:21:35.91 −50:40:49.1 1.45
B −56.5 16:21:36.10 −50:40:48.7 1.74
B −56.3 16:21:36.33 −50:40:48.3 1.64
B −55.3 16:21:36.43 −50:40:47.4 4.65
B −54.0 16:21:36.08 −50:40:48.1 8.69
Table 3 –continued
Source Location LSR RA Dec. Flux
name velocity (J2000) (J2000) density
(km s−1) h m s ◦ (Jy)
G 333.12−0.43c B −58.0 16:20:59.75 −50:35:51.3 0.32
B −56.3 16:20:59.71 −50:35:51.7 0.49
B −55.0 16:20:59.73 −50:35:50.9 1.43
B −52.3 16:20:59.49 −50:35:50.5 9.31
B −50.2 16:20:59.42 −50:35:49.0 8.10
B −49.3 16:20:59.63 −50:35:50.2 1.02
B −45.3 16:20:59.64 −50:35:51.5 1.74
G 333.13−0.44c A −48.7 16:21:02.58 −50:35:54.5 18.44
A −48.0 16:21:02.18 −50:35:50.8 18.85
A −47.7 16:21:02.41 −50:35:53.0 17.54
A −47.0 16:21:02.63 −50:35:54.0 19.87
A −46.2 16:21:02.35 −50:35:53.1 10.64
A −44.5 16:21:02.39 −50:35:52.9 0.49
E −51.5 16:21:03.32 −50:35:45.1 0.41
E −50.7 16:21:03.16 −50:35:45.9 1.91
DF −49.7 16:21:03.73 −50:35:38.8 12.21
F −51.2 16:21:03.18 −50:35:38.4 0.90
G 333.16−0.10a A −92.0 16:19:42.12 −50:20:00.2 0.93
B −91.0 16:19:42.71 −50:19:55.3 4.74
G 333.18−0.09 A −86.8 16:19:45.54 −50:18:32.4 0.80
A −86.3 16:19:45.65 −50:18:33.6 3.25
A −85.3 16:19:45.96 −50:18:31.9 0.68
G 333.23−0.06 A −89.5 16:19:49.52 −50:15:14.1 0.89
A −86.8 16:19:49.49 −50:15:14.3 35.57
C −85.0 16:19:51.41 −50:15:14.1 4.90
C −83.8 16:19:51.28 −50:15:12.5 0.40
G 333.32+0.10 A −49.2 16:19:28.74 −50:04:38.7 1.11
A −45.5 16:19:29.26 −50:04:43.6 0.38
A −44.0 16:19:28.85 −50:04:40.7 3.78
B −48.0 16:19:28.14 −50:04:38.7 0.86
B −47.2 16:19:28.34 −50:04:39.1 0.56
B −46.7 16:19:27.98 −50:04:42.8 0.56
B −46.0 16:19:28.09 −50:04:37.4 0.47
D −44.7 16:19:28.62 −50:04:53.5 0.73
G 333.47−0.16 A −45.0 16:21:19.94 −50:09:42.0 3.19
B −41.0 16:21:20.10 −50:09:38.1 2.13
C −42.3 16:21:20.55 −50:09:55.5 1.80
D −43.0 16:21:20.15 −50:09:46.7 5.38
D −40.5 16:21:20.42 −50:09:48.8 0.43
E −42.5 16:21:19.69 −50:09:33.7 1.42
G 333.56−0.02 A −40.8 16:21:08.77 −49:59:49.5 0.81
A −39.5 16:21:08.74 −49:59:49.5 9.35
A −38.2 16:21:08.59 −49:59:47.8 0.73
G 335.06−0.42a A −41.7 16:29:23.50 −49:12:23.2 1.13
A −41.2 16:29:23.46 −49:12:22.5 0.57
A −40.5 16:29:23.42 −49:12:21.0 3.70
B −39.7 16:29:22.98 −49:12:32.8 0.31
B −38.8 16:29:22.80 −49:12:32.4 4.83
B −37.7 16:29:23.04 −49:12:32.1 3.25
B −37.3 16:29:23.07 −49:12:30.5 0.53
B −37.0 16:29:23.19 −49:12:29.4 0.47
Note.aSources are not within the statistically complete sample of 6.7-GHz methanol masers.
bComponents from this target are included in the multipointing field image G 329.03−0.20. cComponents from this target are included in the multipointing field image G 333.13−0.44.
our observations contains the majority of locations of previously detected methanol maser emission (A, B, D, E, G, and J). 95-GHz maser emission is observed in two locations (B and D). A 3.5-mm continuum source is detected near D and E (∼3 arcsec north-west
Figure 1. Field image for G 326.48+0.70 and field images for the remaining 29 class I sources are available online. Four different symbols are projected on theSpitzerbackground images, a square symbol represents a 6.7-GHz class II methanol maser, and the cross, plus, and star symbols represent 36-, 44-, and 95-GHz class I maser emission, respectively. Solid contours on the images represent 95-GHz continuum emission where applicable. Dashed contours represent the 50 per cent and 90 per cent levels of the ATLASGAL emission. The white circles, in order of increasing size, represent the full width at half-maximum (FWHM) of the primary beam and are centred on the pointing direction for the 95-, 44-, and 36-GHz observations.
3.1.3 G326.86−0.68
Class I emission is relatively tightly clustered in this source, with locations B and A containing all the observed 95-GHz maser com-ponents. The class I emission at B is associated with a 6.7-GHz class II maser. East of the class II maser is a dark cloud, with class I emission at B and C located at the interface of this region (Peretto & Fuller2009). The 95-GHz masers in this source are located at the south-east edge of an EGO (likely outflow candidate according to Cyganowski et al.2008).
3.1.4 G327.39+0.20
The methanol maser emission is separated into two separate loca-tions (A and B), both with 6.7-GHz masers and associated with strong infrared sources. The 95-GHz pointing was centred on the westernmost 6.7-GHz maser (327.392+0.199) within this field. Al-though both locations are within the FWHM of the 95-GHz primary beam, 95-GHz maser emission is only observed at B. The infrared source associated with B also contains a 4.5-µm halo that has been classified as an EGO and considered a possible outflow candidate in Cyganowski et al. (2008).
3.1.5 G327.62−0.11
The centre of this field contains a strong infrared source where the 6.7-GHz maser target and class I maser location A is situated. Only two 95-GHz components were observed in this source, one component tightly co-located with the 6.7-GHz maser, and one
component at B on the southern edge of the infrared source. Similar to what is observed in the other class I transitions, the 95-GHz maser emission at location A is considerably stronger than that observed in B (Voronkov et al.2014).
3.1.6 G328.24−0.55
The 6.7-GHz pointing target is in the south-western corner of the field, with the majority of class I maser emission located nearby in A and B. The 95-GHz masers at A are loosely clustered, with the majority of these components being associated with other class I maser emission. The 6.7-GHz maser is a few arcseconds south of A and associated with a 95-GHz component. A 3.5-mm continuum source is observed, co-spatially associated with the class II 6.7-GHz maser. The 95-GHz masers at A appear to follow some sort of arc that may be related to the 8.0-µm PDR situated north-east of these masers.
3.1.7 G328.25−0.53
Figure 2. Representative spectra of 95-GHz class I methanol masers from the current observations. Spectra for the remaining sources in the sample are available online. The spectra were extracted from scalar averaging of the self-calibrated ultraviolet (UV)-data used to create spectral line image cubes. Scalar averaged spectra allow us to see maser emission from all class I locations in the primary beam, but have a positive offset baseline because of contributions from the system temperature of the receivers and any continuum emission in the primary beam.
transitions of class I emission. An EGO is also nearby to this class II source (likely outflow candidate according to Cyganowski et al. 2008), with one 95-GHz component located at the interface of the EGO and the infrared source.
3.1.8 G328.81+0.63
Two strong class II 6.7-GHz masers, separated by 2.5, are projected on to a HIIregion in the centre of this field (Walsh et al.1998;
flux densities at these projected locations. 95-GHz masers at B and C trace the southern edge of the diffuse 8.0-µm excess south of the HIIregion.
3.1.9 G329.03−0.20
This field contains two separate 95-GHz pointings, one centred on the north-western 6.7-GHz maser 329.031-0.198 and the other on the south-eastern 6.7-GHz maser 329.029−0.205. Class I maser emission in the south-east pointing is organized in a linear structure (from F to H), extending north and south from the class II point-ing target. The majority of the 95-GHz emission in the north-west pointing is clustered about the 6.7-GHz maser (location A). An EGO is present in this field (classified as likely outflow candidate by Cyganowski et al.2008), several arcseconds south of A, with a single 36-GHz component located on its western edge.
3.1.10 G329.07−0.31
The class II 6.7-GHz maser target is located in the centre of a strong infrared source. An additional strong infrared source is on the east-ern edge of the FWHM of the 95-GHz primary beam. Extended 4.5-µm emission is present near both of the infrared sources, with both being classified as possible outflow candidates by Cyganowski et al. (2008). All detected 95-GHz maser components are located south-west of the 6.7-GHz maser, at the interface of the EGO be-tween the western infrared source and location D. Interestingly we see the second case of a 95-GHz maser being offset from any previously observed class I maser emission, with the maser spot associated with the western edge of the infrared source. There are two weak continuum sources detected in this field, the weaker con-tinuum source is spatially associated with the 6.7-GHz maser, and the stronger (40 per cent brighter) continuum source is located north-west of D, with no associated methanol emission or infrared source.
3.1.11 G329.18−0.31
The 6.7-GHz maser target’s location is projected on to a promi-nent EGO (likely outflow candidate according to Cyganowski et al. 2008). The 95-GHz masers at E appear to trace the eastern boundary of the YSO and the EGO. The 95-GHz component at C is also lo-cated on the south-western edge of the EGO. Two weak continuum sources are detected in this region. The northern-most is position-ally associated with the class I emission and 6.7-GHz maser at E. The southern-most continuum source is outside the FWHM of the 95-GHz primary beam with no visible associations. Both locations D and F contain comparatively bright 44-GHz class I methanol masers and are within the half-power range of the 95-GHz primary beam, however, no 95-GHz emission was detected in either of these regions.
3.1.12 G329.47+0.50
The majority of class I maser emission is clustered around the 6.7-GHz maser in the centre of the field. This class II source is on the eastern edge of an EGO (classified as a likely outflow candidate by Cyganowski et al.2008). The majority of 95-GHz maser emission in this source is arranged in a line extending from the position of the 6.7-GHz maser towards the south-east.
3.1.13 G331.13−0.24
The 6.7-GHz source is located on the north-eastern edge of one of the northern-most HIIregions in the field. This class II source is po-sitioned at the interface between an EGO (likely outflow candidate according to Cyganowski et al.2008) and this HIIregion. 95-GHz masers are located at the three locations nearby to this HIIregion. The 95-GHz maser components are organized into a curve starting at the position of the 6.7-GHz maser, going through C and ending to the east at location B. A 3.5-mm continuum source is detected, encompassing the entire northern HIIregion, including the majority of 95-GHz emission.
3.1.14 G331.34−0.35
A strong infrared source dominates the centre of this compact class I maser. The 6.7-GHz maser is situated centrally to this infrared source. A class I masing component with emission from 36-, 44-, and 95-GHz is situated at the interface between the strong infrared source and an EGO (classified as a possible outflow candidate by Cyganowski et al.2008). We observe another component at 95 GHz to the north-west, closer to the location of the 6.7-GHz maser.
3.1.15 G331.44−0.19
The 6.7-GHz class II target source is projected on to the edge of a compact HIIregion. 95-GHz masers are detected at all three lo-cations (A, C, and D) that fall within the half power point of the 95-GHz primary beam. A second 6.7-GHz maser is also located within the FWHM of the 95-GHz primary beam at C. 95-GHz emission in A and D trace a line across the HIIregion, connecting the two locations. The majority of 36- and 44-GHz components reported by Voronkov et al. (2014) form a line extending to the south-west from A through to E. Due to the line of 95-GHz com-ponents connecting D and A, class I maser emission from locations A through E may be all part of the same linear structure. A 3.5-mm continuum source is detected near D, with the emission between D and A tracing the outer edge of the emission.
3.1.16 G332.30−0.09
Two closely separated 6.7-GHz masers are within this field, the western 6.7-GHz maser (332.2950.094, the pointing target for this source), is located at the southern edge of an EGO (possible out-flow candidate according to Cyganowski et al.2008), and the second maser (332.296−0.094) is approximately 3 arcsec to the east. All but one of the 95-GHz maser components in this source are clus-tered between the northern edge of a HIIregion and the EGO to the north-west, with the other component situated∼15 arcsec west. The 95-GHz components close to the eastern 6.7-GHz maser appear to be systematically offset by∼1 arcsec south of the nearby 44-GHz maser components. An elongated 3.5-mm continuum source is de-tected at the location of the two 6.7-GHz masers, and encompasses all the 95-GHz maser emission at A.
3.1.17 G332.60−0.17
3.1.18 G332.94−0.69
The class II 6.7-GHz maser is located on the eastern edge of an infrared source, surrounded by an EGO (classified as likely outflow candidate by Cyganowski et al.2008) extending towards the east. All 95-GHz masers are situated at location A within the south-eastern region of the EGO. No 95-GHz maser emission is detected in location B, despite the relative brightness of the detected 44-GHz components.
3.1.19 G332.96−0.68
Location A, at the northern edge of a infrared point source with associated EGO (likely outflow candidate according to Cyganowski et al.2008), contains the majority of class I emission in this source. The EGO extends to the south-east, ending near B. The 6.7-GHz target maser is projected on this infrared point source, with the bulk of the observed 95-GHz emission clustered closely associated.
3.1.20 G333.03−0.06
The 6.7-GHz maser along with class I emission in this source is tightly clustered between a strong infrared source and a region of 4.5-µm excess (not classified as EGO by Cyganowski et al.2008). The 95-GHz masers here have a close association with the 44-GHz maser components.
3.1.21 G333.07−0.45
This is the source with no previous observation made by Voronkov et al. (2014). The 6.7-GHz maser pointing target is projected on to the centre of a bright infrared region, surrounded by a region of 4.5-µm excess. There are two detected 95-GHz masers in this source, both offset to the north-west of the class II maser. An elongated 3.5-mm continuum source is detected, with peak emission co-located with the 6.7-GHz masers and an extension towards the south-east.
3.1.22 G333.13−0.44
Four 6.7-GHz class II masers are present in this field, with two separate 95-GHz pointings covering the densest regions of class I emission (targets 333.128-0.440 in the east and 333.121-0.434 in the west). The half-power range of the eastern pointing contains four distinct regions of class I emission (A, D, E, and F), with a secondary 6.7-GHz maser associated with a strong infrared source at A. All 95-GHz masers from the eastern pointing form a line, starting at the position of the 6.7-GHz maser at A and extending towards the north-west. A 3.5-mm continuum source is also detected a few arcseconds south-west of this secondary 6.7-GHz maser.
The western pointing contains a single compact region of class I emission, clustered about the 6.7-GHz maser target (B), and located near the edge of a dark cloud. A 3.5-mm continuum source is also detected at this location, encompassing the 6.7-GHz maser and all but one of the 95-GHz maser components at B.
3.1.23 G333.13−0.56
The pointing target for this class I source was the southern-most of the two closely spaced 6.7-GHz masers, 333.128−0.560. 95-GHz masers are seen at three separate locations within this source, with
the majority associated with an EGO (classified as possible outflow candidate by Cyganowski et al.2008) north-east of the northern 6.7-GHz maser (B). These 95-GHz components appear to be dis-tributed in a line across the EGO. Bright 95-GHz emission is also observed at D, equidistant from both class II masers. Emission from all three different class I transitions is projected at this location (D), with the masers potentially being associated with a slight 4.5-µm excess. Voronkov et al. (2014) suggested that B and D might be connected with a curved 4.5-µm structure going through the nearby 6.7-GHz maser.
3.1.24 G333.16−0.10
6.7-GHz maser is associated with the eastern side of a strong in-frared source, and HII region in the centre of the field. Class I maser emission is observed in two compact locations (A and B) in this source. The masers at B are close to the 6.7-GHz maser (∼2 arcsec), whereas class I emission at A is offset to the south of the infrared source. An elongated 3.5-mm continuum source is detected, encompassing the infrared source and class I and class II emission at B.
3.1.25 G333.18−0.09
The 6.7-GHz maser target is associated with an infrared point source surround by a prominent EGO (classified as likely outflow candi-date by Cyganowski et al.2008) extending to the south-east. The 95-GHz maser components are spatially associated with the loca-tion of previously reported 36- and 44-GHz components at A along the northern edge of the EGO.
3.1.26 G333.23−0.06
The south-eastern 6.7-GHz maser (333.234–0.062) is the point-ing target of the 95-GHz observations in this source. A secondary 6.7-GHz maser (333.234–0.060) is located a few arcseconds north-west, and is associated with a bright infrared source. 95-GHz emis-sion is distributed between two locations, A and C. The former is outside the FWHM of the 95-GHz primary beam, however, it contains a very bright 95-GHz component (35.57 Jy, strong rela-tive to the typical 95-GHz flux density values we observe). The 95-GHz masers at region C have a close spatial association with the position of the south-eastern 6.7-GHz maser. 3.5-mm continuum emission is detected, situated between the two 6.7-GHz masers on the south-eastern edge of the infrared source.
3.1.27 G333.32+0.11
3.1.28 G333.47−0.16
The 6.7-GHz maser pointing target in this source is located within the southern half of an EGO (classified likely outflow candidate by Cyganowski et al.2008). Voronkov et al. (2014) note a curved distribution of class I emission at locations A, B, D, and F tracing a bow shock with the 6.7-GHz maser situated at the apex. The 95-GHz masers are consistent with the positions of the previously observed class I masers at A and B. However, at D one 95-GHz maser is located with the previously observed emission, and another is observed east of the 6.7-GHz maser at the edge of the EGO. No 95-GHz masers are observed at F, possibly due to the 44-GHz maser here being relatively weak compared to other locations in this source. 95-GHz masers are located at E and C also, making it appear that these masers trace the entire eastern edge of the EGO.
3.1.29 G333.56−0.02
A mistake in the observations of this source caused the pointing to be
∼18 arcsec north of the intended 6.7-GHz maser target. Therefore, all the class I emission is outside the FWHM of the 95-GHz primary beam to the south. All class I maser emission in this source is compactly clustered about this 6.7-GHz class II maser. One of the 95-GHz masers is offset to the north-east from the other class I emission.
3.1.30 G335.06−0.43
The class II maser is within the central region of an EGO (classified as a likely outflow candidate by Cyganowski et al. 2008). The 95-GHz masers at B and D closely trace the southern edge of the EGO. Voronkov et al. note that the class I emission at A appears to trace the northern edge of the EGO and the 95-GHz components at this location are consistent with this observation.
4 D I S C U S S I O N
Throughout our discussion we will directly compare the 36- and 44-GHz methanol maser properties presented by Voronkov et al. (2014) to the current 95-GHz data. However, before doing that, it is important to highlight the differences in sample selection be-tween the Voronkov et al. study and our investigation. Voronkov et al. selected almost all southern sources with previously detected class I maser emission from the single-dish searches of Slysh et al. (1994); Val’tts et al. (2000); Ellingsen (2005). The target sources for these original single-dish observations were highly varied, with a mix of known 6.7-GHz class II masers and HIIregions. Compar-atively, the targets for our investigation are based on the Ellingsen (2005) sample, which was more restrictive and consisted of all 6.7-GHz class II methanol masers with associated 95-GHz emission (a lower detection limit of∼4.5 Jy) within the Galactic longitude rangel=325◦−335◦,b= ±0.53◦. This means that our sam-ple is statistically comsam-plete with a different set of selection biases present than the Voronkov et al. sample. Due to all of our targets (except 333.07-0.45) being previously observed at high-resolution by Voronkov et al. (2014), we can compare all three of the observed class I transitions in our statistically complete maser target sample. Although we have 32 pointing targets total for our data, four of these pointings are associated with two class I sources (two point-ings each source), therefore, in general, we will refer to a set of 30 class I sources throughout the discussion, except in cases where we
are directly discussing relations between class I emission and the class II sources.
4.1 Diversity in class I methanol masers
In comparison to the complex spectra observed from class II methanol masers, class I emission appears to be considerably sim-pler. The spectra from multiple class I transitions observed from the same masing region often appear as single components with peak emission occurring at a common velocity. This contrasts with the typical spectrum of a class II region, with multiple bright com-ponents spread across a large velocity range. However, despite the similarities in appearance of the spectra of class I transitions, our investigation, combined with that of Voronkov et al. (2014), re-veals significant differences between the three considered transi-tions. Our high-resolution observations, when compared to the 36-and 44-GHz observations of Voronkov et al. (2014), reveal frequent differences between the physical associations of the 95-GHz maser components with other phenomenon in the star-formation regions. 95-GHz masers are observed tracing ordered structures, both inde-pendently or coinciding with other class I transitions. We observe a stronger preference towards co-location with the class II maser position in the 95-GHz masers compared with the 36- or 44-GHz components. This observation is particularly interesting due to the shared optimal conditions for masing between the 95- and 44-GHz components (McEwen, Pihlstr¨om & Sjouwerman2014; Leurini, Menten & Walmsley2016). In addition, we see significant offsets in LSR velocity between matched components from the twoA+ -type transitions (44-GHz blue-shifted compared to 95 GHz), which is not observed between the matched 95- and 36-GHz components. This diversity between transitions will be discussed further in the following sections.
4.2 General associations
I masers spatially associated with EGOs as defined by Cyganowski et al. (2008) and 24 out of 30 sources (80 per cent) have class I masers spatially associated with any 4.5-µm excess source. There-fore, we can conclude that in the majority of cases where both class I and class II methanol maser emission is observed, there is some component of class I maser emission is associated with a likely outflow candidate. Additionally, when comparing the asso-ciation rates between EGOs and the class I transitions, we see the 95-GHz maser components have an increased association rate with confirmed EGOs compared to the other two class I transitions com-bined (Cyganowski et al.2008; Voronkov et al.2014). A review of single dish surveys of class I maser sources identified that approx-imately 50 per cent of class I maser sources have emission (44 or 95-GHz) within an arcminute of an outflow source (EGO or oth-erwise) (Chen, Ellingsen & Shen2009), and subsequent searches for class I methanol masers targeted towards EGOs have achieved high detection rates (Chen et al.2011). Our association rate be-tween outflows and class I emission is significantly higher than this (80 per cent when considering any class I emission in our sources) and unlike the single-dish data, our high-resolution data allow us to directly confirm the presence of class I maser components within these outflow sources.
There are 57 reported EGOs within the Galactic longitude range of our statistically complete sample (Cyganowski et al.2008). 22 (∼39 per cent) of these EGOs have 6.7-GHz class II methanol maser associations and 14 (∼25 per cent) have class I methanol maser detections in one or more of the discussed class I transitions (Cyganowski et al.2008; Voronkov et al. 2014). Indicating that EGOs with associated 6.7-GHz methanol masers make good targets for observing class I methanol masers.
Twenty of the 6.7-GHz class II methanol masers that were ob-served here have associated 12.2-GHz class II methanol masers (Breen et al. 2012a,b). When considering our statistically com-plete sample 12 of 21 targets (∼57 per cent) are detected in the 12.2-GHz transition. Including all 6.7-GHz masers within the statistically complete sample, our targets were drawn from (all 6.7-GHz masers, regardless of presence of 95-GHz emission) we see an association rate between the two class II transitions (6.7 and 12.2 GHz) of 60 per cent. Comparing these two rates, we see that 6.7-GHz masers also displaying emission at 95-GHz do not appear to have a significantly different association rate with 12.2-GHz class II masers. Sources with emission present from 12.2-12.2-GHz class II methanol masers tend to be at a later evolutionary stage than those without (Breen et al.2010,2011). This indicates that 95-GHz class I emission does not appear to favour these more evolved sources.
4.3 Continuum association
In addition to the observations of 95-GHz maser emission, we also searched for 3.5-mm continuum in each of our targets. We detected 3.5-mm continuum emission in 14 of our 32 pointings, with two of these pointings corresponding to the one class I methanol maser source. Therefore, 3.5-mm continuum emission is observed in 13 of the 30 (∼43 per cent) class I methanol maser sources (typical 3σ upper limit is∼7 mJy for non-detections). 7 of our 30 class I sources have previously reported cm-wavelength continuum emis-sion (18-cm emisemis-sion for all except G328.24−0.55, which has a 3-cm continuum detection) and we detect 3.5-mm continuum in all but one (G333.47−0.16). Voronkov et al. (2014) report an as-sociation rate of∼24 per cent between their class I maser sources and cm-wavelength continuum emission. This is significantly lower
than the association rate we observe between the 95-GHz and mm-wavelength continuum sources. However, it should be noted that their rate was reported as a lower limit due to the inhomogeneous na-ture of their continuum data with respect to their sample of sources. It is likely that mm-wavelength continuum emission, such as the observed 3.5-mm emission results from thermal dust, in contrast to cm-wavelength continuum emission which is mostly free–free emission from HIIregions. This indicates that class I sources dis-playing mm- and not cm-wavelength continuum emission may be at an earlier evolutionary phase.
In all of these sources we observe 95-GHz masers closely co-located (to within a few arcseconds) with the continuum emission. Additionally, in all sources where continuum emission is observed, at least some component of it was observed within several arc-seconds of the class II pointing target. Considering both cm- and mm-wavelength continuum data for our sources, we obtain an asso-ciation rate between class II masers and radio continuum emission (∼47 per cent) consistent with those previously reported (Phillips et al.1998; Walsh et al.1998).
4.4 ATLASGAL association
The ATLASGAL survey mapped continuum emission from cold, dense dust and gas throughout the Galactic Plane. All class I methanol maser sources we have observed are within the bounds of the ATLASGAL survey. All of our class I maser regions are closely associated (within 30 arcsec of peak emission) with ATLASGAL sources with the 95-GHz maser spots appearing to be slightly off-set from the central peak of the dust emission, which is consistent with the class I masers being associated with gas outflows. We ob-serve a positive linear correlation between the dust mass of these ATLASGAL sources, and the luminosity of the associated 6.7-GHz class II masers with a correlation coefficient (r) of 0.85.
In the majority of sources that we observe strong 3.5-mm con-tinuum emission, we observe the location of the ATLASGAL point source coinciding with the position of this continuum emission. Additionally, we consider whether sources where 3.5-mm contin-uum emission or IR sources are associated with the class I maser emission affects the dust masses of the ATLASGAL sources. This was done by using the ANOVA statistical function to determine the significance of the various categorical variables (e.g. presence of EGO, 8-µm IR source, etc.) in predicting ATLASGAL dust mass. The ANOVA function is robust to the normality assump-tion of the continuous variable (ATLASGAL dust mass) allowing us to be reasonably confident in the output despite the skewed distribution of the dust masses. The presence of continuum emis-sion and 4.5-µm excess sources (whether EGO or other) do not correspond to distributions of ATLASGAL masses with statisti-cally different means. Conversely, association with 8-µm emission does result in a statistically significant difference in the mean, with sources displaying 8-µm emission generally displaying lower dust masses.
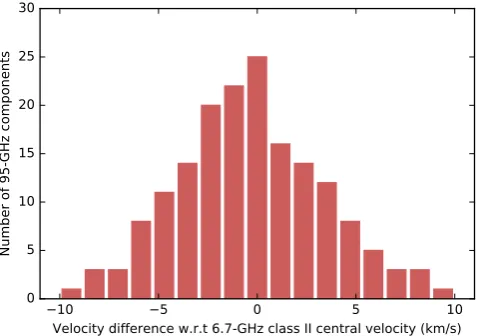
Figure 3. The histogram representing the distribution of velocity separa-tions between the 95-GHz class I masers and the central velocity range value of the 6.7-GHz class II target sources.
4.5 Velocity separation
Voronkov et al. (2014) compared relative velocities of the 36-/44-GHz class I methanol masers with the quiescent gas in the same region. Their results were consistent with the expected result that class I methanol masers have a closely related radial velocity to the systemic velocity. We follow up this analysis with a similar comparison using the detected 95-GHz masers. In the Voronkov et al. (2014) study, the velocity of the quiescent gas was approxi-mated by the central velocity value of 6.7-GHz class II methanol maser velocity range. As the pointing targets for our observations are 6.7-GHz class II masers, we will use this same convention in our analysis. Creating a histogram (Fig.3) of relative velocities, we see that the distribution can be reasonably approximated by a normal distribution with a mean of −0.33± 0.28 km s−1 and a standard deviation of 3.62±0.20 km s−1. Qualitatively the his-togram for the 95-GHz masers appears to have a minor blueshift asymmetry, similar to the 36- and 44-GHz transitions, however, this shift cannot be considered statistically significant in our data (tested with a one-sampleT-Test). The ratio of negative to positive relative velocities is 1.34; this is statistically significant from unity, however, it requires a simplification of the problem to a binomial distribution and is thus not a rigorous test. Follow-up observations at higher spectral resolution are required in order to conclude whether this is a real result. Unlike the 36- and 44-GHz transitions, we observed no components with extreme relative velocities, with all relative velocities falling within a range of approximately−10 to 10 km s−1. The 3σ range of our results is very similar to that ob-served from the other class I transitions presented by Voronkov et al. (2014). Due to the nature of our observing (covering a fixed range of−100 to 0 km s−1), some sources such as G 333.16–0.10, with velocities close to the edge of this range (∼−92 km s−1), will not be sensitive to high-velocity blue-shifted components. This same limitation is not an issue at the opposite end of our velocity range, as we do not observe any sources with systemic velocities higher than−37 km s−1.
4.6 Comparison with 36-/44-GHz class I masers
Voronkov et al. (2014) presented a detailed comparison between spatially associated 36- and 44-GHz methanol maser components.
Combining these data with our observations allows for an anal-ysis of the relationship between all three class I methanol maser transitions within our sample. In order to appropriately compare emission from each transition, we need to determine which maser components display emission in more than one transition. This was achieved by matching components between transitions that were co-associated both spatially and with respect to LSR velocity. 95-GHz components were matched with components from the other class I transitions if they are co-located within 1.5 arcsec and separated by 1 km s−1or less in LSR velocity. It is worth noting that while the Voronkov et al. observations of the two different class I transitions occurred quasi-simultaneously, our observations were made 3 yr prior. Therefore, any comparison between matched 95-GHz masers and 36-/44-GHz masers will have inherently more uncertainty than comparison between matched 36- and 44-GHz transitions as vari-ability within class I methanol maser sources is not currently well understood or studied. The 36-/44-GHz masers were grouped using the same method outlined by Voronkov et al., where components from the same transition that were co-located within 3σ (in fit un-certainty) of both position and velocity were considered a single component for the purpose of analysis. Across all 172 95-GHz components, we find matches with 36-GHz components in 51 cases (∼30 per cent) and matches with 44-GHz components in 85 (∼49 per cent). 97 out of the 172 (∼56 per cent) total components had a match in either of the other class I methanol maser transitions, with 39 components (∼22 per cent) displaying emission in all three transitions. Note that the LSR velocity of 36-GHz masers was ad-justed in accordance with the rest-frequency corrections described by Voronkov et al. (2014) (−0.215 km s−1) before being matched with the 95-GHz masers.
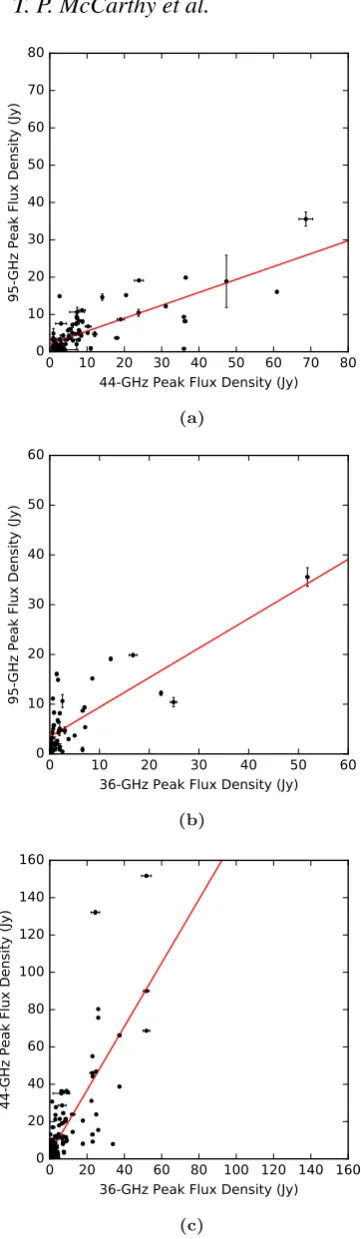
When considering 95-/44-GHz pairs, we find that 57 of 85 cases (∼67 per cent) have higher flux density in the 44-GHz transition (left-hand plot, Fig.5). In the 95-/36-GHz matched pairs, we find that the 95-GHz transition is brighter in 39 out of 51 (∼76 per cent) cases (right-hand plot, Fig.5). The relationship between the 95-and 44-GHz maser pairs is expected due to both of these transi-tions belonging to the same transition series (both are J0−(J-1)1A+ transitions with consecutive J numbers).
Flux density scatter plots were created between the matched com-ponents of each pair of transitions (Fig.6). Only 36- and 44-GHz maser components from within our source sample were consid-ered, therefore, the comparison between the paired 36- and 44-GHz masers here is a smaller sample size than that in Voronkov et al. (2014). A first-order polynomial line of best fit was determined for each of these plots. Considering the flux density scatter plot of 95-and 44-GHz matched components (plot (a) of Fig.6), the linear fit had a slope of 0.35±0.10 (and intercept value of 2.1±0.5) with a modest correlation coefficient (r) of 0.78. This relationship is similar to the 3:1 ratio between 44- and 95-GHz flux density reported by Val’tts et al. (2000). We find reasonable coefficients of correlation (r=0.78 for 95-/36-GHz and 95-/44-GHz andr=0.79 for 44-/36-GHz) in the linear fits of all three of our transition pairs. It is important to note that these comparisons were made using the flux density peak values for each transition. This introduces ve-locity resolutions effects when comparing our 95-GHz data to the 36- and 44-GHz values, as the velocity resolution of our observa-tions are approximately a factor of 8 coarser. The observed relation-ship between frequency of association and flux density is consistent with the expected relationships between these transitions (Cragg et al.1992; McEwen et al.2014; Leurini et al.2016).
Figure 4. Histograms of velocity offset between matched 95- and 36-GHz masers (red filled) and 95- and 44-GHz masers (blue outline).
components with respect to their matched 44-GHz components in 73 out of 85 (∼86 per cent) pairs with a mean red-shift of 0.385 km s−1 over all pairs (see Fig.4). The velocity separations between the 95-and 36-GHz matched pairs has a mean of 0.005 km s−1. The distri-bution of the velocity separation between both pairs of transitions is approximately Gaussian.
It is interesting to consider the number of regions where 95-GHz masers are detected which also contain emission from either, or both, of the other two class I transitions. To do this, we considered the original spatial association of maser components represented by the letter symbols in our images (originally defined in Voronkov et al.2014). In most cases these locations have a maximum spread of approximately 4 arcsec, which is close enough to assume co-location in the same general environment. In a few cases 95-GHz masers were seen to be offset from an alphabetized location; in these situations they were considered their own region. This re-sulted in 64 groupings of 95-GHz class I masers over the 30 class I sources. In 52 of the 64 (∼81 per cent) clusters of 95-GHz masers, both 36- and 44-GHz masers are also present. When considering cases where only 36- or 44-GHz are co-located with the 95-GHz masers, this reduces down to∼1.5 per cent (1 region) and∼14 per cent (9 regions), respectively, with the remaining two regions (∼3 per cent; regions in G 328.25–0.53 and G 329.07–0.31) only containing 95-GHz class I masers. Therefore, the vast majority of regions where 95-GHz masers are detected have 36- and 44-GHz
masers in relatively close proximity. Different environmental con-ditions favour different class I methanol transitions (Cragg et al. 1992; McEwen et al.2014; Leurini et al.2016). For the three transi-tions considered here, the 44-GHz and 95-GHz emission are related and share similar optimal masing conditions, whereas the 36-GHz emission prefers denser environments. All three transitions favour temperatures≥50 K, however, the optimal density range (of molec-ular hydrogen) for the twoA+type transitions is between 104and 106cm−3, compared with 105−107cm−3for the 36-GHz transition (McEwen et al.2014). Masers from the 36- and 44-GHz transitions can be observed co-spatially due to overlapping optimal conditions for masing (Voronkov et al.2010,2014; Pihlstr¨om, Sjouwerman & Fish2011; McEwen, Pihlstr¨om & Sjouwerman2014). Therefore, as the 95-GHz masers have similar optimal conditions as the 44-GHz transition, this explains why we tend to observe spatial associations between all three transitions in regions where 95-GHz components are located (which are in general optimal for 44-/95-GHz masing, allowing 95-GHz to be observable).
4.7 YSO range of influence
Due to the nature of their pumping mechanism, 6.7-GHz class II methanol masers are located close to high-mass YSOs. This allows the positions of these class II masers to be used as an accurate in-dicator of the location of a YSO. As all of our target sources were 6.7-GHz class II masers, we can determine linear offsets between all our detected maser components and nearby YSOs. Kinematic dis-tance estimates to each source were taken from Green & McClure-Griffiths (2011) or computed using similar methodology (see Ta-ble1). Similar analysis for the 36- and 44-GHz class I emission was conducted by Voronkov et al. (2014) and concluded that 1 pc is a good estimate of the range of influence of YSOs in producing class I methanol masers. In the case of our 95-GHz observations, we have a much smaller primary beam which does not allow us to accurately determine whether the 1 pc estimate applies to the 95-GHz masers we observed. Instead, with our data we considered a range out to 0.46 pc, this range was determined from the mean linear radius of the primary beam over all of our sources. Consider-ing only the subset of 95-GHz components within this range limit allows for a sample with reduced bias towards detections close to the pointing centre. This reduced sample can be compared against the 36- and 44-GHz maser components, which satisfy the same cri-teria, in order to investigate any positional preference of 95-GHz masers towards YSOs relative to the 36- and 44-GHz masers.
[image:15.595.81.515.550.695.2]Figure 6. Scatter plots of peak flux density between matched class I components, 95- and 44-GHz (a), 95- and 36-GHz (b) and 44- and 36-GHz (c). Line in each plot is a first-order polynomial best fit:
y=(0.35±0.10)x−(2.1±0.5) (a),y=(0.59±0.17)x−(3.4±0.7) (b),
[image:16.595.307.545.54.222.2]y=(1.70±0.49)x−(2.8±1.3) (c).
Figure 7. The normalized histogram of class I components linear separation from the 6.7-GHz (indicative of the position of the YSO). This is the reduced sample, of only components within 0.46 pc of the excitation source (see Section 4.7). The histogram for each frequency has been normalized so that they-axis is the value of the probability density function for each bin, ensuring across the entire sampled range this integrates to 1. This allows comparison between the three samples of class I masers, despite sample sizes not being equal.
Five of our 32 target sources were excluded from this analy-sis: one due to a missed pointing (G 333.56−0.02) and another four due to multiple close 6.7-GHz class II masers present in the field (G 332.30−0.09, G 333.13-0.44, G 333.13−0.56, and G 333.23−0.06). Sources with multiple 6.7-GHz masers are ex-cluded as we are unable to determine which class II source the class I masers are associated with. In the remaining 27 sources, we deter-mined linear offsets for 138 components, with 127 of these falling within the range of 0.46 pc from a YSO. Within this subset of 127 components, we observe 81 (∼59 per cent) with projected distances less than 0.1 pc and 107 (∼78 per cent) less than 0.2 pc. Therefore, we observe more than an∼68 per cent drop in the number of com-ponents when comparing those from between 0.1 and 0.2 pc and those within 0.1 pc of the YSO. Considering a 2-dimensional den-sity determined as the number of components per projected area, the density of the region between 0.1 and 0.2 pc from the YSO is∼89 per cent lower than that of the inner region. When considering com-ponents from all three class I transitions within this same 0.46 pc range, we must exclude three additional sources (G 329.03−0.20, G 329.03−0.19, and G 333.12−0.43) as these have multiple 6.7-GHz class II masers within the FWHM of the 36- and 44-GHz primary beam. In this reduced sample, we observe∼65 per cent of 95-GHz class I masers within 0.1 pc of the YSO, compared to the∼37 and∼39 per cent observed for the 36- and 44-GHz transitions, respectively (see Fig.7). Despite considering a reduced sample to alleviate bias towards 95-GHz maser components nearby to YSOs, this sample is only appropriate for comparing between the three transitions and are not indicative of the true distribution of 95-GHz maser emission in these sources. In order to accurately determine the distribution of 95-GHz maser spots with respect to the YSO, multiple pointings of each source would need to be made or an instrument with a much larger primary beam utilized.