ESTIMATION OF ESOMEPRAZOLE AND LEVOSULPIRIDE BY USING RP-HPLC IN ITS BULK AND PHARMACEUTICAL DOSAGE FORM
A Dissertation submitted to
THE TAMIL NADU DR. M.G.R. MEDICAL UNIVERSITY, CHENNAI- 600 032
In partial fulfilment of the award of the degree of
MASTER OF PHARMACY IN
Branch V – PHARMACEUTICAL ANALYSIS
Submitted by
Name : K. SENTHILNATHAN Reg. No. 261630206
Under the guidance of
Dr. V. SEKAR, M.Pharm., PhD, Professor and Head
DEPARTMENT OF PHARMACEUTICAL ANALYSIS
J.K.K. NATTRAJA COLLEGE OF PHARMACY, KOMARAPALAYAM-638183,
CHARPTER No.
TITLE PAGE No.
1 INTRODUCTION 1 - 45
2 DRUG PROFILE 46 – 51
3 LITERATURE REVIEW 52 – 58
4 OBJECTIVE AND PLAN OF STUDY 59
5 MATERIALS AND METHODS 60 – 66
6 RESULTS AND DISCUSSION 67 – 80
7 SUMMARY AND CONCLUSION 81
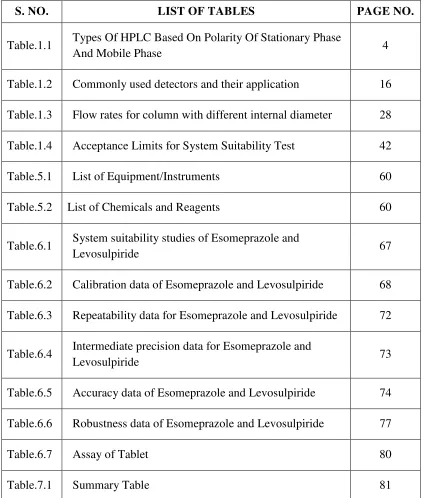
S. NO. LIST OF TABLES PAGE NO.
Table.1.1 Types Of HPLC Based On Polarity Of Stationary Phase
And Mobile Phase 4
Table.1.2 Commonly used detectors and their application 16
Table.1.3 Flow rates for column with different internal diameter 28
Table.1.4 Acceptance Limits for System Suitability Test 42
Table.5.1 List of Equipment/Instruments 60
Table.5.2 List of Chemicals and Reagents 60
Table.6.1 System suitability studies of Esomeprazole and
Levosulpiride 67
Table.6.2 Calibration data of Esomeprazole and Levosulpiride 68
Table.6.3 Repeatability data for Esomeprazole and Levosulpiride 72
Table.6.4 Intermediate precision data for Esomeprazole and
Levosulpiride 73
Table.6.5 Accuracy data of Esomeprazole and Levosulpiride 74
Table.6.6 Robustness data of Esomeprazole and Levosulpiride 77
Table.6.7 Assay of Tablet 80
S.NO LIST OF TABLES PAGE NO Fig. 1.1 Schematic diagram of instrumentation of HPLC 10
Fig. 1.2 Flow Path of a Manual Injector 12
Fig. 1.3 HPLC Column 13
Fig. 1.4 Outline of the process involved in method development 26
Fig. 1.5 Pictorial Representation of number of theoretical plates 31
Fig. 1.6 Pictorial representation of capacity factor 32
Fig. 1.7 Pictorial Representation of Resolution. 32
Fig. 1.8 Pictorial representation of selectivity factor 33
Fig. 1.9 Pictorial representation of peak asymmetry 34
Fig. 2.1 Structure of Esomeprazole 46
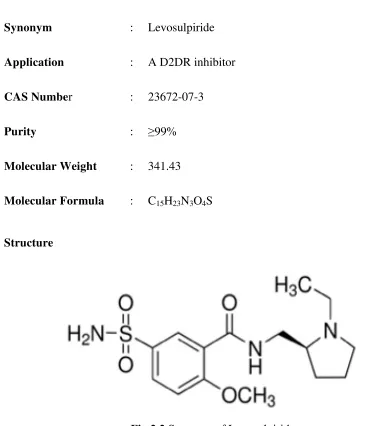
Fig. 2.2 Structure of Levosulpiride 49
Fig. 5.1 Trial chromatogram 1 64
Fig. 5.2 Trial chromatogram 2 64
Fig. 5.3 Trial chromatogram 3 65
Fig. 5.4 Optimized Chromatogram of Esomeprazole and Levosulpiride
66
Fig. 6.1 Chromatogram of blank. 67
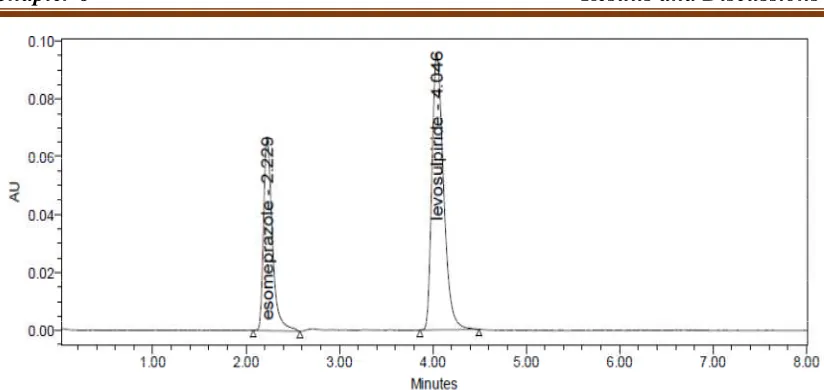
Fig. 6.2 Typical Chromatogram of Esomeprazole and Levosulpiride
68
Fig. 6.3 Calibration curve of Esomeprazole 69
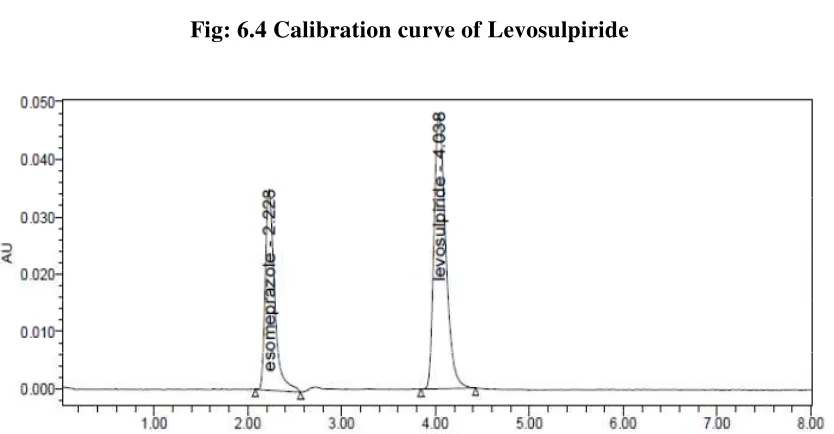
Fig. 6.4 Calibration curve of Levosulpiride 69
Fig. 6.5 Linearity 25% Chromatogram of Esomeprazole and Levosulpiride
69
Fig. 6.6 Linearity 50% Chromatogram of Esomeprazole and Levosulpiride
70
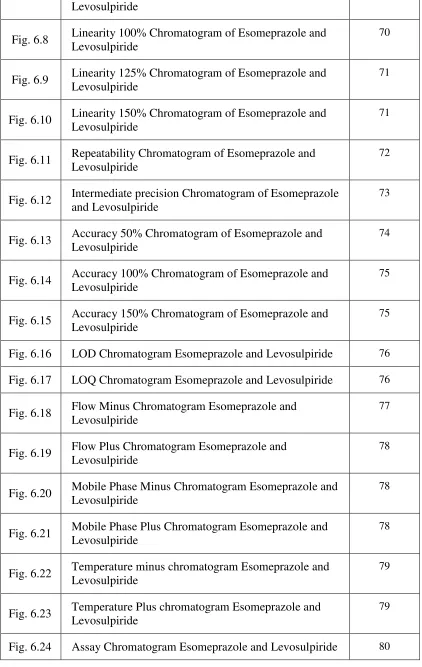
Fig. 6.8 Linearity 100% Chromatogram of Esomeprazole and Levosulpiride
70
Fig. 6.9 Linearity 125% Chromatogram of Esomeprazole and Levosulpiride
71
Fig. 6.10 Linearity 150% Chromatogram of Esomeprazole and Levosulpiride
71
Fig. 6.11 Repeatability Chromatogram of Esomeprazole and Levosulpiride
72
Fig. 6.12 Intermediate precision Chromatogram of Esomeprazole and Levosulpiride
73
Fig. 6.13 Accuracy 50% Chromatogram of Esomeprazole and Levosulpiride
74
Fig. 6.14 Accuracy 100% Chromatogram of Esomeprazole and Levosulpiride
75
Fig. 6.15 Accuracy 150% Chromatogram of Esomeprazole and Levosulpiride
75
Fig. 6.16 LOD Chromatogram Esomeprazole and Levosulpiride 76
Fig. 6.17 LOQ Chromatogram Esomeprazole and Levosulpiride 76
Fig. 6.18 Flow Minus Chromatogram Esomeprazole and Levosulpiride
77
Fig. 6.19 Flow Plus Chromatogram Esomeprazole and Levosulpiride
78
Fig. 6.20 Mobile Phase Minus Chromatogram Esomeprazole and Levosulpiride
78
Fig. 6.21 Mobile Phase Plus Chromatogram Esomeprazole and Levosulpiride
78
Fig. 6.22 Temperature minus chromatogram Esomeprazole and Levosulpiride
79
Fig. 6.23 Temperature Plus chromatogram Esomeprazole and Levosulpiride
79
% : Percentage
%RSD : Percentage Relative Standard Deviation
λ : Lambda
α : Selectivity factor
°C : Degree Celsius
µ : Minute
µg/ml : Microgram per Millilitre
µl : Micro litre
A.R : Analytical Reagent
API′S : Active Pharmaceutical ingredients
As : Peak Asymmetry
AUC : Area under curve
B.P : British Pharmacopeia
CAS : Chemical Abstract service
CFR : Code Federal regulations
cm : centi meter
DMSO : Dimethyl sulfoxide
EC50 : Half maximal effective concentration
ELSD : Evaporate light scattering detector
GERD : Gastroesophageal reflux disease
Gms : Grams
I.D : Internal diameter
IC50 : Half maximal inhibitory concentration
ICH : International conference on Harmonization
IP : Indian pharmacopeia
IUPAC : International union of pure and applied chemistry
K′ : Capacity factor
LOD : Limit of Detection
LOQ : Limit of Quantification
mg/tab : Milligram per tablet
ml/min : Millilitre/Minute
mM : Milli Mole
MS : mass spectroscopy
N : column effecient
nm : Nanometre
NSAIDs : Non steroidal anti- inflammatory drugs
ODS : Octadecyl Silica (C18 Column)
OPA : Ortho Phosphoric Acid
PDA : photo diode array
pH : Negative Logarithm of Hydrogen Ion
PhoP : Transcriptional regulatory protein
Psi : pounds for square inch
RI : Refractive index
RP-HPLC : Reverse Phase-High Performance Liquid Chromatography
Rpm : Rotations per Minute
Rs : Resolution
RSD : Relative Standard Deviation
Rt or tR : Retention time
S.D : Standard Deviation
S.E : Standard Error
USP : United States Pharmacopoeia
UV-VIS : Ultraviolet –Visible
A simple, Accurate, precise method was developed for the simultaneous
estimation of the esomeprazole and levosulpiride in Tablet dosage form.
Chromatogram was run through ODS (150mm 4.6mm, 5µ). Mobile phase containing
Buffer and Acetonitrie in the ratio of 32;68A was pumped through column at a flow
rate of 1ml/min. Buffer used in this method was 0.01N KH2PO4 pH 5.4 buffer.
Temperature was maintained at 30°C. Optimized wavelength for Esomeprazole and
Levosulpiride was 290nm. Retention time of Esomeprazole and Levosulpiride were
found to be 2.2min and 4.0min. %RSD of the Esomeprazole and Levosulpiride were
and found to be 0.97 and 0.50 respectively. %Recover was Obtained as 100.08% and
101.16% for Esomeprazole and Levosulpiride respectively. LOD, LOQ values are
obtained from regression equations of Esomeprazole and Levosulpiride were
0.10ppm, 0.34ppm and 1.04ppm, 0.29ppm respectively. Regression equation of
Esomeprazole is y = 10568.x + 307.3, and of Levosulpiride is y = 11649.x + 1207.
1. INTRODUCTION
A drug includes all medicines intended for internal or external use for or in the
diagnosis, treatment, mitigation or prevention of disease or disorder in human beings
or animals, and manufactured exclusively in accordance with the formulae mentioned
in authoritative books.(1)
Pharmaceutical analysis is a branch of chemistry involving a process of
identification, determination, quantification, purification and separation of
components in a mixture or determination of chemical structure of compounds. There
are two main types of analysis – Qualitative and Quantitative analysis.
Qualitative analysis is performed to establish composition of a substance. It is
done to determine the presence of a compound or substance in a given sample or not.
The various qualitative tests are detection of evolved gas, limit tests, color change
reactions, determination of melting point and boiling point, mass spectroscopy,
determination of nuclear half life etc.
Quantitative analysis techniques are mainly used to determine the amount or
concentration of analyte in a sample and expressed as a numerical value in
appropriate units. These techniques are based on suitable chemical reaction and either
measuring the amount of reagent added to complete the reaction or measuring the
amount of reaction product obtained the characteristic movement of a substance
through a defined medium under controlled conditions, electrical measurement or
1.1 High Performance Liquid Chromatography
Chromatography is the method of separation that finds applications in all
branches of science. It was first invented by Russian Botanist Mikhail Twsett. This
technique was used to separate various plant pigments like chlorophylls and
xanthophylls by passing solutions of these compounds through a glass column packed
with finely divided calcium carbonate. The separated species appear as colored bands
on the column hence the name of the process (Greek chroma meaning “color” and
graphing meaning “writing”)(3)
Chromatography is defined as a non- destructive procedure for resolving
multi-component mixture of trace, minor, or major constituents into its individual
fractions. In chromatography, the sample is dissolved in the mobile phase which may
be a gas, liquid, or a supercritical fluid. The principle involved in HPLC is that when
a mixture containing different compounds is introduced into the mobile phase and
allowed to flow over a stationary phase, the individual compounds travel at different
speeds and get separated based on the relative affinities to the stationary phase and
the mobile phase. The compounds are separated based on the polarity of the
stationary phase and the mobile phase.
Chromatography is of various types based on the physical state of the
stationary and the mobile phase:
1. Solid - Liquid type: The stationary phase is a solid and the mobile phase is a liquid. Ex: Thin layer chromatography, High performance liquid chromatography (HPLC).
3. Liquid - Gas Type: The stationary phase is a liquid and the mobile phase is a gas. Ex: Gas chromatography.
High Performance Liquid Chromatography is the most widely used of all the
analytical separation techniques. The reasons for its popularity are its sensitivity,
ready adaptability to quantitative determination, suitability for non- volatile and
thermally fragile species, wide applicability to variety of substances such as amino
acids, carbohydrates, nucleic acids, proteins, hydrocarbons, terpenoids, pesticides,
steroids, metal-organic species and inorganic species. As high pressures (around 3000
psi) are used for the separation of the analytes down the column, it is often termed as
High Pressure Liquid Chromatography.(4
1.2Types Of HPLC (5)
HPLC is classified into various types
a) Based on polarity of stationary and mobile phase
• Normal Phase Chromatography
• Reverse Phase Chromatography
b) Based on the principle of separation
• Adsorption Chromatography
• Partition Chromatography
• Ion Pair Chromatography
• Size Exclusion Chromatography
C) Based on elution technique
• Isocratic Elution
• Gradient Elution
D) Based on scale of operation
• Analytical HPLC
• Preparative HPLC
a)Based on the polarity of the stationary phase and the mobile phase, it is of two types:
Normal Phase (NP) HPLC
In this type, the stationary phase is polar and the mobile phase is non-polar,
polar compounds are retained for a longer periods because of more affinity towards
the stationary phase, hence non-polar compounds travel faster and are eluted first.
Reverse Phase (RP) HPLC
In this type, the stationary phase is non-polar and the mobile phase is polar,
non-polar compounds are retained for longer periods as they have more affinity towards
the stationary phase. Hence, polar compounds travel faster and are eluted first.
Table 1.1 Types of HPLC Based on Polarity of Stationary Phase and Mobile Phase.
b) Based on the principle of separation, chromatography is divided into various types,
Types Normal Phase Reverse Phase
Stationary phase Polar Non polar
Mobile phase Non polar Polar
Compound eluted first Non polar Polar
Adsorption chromatography
It is one of the oldest types of chromatography. The principle involved is
adsorption. Adsorption is a surface phenomenon in which the separation mechanism
depends on the difference in the polarity of various drug molecules. The more polar a
molecule, the more strongly it will be adsorbed by a polar stationary phase. Similarly
the more non-polar a molecule, the more strongly it will be adsorbed by a non-polar
stationary phase.(6)
During a surface adsorption chromatography process, a competition for
stationary phase adsorption sites exists between the materials to be separated and the
mobile phase. In a mixture, molecules of low polarity spend proportionally more time
in the mobile phase than those molecules that are highly polar, which are retained for
a longer period of time. Therefore the components of a mixture are eluted in order of
increasing polarity. (7)
Partition Chromatography
The principle involved is partition in which the solute molecules distribute
themselves between the mobile and the stationary phases. In partition
chromatography the stationary phase is a non-volatile liquid which is held as a thin
layer (or film) on the surface of an inert solid. The mixture to be separated is carried
by a gas or a liquid as the mobile phase. With the use of liquid as mobile phases, there
is a tendency for the stationary liquid phase to be removed or dissolved. Therefore,
the stationary liquid phase has to be chemically bonded to the solid bonding support
such as silica gel, cellulose powder, or kieselguhr (hydrated silica). The solute
molecules in the mobile phase move through the system at rates determined by their
Ion Exchange Chromatography
Ion Exchange Chromatography is based on the reversible interaction between
a charged protein and an oppositely charged chromatography medium. Biomolecules
such as proteins, peptides, nucleic acids with even small differences in net surface
charge can be separated, and very high resolution is obtained by choosing the optimal
ion exchange and separation conditions. The net surface charge of a protein varies
according to the surrounding pH. Typically, when the pH is above its isoelectric
point, a protein will bind to a positively charged anion exchanger. Below its
isoelectric point, a protein will bind to a negatively charged cat ion exchangers.(9)
Anion and cation exchangers are classified as strong or weak, depending on
how much the ionization state of the functional groups vary with pH. A strong ion
exchange has the same charge density on its surface over a broad pH range, whereas
the charge density of a weak ion exchanger changes with pH. The selectivity and the
capacity of weak ion exchangers are different at different pH values.(10)
Size Exclusion Chromatography
This process is also known as Gel Permeation Chromatography. In this
method the mixture of compounds with various molecular sizes are separated
according to size or molecular weight. The stationary phase consists of a porous
cross-linked polymeric gel. The pores of the gel normally small and exclude the
larger solute molecules, but allows smaller molecules to enter the gel, causing them to
flow through a larger volume. This causes the larger molecules to pass through the
column at a faster rate than the smaller ones. The components of a mixture therefore
Size Exclusion Chromatography is used extensively in the biochemical
industry to remove small molecules and inorganic salts from valuable higher
molecular weight products such as peptides, proteins and enzymes.
Chiral Phase Chromatography
In this type of chromatography, optical isomers are separated using chiral
stationary phases. Two approaches for chiral separation are available, indirect, which
utilizes derivatizing agents, and direct, which uses chiral stationary phases or chiral
mobile phase additives. In the indirect method, a racemic mixture is made to react
with a chiral reagent to form a pair of diastereomers and then chromatographed using
a chiral column. Because diastereomers possess different physiochemical properties,
they can be separated in a chiral environment.
Direct separation of enantiomers on and a chiral column using a chiral mobile
phase additive is applied only in HPLC. In this method, enantiomeric separation is
accomplished by the formation of a pair of transient diastereomeric complexes
between racemic analyte and the chiral mobile phase additive. Chiral discrimination
is due to differences in the stabilities of the diastereomeric complexes, salvation in the
mobile phase, and/or binding of the complexes to the solid support.(12)
c) Based on elution technique, chromatographic methods are of two types,
Isocratic Elution
In this technique, the composition of the mobile phase is maintained as constant
throughout the process of separation. All the compounds in the sample are eluted in a
reasonable amount of time, by changing the ratio of polar to non-polar compounds in
Gradient Elution
A steady change of the mobile phase composition during the chromatographic
run is called gradient elution. This is widely used technique when a sample contains
components of a wide range of polarities. For a reverse phase gradient, the solvent
starts out relatively polar and slowly becomes more non-polar. The gradient elution
offers the most complete separation of the peaks, without taking much time. A sample
containing compounds of a wide range of polarities can be separated by a gradient
elution in a shorter time period without a loss of resolution in the earlier peaks or
excessive broadening of later peaks.(13)
Gradient elution also increases quasi-efficiency of the column. In the isocratic
elution, the longer a component is retained, the wider its peak. In gradient elution, the
tail of the peak is always under the influence of the stronger mobile phase when
compared to the peak front. Thus, molecules on the tail of the chromatographic peak
will move faster. This will tend to compress zone and narrow the resultant peak. (14)
d)Based on the scale of operation, chromatography is of two types,
Analytical HPLC
In Analytical HPLC, quantitative and qualitative determination of a compound
is done. It is the most widely used technique. In this method, the sample amount
applied to the column is typically in the µg range or lower quantities. The mass ratio
of compound to the stationary phase on the column is less than 1: 100000. Under
these conditions good separations with sharp and symmetrical peaks are achieved.
Preparative HPLC
In Preparative HPLC, isolation and purification of a product is done. It is an
expensive technique, when compared to the traditional purification techniques like
distillation, crystallization or extraction.
Preparative HPLC is used for the isolation and purification of valuable
products in the chemical and pharmaceutical industry as well as in biotechnology and
biochemistry. It starts in the µg range for isolation of enzymes in biotechnology
(micro purification). For identification and structure elucidation of unknown
compounds in synthesis or natural product chemistry it is necessary to obtain pure
compounds in amounts ranging from one to a few milligrams. Larger amounts, in
gram quantity, are necessary for standards, reference compounds and compounds for
toxicological and pharmacological testing. Industrial scale or production scale
preparative HPLC, that is, kg quantities of compound, is often done nowadays for
valuable pharmaceutical products.
1.3 Instrumentation of HPLC
The main components of HPLC are as given below and are schematicall
represented in Fig 1.1
1. Solvent Reservoir
2. Solvent Delivery System (Pump)
3. Injection Port/ Auto sampler
4. Column
5. Detector
Fig. 1.1 Schematic diagram of instrumentation of HPLC
1.3.1 Solvent Reservoir
Solvent Reservoirs are used to store mobile phase. Scott Duran bottles are
commonly used as solvent reservoirs. The
material such as glass and must be smooth so as to avoid growth of microorganisms
on its walls. It may be transparent or can be amber colored. A graduated bottle gives a
rough estimate of mobile
above HPLC system (at higher level) in a tray. They should never be kept directly
above the system as any spillage of solvent on the system may damage electronic
parts of HPLC.
1.3.2 Solvent Delivery System (Pump)
Pumps are an important component of the HPLC system. It delivers a constant
flow of mobile phase such that the separation of components of mixture takes place in
a reasonable time. There are different types of pumps:
Schematic diagram of instrumentation of HPLC
Solvent Reservoir
Solvent Reservoirs are used to store mobile phase. Scott Duran bottles are
commonly used as solvent reservoirs. The solvent reservoir must be made of inert
material such as glass and must be smooth so as to avoid growth of microorganisms
on its walls. It may be transparent or can be amber colored. A graduated bottle gives a
rough estimate of mobile-phase volume in the bottle. Solvent reservoirs are placed
above HPLC system (at higher level) in a tray. They should never be kept directly
above the system as any spillage of solvent on the system may damage electronic
Solvent Delivery System (Pump)
an important component of the HPLC system. It delivers a constant
flow of mobile phase such that the separation of components of mixture takes place in
a reasonable time. There are different types of pumps:
Schematic diagram of instrumentation of HPLC (16)
Solvent Reservoirs are used to store mobile phase. Scott Duran bottles are
solvent reservoir must be made of inert
material such as glass and must be smooth so as to avoid growth of microorganisms
on its walls. It may be transparent or can be amber colored. A graduated bottle gives a
ottle. Solvent reservoirs are placed
above HPLC system (at higher level) in a tray. They should never be kept directly
above the system as any spillage of solvent on the system may damage electronic
an important component of the HPLC system. It delivers a constant
a) Reciprocating Pumps
b) Displacement Pumps
c) Pneumatic Pumps
In reciprocating pumps, a motor driven reciprocating piston controls the flow
of mobile phase with the help of two ball check valves that opens and closes with the
piston movement. The flow is thus not continuous and as damping of flow is
necessary, it is accomplished using pulse dampers which are a long coiled capillary
tube. Reciprocating pumps are most widely used in HPLC systems.
Displacement pumps, also known as syringe pump is composed of a one
directional motor driven plunger that pushes the mobile phase present in a syringe
like chamber. The volume of displacement pumps is limited. A constant flow rate is
usually obtained with syringe like pumps.
Pneumatic pumps are the simplest where the mobile phase is pushed out of
the mobile phase container by the pressure of a pressurized gas. The flow is
dependent on the back pressure of the column and usually the flow is limited to
pressures below 2000 psi.(17)
1.3.3 Injection Port or Auto sampler (18)
The Sample Injector enables small liquid samples to be injected into the
HPLC system without the sample passing through the pump. The function of the
injector is to place an accurate volume of the sample into the high-pressure flow of
the mobile phase so that the sample enters the column as a homogeneous, low-volume
plug. It is of two types; manual injector or an auto injector. Injection is done through
1.2. The sample is introduced at atmospheric pressure by a syringe into a constant
volume loop. In the LOAD position the loop is not in the path of the mobile phase.
By rotating to the INJECT position the sample in the loop i
phase stream into the column. It is important to allow some sample to flow into waste
from loop so as to ensure there are no air bubbles in the loop and
sample is completely washed out to prevent previous sample effect
loading can be varied by part filling of the loop or by changing the loop volume.
Automatic injection improves laboratory productivity and eliminates personal
errors. Present day advanced HPLC systems are equipped with an auto injector along
with an auto sampler. The software programs help filling of the loop and delivery of
the sample to the column. The computer controls the sequence of samples for
injection from vials kept in numbered positions of the auto sampler. It is important to
adopt precautions to ensure consistency of results.
Fig. 1.2
1.3.4 HPLC Column
The HPLC column is referred to as the heart of the process. The stationary
phase of the column is used in separating the individual fractions of a sample mixture . The sample is introduced at atmospheric pressure by a syringe into a constant
volume loop. In the LOAD position the loop is not in the path of the mobile phase.
By rotating to the INJECT position the sample in the loop is moved by the mobile
phase stream into the column. It is important to allow some sample to flow into waste
from loop so as to ensure there are no air bubbles in the loop and
sample is completely washed out to prevent previous sample effect
loading can be varied by part filling of the loop or by changing the loop volume.
Automatic injection improves laboratory productivity and eliminates personal
errors. Present day advanced HPLC systems are equipped with an auto injector along
with an auto sampler. The software programs help filling of the loop and delivery of
to the column. The computer controls the sequence of samples for
injection from vials kept in numbered positions of the auto sampler. It is important to
adopt precautions to ensure consistency of results. (19)
Fig. 1.2 Flow Path of a Manual Injector.(20)
HPLC Column
The HPLC column is referred to as the heart of the process. The stationary
phase of the column is used in separating the individual fractions of a sample mixture . The sample is introduced at atmospheric pressure by a syringe into a constant
volume loop. In the LOAD position the loop is not in the path of the mobile phase.
s moved by the mobile
phase stream into the column. It is important to allow some sample to flow into waste
from loop so as to ensure there are no air bubbles in the loop and previously used
sample is completely washed out to prevent previous sample effects. The sample
loading can be varied by part filling of the loop or by changing the loop volume.
Automatic injection improves laboratory productivity and eliminates personal
errors. Present day advanced HPLC systems are equipped with an auto injector along
with an auto sampler. The software programs help filling of the loop and delivery of
to the column. The computer controls the sequence of samples for
injection from vials kept in numbered positions of the auto sampler. It is important to
The HPLC column is referred to as the heart of the process. The stationary
by using various physical and chemical parameters. Columns for analytical HPLC are
of various sizes ranging from 10 - 25 mm in length and 2.6 – 4.6 mm internal
diameter (i.d). Columns for preparative HPLC are in size range of 50 – 250 mm long
and i.d greater than 4.6 mm. The columns are generally constructed of stainless steel
SS-316 grade to cope with high back pressure (caused by the small particles of the
stationary phase) and are glass lined to prevent metal catalysis of solvent- solute
reactions at high column pressures (due to force of pumping of the mobile phase
through the columns). Columns made of glass are used for the separation of
Biomolecules and columns made of PEEK polymer are biocompatible and chemically
inert to most solvents. (21)
Fig No. 1.3 HPLC Column
Stationary phase
Separation of pharmaceuticals is usually achieved by partition of compounds
in the test solution between the mobile and the stationary phases. HPLC systems
consisting of polar stationary phases and non-polar mobile phases are described as
normal-phase chromatography; those with non-polar stationary phases and polar
There are many types of stationary phases used in HPLC including:
- Unmodified silica, alumina, or porous graphite, used in normal-phase
chromatography, where separation is based on differences in adsorption;
- A variety of chemically modified supports prepared from polymers, silica, or porous
graphite, used in reverse-phase HPLC, where separation is based principally on
partition of the molecules between the mobile phase and the stationary phase;
- Resins or polymers with acid or basic groups, used in ion-exchange
chromatography, where separation is based on competition between the ions to be
separated and those in the mobile phase;
- Porous silica or polymers, used in size-exclusion chromatography, where separation
is based on the relative molecular mass of the molecules.
Most separations are based on partition mechanisms using chemically
modified silica as the stationary phase and polar solvents as the mobile phase
(reverse-phase HPLC). The surface of the support, e.g. the silanol groups of silica, is
reacted with various silane reagents to produce covalently bonded silyl derivatives
covering a varying number of active sites on the surface of the support. The nature of
the bonded phase is an important parameter for determining the separation properties
of the chromatographic system.
For the separation of enantiomers, special chemically modified stationary
phases (chiral chromatography) are available, e.g. cyclodextrins, albumins, etc.
Generally, silica-based reverse-phase columns are generally considered to be
manufacturer's instructions should be consulted before using the column. Columns
containing particles of polymeric materials such as styrene divinyl benzene
copolymer are stable over a wider pH range.
For analytical separations the particle size of the most commonly used
stationary phases varies between 3 µm and 10 µm. The particles may be spherical or
irregular, of different porosities and specific surface area. In the case of
reversed-phase, the extent of bonding of the stationary phase is expressed as the
carbon-loading. Furthermore, stationary phases may be "end-capped", i.e. the number of
residual silanol groups is reduced by methylation. These parameters contribute to the
chromatographic behavior of a particular stationary phase. Tailing of peaks,
particularly for basic substances, can occur when residual silanol groups are present.
1.3.5 Detector (22)
A detector in the HPLC system measures the compounds after their separation
from the column. The detector selected should be capable of responding to changes in
the concentration of all the components in the sample with adequate sensitivity even
to measure trace amounts. Basically there are two types of detectors: bulk property
and solute property detectors. The bulk property detectors, function on some bulk
property of the eluent such as refractive index (RI) and is not suitable for gradient
elution and are usually less sensitive than solute property detectors. Solute property
detectors perform by measuring a physical or chemical property that is specific to the
solute. Detectors should have high linear dynamic range and should give faster
Table 1.2 Commonly used detectors and their application. (23)
Detector detected Analyte requirements Solvent Uses
UV-Visible Any compounds with chromophore Non UV absorbing solvents
Wavelength at which maximum absorption occurs can be selected. Has a high degree of selectivity and
is useful for many applications.
Photo diode array (PDA) detector Any compound with chromophore Non UV absorbing solvents
Detects an entire spectrum simultaneously. Useful for analysis
of related substances and impurities.
Fluorescence Fluorescent compounds
Non UV absorbing
solvents
Highly selective and sensitive. Wavelength at which fluorescence
occurs is selected. Often used to analyze derivatized samples after treatment with DANSYL chloride
to form fluorescent compounds.
Refractive index (RI)
Compound with a different RI to
that of the mobile phase
Cannot run mobile phase
gradients
Virtually it is a universal detector but has limited sensitivity. Used for
the detection of sugars.
Conduct-ivity Charged or polar compounds Mobile phase must be conducting
Excellent detector for ion exchange methods. Electro-chemical Readily oxidized or reduced compounds Mobile phase must be conducting
Very sensitive and selective. Used for detection of Biological
compounds. Evaporative light scattering detector (ELSD) All compounds are detected virtually Volatile solvents and volatile buffers
must be used.
Universal detector, Highly sensitive but not selective. But can be use for
gradient analysis. Used for the detection of lipids, sugar and high
molecular weight analytes.
Optical rotation detector Optically active compounds Mobile phase should be an
asymmetric environment
1.3.6 Data Collection devices
Signals from the detector may be collected on chart recorders or electronic
integrators that vary in complexity and in their ability to process, store and reprocess
chromatographic data. The data storage capacity of these devices is usually limited.
Modern data stations are computer based and have a large storage capacity to
collect process and store data for possible subsequent reprocessing. Analytical reports
can often be customized to the needs of the analyst.
Integration of peak areas and the setting of threshold levels are not normally
problematic in an assay since the peak of the substance to be analyzed should be free
of interference. However, in a test for impurities, the selection of the peak area
integrator parameters becomes very important, particularly when baseline separations
are not always attainable. If baseline separations cannot be obtained, valley-to-valley
integration should be employed.
1.4 METHOD DEVELOPMENT AND VALIDATION
Introduction to Method Development
The number of drugs introduced into the market is increasing every year.
These drugs may be either new entities or partial structural modification of the
existing one. Often a time lag exists from the date of introduction of a drug into the
market to the date of its inclusion in pharmacopoeias. This happens because of the
possible uncertainties in the continuous and wider usage of these drugs, reports of
new toxicities (resulting in their withdrawal from the market), development of patient
resistance and introduction of better drugs by competitors. Under these conditions,
pharmacopoeias. It becomes necessary, therefore to develop newer analytical
methods for such drugs. (24)
Analytical methods should be used within good manufacturing practice
(GMP) and good laboratory practice (GLP) environments, and must be developed
using the protocols set out in the International Conference on Harmonization
guidelines. (25,26)
Method development is a continuous process that progresses in parallel with
the evolution of the drug product. The goal and purpose of the method should reflect
the phase of drug development. During early drug development, the methods may
focus on API behavior. They should be suitable to support preclinical safety
evaluations, pre-formulation studies, and prototype product stability studies. As drug
development progresses, the analytical methods are refined and expanded, based on
increased API and drug product knowledge. The methods should be robust and
uncomplicated, while still meeting the appropriate regulatory guidelines. Scouting
experiments are frequently performed during method development to establish the
performance limits of the method, prior to formal validation experiments. These may
include forced degradation studies, which are an integral part of development of a
stability-indicating method. API is typically subjected to degradation by acid, base,
peroxide, heat, and light. This allows for a determination of the capability of the
method to separate and quantify degradation products, while providing insight into
the main mechanisms of degradation. Once a stability-indicating method is in place,
the formulated drug product can then be subjected to heat and light in order to
Need for the Development of a New Method
Several reasons are available for the development of a new method of
analysis.(28)
There may not be a suitable method for a particular analyte in the specific sample
matrix.
Existing methods may be too erroneous, artefact and/or contamination prone, or
they may be unreliable (having poor accuracy or precision).
Existing methods may be too expensive, time consuming, or energy intensive, or
they may not be easily automated.
Existing methods may not provide adequate sensitivity or analyte selectivity in
samples of interest.
Newer instrumentation and techniques may have evolved that provide
opportunities for improved methods, including analyte identification or detection
limits, greater accuracy or precision, or better return on investment.
There may be a need for alternative method to confirm, for legal or scientific
reasons, analytical data originally obtained by existing methods.
Method Development Using HPLC
In method development, an attempt to select the best chromatographic
conditions like the best column, the best mobile phase, the detection wavelength etc.
to be used for routine analysis of any drug is done. For the method development by
components present in the sample, pKa values of different components, UV-Visible
Spectra of each analyte, solubility in different solvents, concentration range of each
component, nature of sample etc. Prior to method development there must be some
technical information i.e. chromatography method selection according to the sample
properties, the sample when analyzed with HPLC, the condition where all compounds
elute in a reasonable time, optimization of HPLC method with regard to analysis
time, resolution, selectivity and sensitivity. (29)
Analyte Standard Characterization
All the information about the analyte is gathered regarding the structure,
physical and chemical properties, toxicity, purity, hygroscopicity, solubility and
stability. The availability of the 100% pure standard analyte is determined along with
its storage and disposal information. If multiple components are to be analyzed in a
sample matrix, the number of components to be analyzed is noted and the availability
of the standard for each component is checked.(30)
Literature Search and Prior Methodology
The available literature is searched for all types of information related to the
analyte. Availability of information regarding the synthesis, physical and chemical
properties, solubility or relevant analytical methods is determined. Books, periodicals,
regulatory agency compendia, such as IP, USP/NF, and BP etc. should be referred.
Chemical Abstracts Service (CAS) automated/ computerized literature searches also
should be used. Information pertaining to prior analytical work on the analyte has to
be determined within the company and compile the available data, results, reports,
Choosing a Suitable Method
Using the available literature and previous methodology, the methods are
adapted and modified. Sample preparation and instrument conditions are adopted to
make use of the latest methods and instrumentation.
If no previous methods exist for the analyte in the literature, work from
analogy to investigate compounds that are similar in structure and properties. Usually
a compound with analytical method exists that is similar to the analyte of interest.
1.5 Optimization
a) Choice of method
The most commonly used chromatographic methods are normal phase
chromatography, reverse phase chromatography, reverse phase ion-pair
chromatography and ion-exchange chromatography. In the selection of suitable
chromatographic method for organic compounds, first reversed phase should be tried,
if not successful, normal phase should be tried, then reverse phase ion-pair
chromatography should be tried, ion-exchange chromatography at the end.
b) Choice of Mobile Phase
In reversed phase chromatography the selection of mobile phase is very
important for the analysis of the drug. We can use Acetonitrile frequently as it is
suitable for the entire UV range, methanol and Isopropanol are not suitable below
wavelength of 210 nm, acetic acid is suitable above a wavelength of 240 nm, for the
preparation of buffers, both K2HPO4 and KH2PO4 can be used in entire UV range,
suitable above 240 nm, ammonium acetate can be used above 215 nm, EDTA can be
used in entire UV range, sodium phosphate is suitable above 210 nm.
The organic phase concentration required for the mobile phase can be
estimated by gradient elution method. For aqueous sample mixtures, the best way to
start is with gradient reversed phase chromatography. Gradient can be started with
10% organic phase in the mobile phase and organic phase concentration (Methanol &
Acetonitrile) can be increased up to 100% within 20 - 60 min. Separation can then be
optimized by changing the initial mobile phase composition according to the
chromatogram obtained from preliminary run. The initial mobile phase composition
can be estimated on the basis of where the compounds of interest were eluted, at what
mobile composition.
Changing the polarity of the mobile phase can alter the elution of drug
molecules. The elution strength of a mobile phase depends upon its polarity, the
stronger the polarity, higher is the elution. Ionic samples (acidic or basic) can be
separated, if they are present in un-dissociated form. Dissociation of ionic samples
may be suppressed by proper selection of pH.
The pH of the mobile phase has to be selected in such a way that the
compounds are not ionized. If the retention times are too short, the decrease of the
organic phase concentration in the mobile phase can be in steps of 5%. If the retention
times are too long, an increase in 5% steps of the organic phase concentrations is
needed. When separating acid or bases, buffered mobile phase is required to maintain
consistency in retention time and selectivity. Buffered salts reduce peak tailing for
basic compounds by effectively masking silanol groups and also reduce potential
counter ion than sodium, it provides improved results compared to sodium (Na+).
Potassium phosphate is used for preparation of buffers of various pH. If band tailing
is observed for basic amphoteric compounds few drops of diluted triethylamine or
ammonium acetate is added, for acidic or amphoteric compounds, few drops of
diluted triethylamine or ammonium acetate is tried. For neutral compounds, the
aqueous eluent used in method development is water, for weak to medium acidic
compounds, 100 M H3PO4 buffer of pH 2.3, for weak to medium basic or acidic
compounds in ionized form 100 mM H3PO4 buffer of pH 4.0, 50 mM H3PO4 buffer of
pH 7.5 are used. Unknown sample should be analyzed first with water, then with an
acidic and a neutral buffer.
During mixing of the solvents in the preparation of mobile phase, the
difference in partial pressure of the individual solvent at a ratio they are to be
combined should be considered. The solvent system must be miscible with the
previously used mobile phase, if not intermediate solvent may be used, the one that is
miscible with previous mobile phase and new mobile phase.
c) Choice of Column
Columns being the heart of HPLC for optimum separation, Stable, high
performance column with good selectivity, efficiency is essential requirement for
rugged and reproducible method. These characteristics are dependent on the columns
manufacturer’s production of good quality columns and packing materials.
Column length
Shorter columns are chosen for shorter analysis time, lower back pressure, fast
equilibration and less solvent consumption. Column internal diameter
Wider diameter columns are chosen for greater sample loading.
Narrow columns are chosen for more sensitivity and reduced mobile phase
consumption.
Particle shape
Columns with spherical particle shapes are preferred when lower back pressure
column stability and greater efficiency is required.
Columns with irregular particle shapes are preferred when large surface area and
high capacity is required.
Particle size
Columns with small particle size of 3 - 4 µg are preferred for complex mixtures
with similar components. Combination of a short column (10 - 50 mm) with
small particle size is used for fast, high resolution separations.
Columns with larger particle size of 5 – 10 µg are preferred for structurally
different compounds.
Columns with large particle of 15 – 20 µg are used for preparative separations.
Surface area
Columns with high surface area packing are selected for more capacity, greater
Columns with low surface area packing are selected for quicker equilibration
time.
Carbon load
Columns with high carbon load are chosen for greater column capacities and
resolution.
Columns with low carbon load for faster analysis time.
End capping
Columns with end capped packing are selected to eliminate unpredictable
secondary interactions with base material
Columns with non-end capped packing are selected for selectivity differences for
polar compounds by controlling secondary interactions.
a) Choice of Detector
Detectors are eyes of the liquid chromatography system and measure the
compounds after their separation on the column. Selected detector should be capable of
responding to change in concentrations of all the components in the sample with
adequate sensitivity even to measure trace substances. The detectors must have certain
characteristics i.e. high sensitivity, higher linear dynamic range, application to most of
the solutes, does not contribute to band broadening, non-destructive, faster response.
Further Optimization
After the selection of a suitable method, mobile phase, column and detector,
For shorter analysis time
Change to isocratic method. The suitable mobile phase composition is estimated
from the gradient run.
Use of shorter column, if proper resolution is obtained.
For better resolution
Use of longer column.
Use of stationary phase with smaller particles (3 – 4 µg).
For better selectivity and sensitivity
Other stationary phases e.g. phenyl, CN etc.
pH control with ion-forming compounds
Use of methanol or THF instead of Acetonitrile.
Detection at the absorption maximum of the substance
All factors which leads to narrower and higher peaks as gradient elution, smaller
particle, and micro bore columns. (31)
1.6 Parameters Affecting Changes in Chromatograph
The various parameters affecting the changes in chromatographic conditions are
1. Flow rate
2. Temperature
3. pH
4. Ion pair reagent
5. Column efficiency
6. Capacity factor
7. Resolution
8. Retention time
9. Peak asymmetry
1. Effect of Flow Rate
The efficiency of a HPLC column varies with flow rate. It is sometimes useful
and readily utilized to increase the resolution. A faster flow rate of the eluent
minimizes the time required to run a column and thereby minimizes diffusion,
resulting in a better separation (less band broadening). However, the maximum flow
rate is limited because a finite time is required for analyte to equilibrate between
stationary phase and mobile phase. A slower flow rate will decrease the column back
Table 1.3 Flow rates for column with different internal diameter.
Internal diameter of column (mm) Standard flow rate (µl / min)
4.6 1000
2.1 200
1.0 50
0.30 4
2. Effect of Temperature
Elevated temperatures decrease viscosity and increase solubility and diffusivity.
Retention, peak shape, column efficiency, and total analysis time are affected by
temperature because both the thermodynamics and kinetics of adsorption processes are
functions of temperature. Additionally, temperature control results in improved
reproducibility. In liquid chromatography temperature is used in the optimization of a
separation. At higher temperature, peaks will be sharper and elute earlier. System
pressure is affected by temperature. The viscosity of the mobile phase decreases with
increasing temperature. For example if the HPLC system pressure is too high for a given
solvent system temperature of the column may be raised to 40 0C or even 60 0C. Higher
temperature will lead to a shorter column lifetime and some columns may not be able to
tolerate 60 0C. The combination of smaller diameter packing with shorter column lengths
at elevated temperatures facilitates efficient and fast separations, meeting the high
throughput performance requirements of the pharmaceutical industry. (33)
3. Role of pH
For some preparations the effect of changing pH is minimal. However for
degree of ionization of molecules in solution, affecting polarity of the solution
thereby changing the retention times in an HPLC separation. In a sample mixture, the
retention time of the components of the mixture are also changed to different extents.
Hence it affects the degree of selectivity, where the peaks become further apart or at a
particular pH they may co-elute and then the peak elution order will change. Selection
of a proper buffer pH is necessary to reproducibly separate ionizable compounds by
RP-HPLC. Selection of an improper pH for ionizable analytes leads to asymmetric
peaks that are broad, tall or split. (34)
During the selection of a buffer, pKa of the analyte should be considered. A
buffer with 2 pH units above or below pKa of the analyte is recommended for a good
peak shape. From Henderson- Hassel back equation,(35)
It can be determined that 99% of the analyte is in a single form, Good peak
shape is possible only when an analyte is in a single form. (36)
4. Role of Ion-Pair Reagent
Most of these compounds are ionic or polar; hence the use of reversed
phase-high performance liquid chromatography (RP-HPLC) is somewhat restricted. Initially
when deciding to select RP-HPLC or RP-HPLC with ion-pairing, the nature of the
analyte of interest is considered. If the sample is neutral, RP-HPLC is used first; and
if the sample is ionic, HPLC with ion pairing is used. Thus HPLC and
RP-HPLC with ion pairing are similar except that the latter consists of an ion-pair reagent
reagents are large ionic molecules having a charge opposite to the analyte of interest,
as well as a hydrophobic region to interact with the stationary phase. The counter-ion
combines with the ions of the eluent, becoming ion pairs in the stationary phase. This
results in different retention, thus facilitating separation of analytes.
The use of an ion-pair reagent is suggested only when separation is not
adequate with reversed-phase HPLC. This is because using an ion-pair reagent
introduces additional experimental parameters that need to be controlled, such as
selection of a suitable ion-pair reagent to use and its concentration. Because of this
added variable, reversed-phase HPLC should be utilized on any ionic analyte first
before trying ion-pair reversed–phase HPLC. The approach used in RP-HPLC to
separate charged analytes is ionic suppression. This technique is based on the pH
adjustment of the mobile phase to result in a non-ionized analyte. However, this
requires extensive method development and is only suitable for single compounds or
simple mixtures where the pKa’s of the analytes lie close together. (37)
5. Column Efficiency (N)
The efficiency of a chromatographic column is given terms of number of
theoretical plates (plate number), N
Where, tr- retention time measured from the time of injection, w- peak width
peak width obtained by drawing tangents to the sides of the Gaussian curve at the
inflection points and extrapolating the tangents to intercept the baseline as in fig 1.6
Efficiency of the column is also expressed as height equivalent to theoretical
Where, L- length of the column,
N- Number of theoretical plates. (38)
Fig. 1.5 Pictorial Representation of number of theoretical plates.
6. Capacity Factor (k’)
It is measure of the position of a sample peak in the chromatogram, being
specific for a given compound, a parameter which specifies the extent of delay of
substance to be separated.
Where, tr– retention time of the solute, tm – retention time of the unretained
compound by the column packing. Fig 1.7 shows capacity factor of a solute.
k’ depends at stationary phase, mobile phase, temperature and quality of
column packing. For good chromatographic performance with isocratic separation, k’
value should be in the range of 1-10. If k’ < 1.0, the bands are inadequately separated
from excessively unretained material, if k’ > 10 separation takes too long and bands
broadened, if k’ > 30, satisfactory isocratic separation using present column and
Fig.1.6 Pictorial representation of capacity factor.
7. Resolution (Rs)
The ability of the column to separate two solutes. In a chromatogram it is the
distance of separation of two peaks.
Where,tr1 ,tr2 – retention time of two immediately adjacent peaks,
[image:40.595.148.483.518.670.2]w1, w2 – peak widths of two immediately adjacent peaks as shown in fig 1.8.
1. Selectivity factor (α) / Relative Retention
This describes the relative position of two adjacent peaks. Ideally, it is
calculated using the capacity factor because the peaks separation depends on the
components interaction with the stationary phase.
Where,
k’a, k’b– capacity factors of peak a and peak b respectively.
The value of the separation factor is always greater than unity. The separation
factor is also identical to the ratio of the corresponding distribution constants. If the
capacity factor is used, the separation factor should be consistent for a given column,
mobile phase composition and specified temperature, regardless of the instrument used.
Fig.1.8 Pictorial representation of selectivity factor.
9. Peak Asymmetry (As)
It is also known as tailing factor. The asymmetry factor for a peak can be calculated
using the following formula.
.
Where, W0.05– peak width at 5% height from the base line,
f – distance between maximum and leading edge of the peak as in Fig 1.9
It is also calculated from
Where, b - distance from the point at peak maxima to the trailing edge,
a – distance from the leading edge of the peak to the peak maxima (both measured at
[image:42.595.188.444.297.595.2]10% height of the baseline) as shown in Fig 2.0.
Fig. 1.9 Pictorial representation of peak asymmetry.
Introduction to Method Validation
Validation is an integral part of quality assurance; it involves the systematic
study of systems, facilities and processes aimed at determining whether they perform
their intended functions adequately and consistently as specified. Validation in itself #
does not improve processes but confirms that the processes have been properly
developed and are under control.
Method validation is defined as the process of proving (through scientific
studies) that an analytical method is acceptable for its intended use. To ensure
compliance with quality and safety standards, the United States, Europe, Japan, and
other countries have published compendia, or pharmacopeias, that describe official
test methods for many marketed drug products. For example, analytical methods
found in United States Pharmacopeia (USP) are legally recognized analytical
procedures under section 501 (b) of the Federal Food, Drug, and Cosmetic Act. For
these compendia methods, USP provides regulatory guidance for method validation.
In addition, validation of analytical methods is covered by the United States Code of
Federal Regulations (CFR). A great deal of effort has been devoted to the
harmonization of pharmaceutical regulatory requirements in the United States,
Europe, and Japan. As part of this initiative, the International Conference on
Harmonization (ICH) has issued guidelines for analytical method validation. The
recent FDA methods validation draft guidance documents as well as U.S. both refer
to ICH guidelines. (39)
The required validation parameters, also termed analytical performance
characteristics or analytical figs of merit. Methods should be validated or revalidated
Before their introduction and routine use.
Whenever the conditions change for which the method has been validated, e.g.,
instrument with different characteristics.
Wherever the method is changed and the change is outside the original scope of
The validation of analytical procedures is directed to the four most common
types of analytical procedures: Identification tests; Quantitative tests for impurities'
content; Limit tests for the control of impurities; Quantitative tests of the active
moiety in samples of drug substance or drug product or other selected component(s)
in the drug product.
Method Validation (ICH Guidelines)
1. Accuracy,
2. Precision,
• Repeatability,
• Intermediate precision.
3. Specificity / Selectivity,
4. Limit of Detection,
5. Limit of Quantitation,
6. Linearity,
7. Range,
8. Robustness,
9. System Suitability.
The validation terminology in ICH guidelines differ from the validation given
in USP with two exceptions. Ruggedness is not included in ICH guideline and treats
system suitability as a part of method validation, whereas the USP considers it in a
Accuracy
The accuracy of an analytical procedure expresses the closeness of agreement
between the value which is accepted either as a conventional true value or an
accepted reference value and the value found. Accuracy should be established across
the specified range of the analytical procedure.
Accuracy is measured as the percentage of the analyte recovered by assay,
spiking samples in a blind study.
Accuracy studies for drug substance and drug product are recommended to be
performed at the 80, 100 and 120% levels of label claim as stated in the Guidelines
for Submitting Samples and Analytical Data for Methods Validation
Accuracy should be assessed using a minimum of 9 determinations over a
minimum of 3 concentration levels covering the specified range (e.g.3 concentrations
/3 replicates each of the total analytical procedure). Accuracy should be reported as
percent recovery by the assay of known added amount of analyte in the sample or as
the difference between the mean and the accepted true value together with the
confidence intervals.(40)
The acceptance criterion for accuracy is the Relative Standard Deviation
(RSD) for all the recovery values should not be more than 2.0%.
Precision
The precision of an analytical procedure expresses the closeness of agreement
(degree of scatter) between a series of measurements obtained from multiple
may be considered at three levels: repeatability, intermediate precision and
reproducibility.
The precision of an analytical procedure is usually expressed as the variance,
standard deviation or coefficient of variation of a series of measurements.
The relative standard deviation (RSD) for the assay of six sample preparations
should not be more than 2.0%.
Specificity
Specificity is the ability to assess accurately the analyte in the presence of
components which may be expected to be present in the sample matrix. Typically
these might include impurities, degradants, matrix, etc. it is a measure of the degree
of interference from such other things such as other active ingredients, excipients,
impurities, and degradation products, ensuring that a peak response is due to a single
component only.
Specificity is divided into two separate categories: identification and assay/
impurity tests. For identification purpose, specificity is demonstrated by the ability to
discriminate between compounds of closely related structures or comparison to a
known reference standard. For assay/ impurity tests, specificity is demonstrated by
the resolution of the two closely eluting compounds. These compounds are usually
the major component or the active ingredient and an impurity.
Limit of Detection (LOD)
The detection limit of an individual analytical procedure is the lowest amount
exact value. It is a limit test that specifies whether or not an analyte is above or below
a certain value.
It is expressed as a concentration at a specified signal to noise ratio usually a 2
or 3-to-1 ratio. Two other method can also be used to determine LOD: Visual
non-instrumental methods and a means of calculation: Visual non-non-instrumental methods
may include techniques such as thin-layer chromatography (TLC) or titrations. LODs
may also be calculated based on the standard deviation (SD) of the response and the
slope (S) of the calibration curve at levels approaching the LOD according to the
formula:
Where,
SD- standard deviation
S- Slope
The standard deviation of the response can be determined based on the
standard deviation of the blank, on the residual standard deviation of the regression
line, or the standard deviation of y-intercepts of regression lines. The method used to
determine LOD should be documented and supported, and an appropriate number of
samples should be analyzed at the limit to validate the level.
Limit of Quantitation (LOQ)
The limit of quantitation (LOQ) is defined as the lowest concentration of an
analyte in a sample that can be determined with acceptable precision and accuracy