Abstract: Recent past growth of multi-story buildings structures with emphasis on steel has been found satisfactory. For solving the better-quality accommodation in the region where the chances of earthquakes are likely, role of bracing system enhances the performance of building under lateral load effect of earthquakes. Various methods of bracing systems are available in practices however, eccentrically braced frames (EBFs) are fairly new lateral force resisting system established to resist seismic event in a probable manner. Properly designed and detailed EBFs perform in a ductile manner through shear or flexural yielding of link element. The ductile yielding indicates wide hysteresis loop, which is excellent energy dissipation essential for high seismic event. The seismic performance of multi-story steel frame is designed according to the Indian code (IS800:2007). A simple computer-based pushover analysis is a procedure for performance-based design of buildings subjected to earthquake loading. Pushover analysis gets much importance in the past due to its ease and efficiency of the results. In this study eight frames were taken,among these, six frames which were braced as V, Inverted V, and Diagonal and remaining two are frames without bracing in two alternate heights (4 and 8 story). Seismic response of frames is studied using non-linear static analysis (pushover analysis) in terms of base shear, roof displacement, spectral displacement, spectral acceleration and story drift.
Keywords: Steel Frame, Braced Frame, Pushover Analysis, Base Shear, Story Drift.
I. INTRODUCTION
Recent past growth of multi-story building structures with emphasis on steel has been found satisfactory. Every year, many people die because of earthquake around the world. The major loss is building collapse or damages due to earthquakes. It is essential to design a structure to perform better under earthquakes. The Kobe and the Northridge earthquake that happened in Japan and USA respectively were two examples where it lacked lateral stability of joints in steel structures. The structure can be stabilized by using the bracing system, moment resisting connections and a shear wall. Therefore, concentric, eccentric and knee bracing systems had been recommended and thus used by structural engineers. Inelastic performance is the principal feature affecting the selection of bracing system. The bracing system which has additional plastic deformation capacity prior to collapse has the capacity to absorb more energy when seismic excitation occurs.
Concentric braced frames provide considerable frame stiffness, but poor in energy dissipation ability and ductility because of significant loss of strength and stiffness
Revised Manuscript Received on July 22, 2019.
Prahlad Prasad, Brajkishor Prasad, Dept. of Civil Engineering. NIT Jamshedpur, India.
that occurs when brace buckles. Moment resisting frame possess excellent energy dissipation and ductility, but may lack the required stiffness unless large member sizes are used which are uneconomical. Eccentrically braced frames (EBF’s) are lateral load-resisting system for steel building that is hybrid between conventional moment- resisting frames (MRS’s) and concentrically braced frames (CBF’s). Eccentrically braced frames are in consequenceof an attempt to combine advantages of moment resisting frames and concentric braced frames, while curtailing the respective disadvantages [1]. Properly designed EBFs have high levels of ductility as of moment resisting frames and at the same time possesses high elastic stiffness similar to concentrically braced frame. An additional advantage of EBF’s over CBF’s is greater architectural liberty permitted with EBF’s.
The present study is conducted with the objective to examine the particularities of design and earthqake response of multi-story eccentrically braced frames. The steel frame is designed according to Indian code (IS800:2007).A simple computer-based pushover analysis is a procedure for performance-based design of buildings subjected to earthquake loading. Pushover analysis gets much importance in the past due to its ease and efficiency of the results. In this study eight frames were taken, among these, six frames which were braced as V, Inverted V, and Diagonal and remaining two are frames without bracing in two alternate heights (4 and 8 story). Seismic response of frames is studied using non-linear static analysis (pushover analysis).
II. LITERATUREREVIEW
Eger P Popov (1988)[1] obtained analytical and experimental result for diagonally braced frame models with eccentric connections. This aroused considerable interest in this bracing system for resisting seismic forces.While analysis of eccentrically braced frames, the only problem was the design of the shear links. To prevent from this, the lateral torsional buckling of links and contiguous beam was presented and buckling of flanges and webs was minimized. To specify this problem, he re-examined the data from the original 1/3rd. scale experiment with EBF. The W6*12 beams for these models of A36 with an effective size of approximate 11*6in., the webs were 0.23in. thick with a test yield strength of 50.4ksi. The model performed well in cyclic experiments. EBFs are economical as the beam sizes are smaller and the frames are stiffer than that in conventional moment-resisting design. Several EBF arrangements were done. They are as shown in Fig 1.
Performance Behavior of Eccentrically Braced
Steel Frame under Seismic Loading
Figure 1Some Alternative Bracing Arrangement of EBF’s
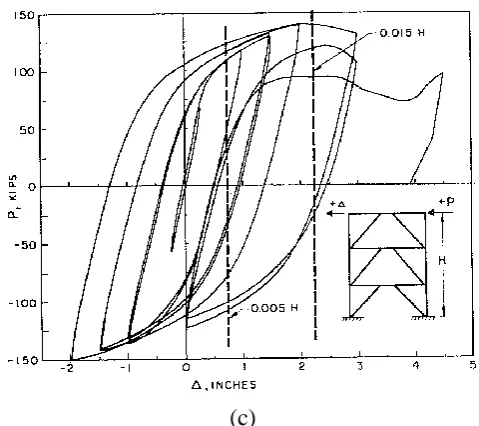
The energy dissipation capacity and ductilityof EBF was understood by relating actual behavior of frame under cyclic loading. Fig 2 shows experimentally found lateral loads versus displacement plots for an MRF, CBF, and an EBF.
(a)
(b)
[image:2.595.51.279.51.263.2](c)
Figure IITypical experimental frame behavior under cyclic lateral load. (a) MRF (b)CBF (c) EBF.
Fig 2 (a) Shows the MRFs capacity to sustain huge deformation without significant strength loss and are suggestive of the excellent energy dissipation capacity of MRF. As in fig 2(b) the loops are pinch and deteriorate as number of cycles rises and demonstrate the poor energy dissipation capacity of CBFs. Therefore, this poor behavior results in buckling of braces, ensuring quick deterioration under cyclic load. Fig 2(c) explains the hysteretic behavior of well-made EBF. By preventing buckling of braces and therefore they can bearhuge deformation without significant strength loss, and hence stable hysteretic loops are formedas of EBF.
For dynamic analysis, analytical frames of EBFs were modelled using computer programs, ANSR-1, DRAIN-2DX and open sees. Two-dimensional non-linear time history analyses were conducted for EBFs designed for American seismic conditions. They gave special attention to the selection of earthquake records and the calibration procedures. The results obtained from the study demonstrate that different analytical models give similar results in terms of maximal elements forces but exhibit much higher variability regarding inelastic deformations both at element and global structural level. This may be significant when estimates of inelastic structural deformations are used as the key parameter in design. They also found from the previous findings that limited yielding of beams and braces does not seem to have aadverse impact on overall frame performance. Preliminary results obtained from Opensees suggest that this limited yielding does not have aundesirable impact on the overall frame behavior.
S.O. David and S. Koboevic (2008)[2] investigated the earthquake performance of EBFsmodelled for Canadian conditions. They preferred the taller frames with shear-critical links, located in typical eastern & western North-American siteswith shearresistance required for seismic load cases. It causes to over-strengthen the
[image:2.595.55.285.370.734.2]stories of the frames.
Later,a special link element was established by Riches & Popov (1994)with the help of computer program ANSR-1 [3]. The link was calibrated using the results of experimental studies conducted by Okazaki et al (2005) [4]. For other frame members standard beam columns elements were used. The results obtained indicated that the structures in Vancouver developed links shear forces and deformations higher than those anticipated in design. In spite of large reserve of strengths, they absences limited yielding of braces & columns. Hines, Eric M.(2009)[5]studied the EBFs design for modest seismic active regions. The three cases for Eccentric Braced Framed Design in modest seismic active regions were explained. A theoretical 9-story EBF design was modelled for Boston, Massachusetts according to the AISC 2005 provisions without exceeding the weight of an R=3CBF. Links were designated to be as like as possible.
Hussain Imran K. M. et al. [6] analyzedthe Steel Frames with and without Bracesconsidering the of earthquake and wind loads. It has shown that due to Bracings at peripheral of structure the base shear increases up to 40% for zone-III.The roof displacement values decreased up to 45%. The result showed that braces play a very significantrole on structural behavior when lateral loads are considered.From this it is clear that steel structure is highly effective against lateral loads particularly with braced structures and the main disadvantage is corrosion and maintenance of steel structure. Mohammed Idrees Khan and Mr. Khalid Nayaz Khan (2014)[7]analyzed the of steel frame designed with Braces using Pushover analysis. The structure designed to accomplishgood under earthquake loads. The shear capacity has been increased by providing steel braces in the structural systems. A typical 15-storey regular steel frame building was designed for concentric braces like Diagonal braces, V braces, X braces and Exterior X bracings. From the results obtained it concluded that Pushover analysis is a good method to assess the structure for earthquake loads.
A.J. Fussell et al. [8]studied EBFs with replaceable active links elements. It involves overview of research, experimental testing and finite element method of EBFs with replaceable shear links.
Paul Richards and Chia-Ming Uang (2014) [9]studied analytically to develop a new testing loading procedure for short link elements in EBFs. Three EBF's were designed according to current US seismic provisions. The three unique EBF's consist of one 3-storey building and one 10-storey building.They have justified that a shear link element loading procedurestated in the AISC Seismic Provisions is the improved form of moment frame.
2.2 Past Studies on Pushover Analysis
Krawinkler and Seneviratna (1998) [10]performed a comprehensive study todeliberate the advantages, disadvantages of pushover analysis in view ofseveralcharacteristics of the method.The precision of pushover calculationswasassessed on a 4-story steel perimeter frame damaged in 1994 Northridge seismic excitation. Sasaki, K. K., S. A. Freeman, and T. F. Paret(1998) [11] described the multi-mode pushover procedure (MMP) – a procedure which may help to recognize failure modes due to higher modes and the shortcoming of current pushover
procedures. MMP uses capacity spectrum method for graphically compare the pushover curve to earthquake demand. The base shear and displacement foe each pushover areconverted to spectral acceleration (Sa) and spectral displacement (Sd) are graphed in the Acceleration- Displacement Response Spectrum format(ADRS) as pushover curves. The intersect of pushover curve with the spectrum represent the demand on the building for particular ground motion.
Chopra, Anil K., and R. Goel (2001) [12]assessed the accurateness of the modal pushover analysis procedure in estimating the seismic demands for six SAC buildings and compared these results with those results obtained for the same buildings by pushover analysis using three force distributions in FEMA-273.Later they concluded the shortcomings of FEMA force-based pushover analysis as (a) the drift increased in top stories of structure inBoston, (b) the huge story drifts in top stories and (c) the complex difference of story drifts over the height of the 20-story buildingin Los Angeles.
Rakesh K. Goel (2003) [13]evaluated the nonlinear static pushover procedure, the sum-difference procedure and the modal pushover analysis(MPA procedure) and concluded that the MPA procedure estimated drifts are better when compared to the FEMA 356 and a sum-difference procedure.
3.1 Problem Formulations
[image:3.595.316.539.445.835.2]Example problem 3.1.1: 4 Story Steel Frames without Bracing and Frame with V braces, Inverted-V braces and Diagonal braces types of EBFs.
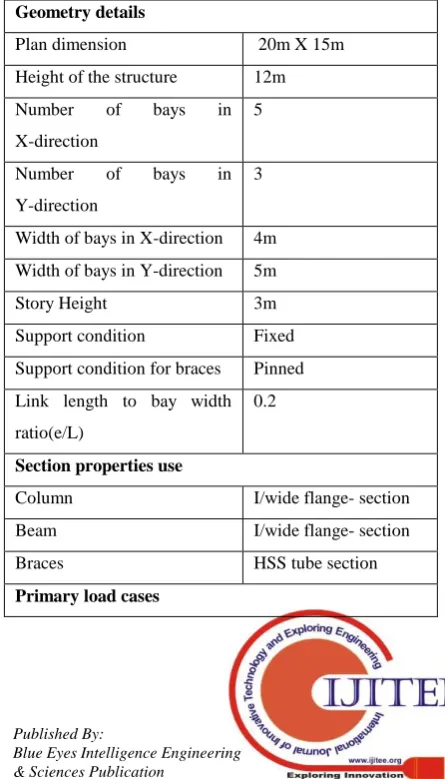
Table 3.1: Problem statement for analysis
Geometry details
Plan dimension 20m X 15m
Height of the structure 12m Number of bays in X-direction
5
Number of bays in Y-direction
3
Width of bays in X-direction 4m Width of bays in Y-direction 5m
Story Height 3m
Support condition Fixed Support condition for braces Pinned Link length to bay width
ratio(e/L)
0.2
Section properties use
Column I/wide flange- section
Beam I/wide flange- section
Braces HSS tube section
Self-weight Applied in Z-direction Slab -Dead load 3.5 kN/m2
Cladding load 3.5 kN/m UDL all over perimeter beam
Roof finish 1kN/m2
Floor finish 1kN/m2
Roof - Live load 1.5kN/m2 Floors - Live load 3kN/m2
Earthquake parameter
Earthquake code IS1893:2002(part I)
Seismic zone III
Soil type Medium soil
Importance factor 1
[image:4.595.326.522.45.556.2]Response reduction factor 5
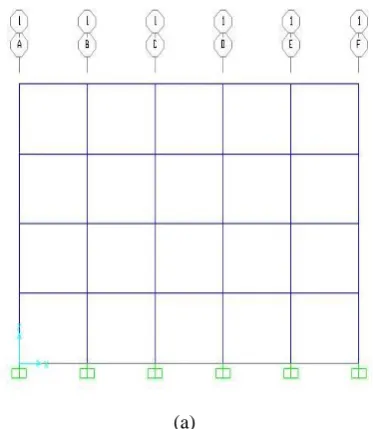
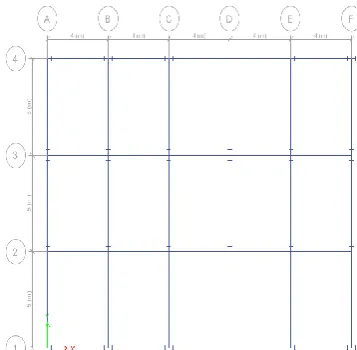
Figure 3Plan and orientation of columns of 4 story steel frame building
(a)
(b)
(C)
[image:4.595.76.263.506.721.2](a)
[image:5.595.101.239.49.517.2](b)
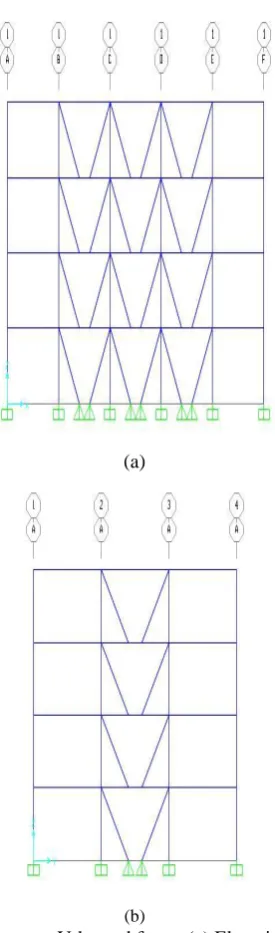
Figure 5 Four story V-braced frame (a) Elevation of 1and 4 (b) elevation of A and F
(a)
[image:5.595.364.488.51.278.2](b)
Figure 6 Four story Inverted –V braced frame (a) elevation of 1 and 4 (b) elevation of A and F
(a)
[image:5.595.103.236.554.765.2]of 1 and 4 (b) elevation of A and F
[image:6.595.329.508.68.243.2]Example problem 3.1.2: 8 Story Steel Frames without Bracing and Frame with V braces, Inverted-V braces and Diagonal braces types of EBFs.
Table 0.1 Problem statement for analysis 1. Geometry details
Plan dimension 20m X 15m Height of the structure 24m Number of bays in X-direction
5
Number of bays in Y-direction
3
Width of bays in X-direction 4m
Width of bays in Y-direction 5m
Story Height 3m
Support condition Fixed Support condition for braces Pinned Link length to bay width
ratio(e/L)
0.2
1. Section properties used
Column I/wide flange- section
Beam I/wide flange- section
Braces HSS tube section
2. Primary load cases
Self-weight Applied in
Z-direction Slab - Dead load 3.5 kN/m2
Cladding load 3.5 kN/m UDL all over perimeter beam
Roof finish 1kN/m2
Floor finish 1 kN/m2
Roof - Live load 1.5 kN/m2
Floors - Live load 3 kN/m2 3. Earthquake
parameter
Earthquake code IS1893:2002(part I)
Seismic zone III
Soil type Medium soil
[image:6.595.42.268.117.774.2]Importance factor 1 Response reduction factor 5
Figure 8: Plan and orientation of columns of 8 story steel frame building
(a)
(b)
[image:6.595.347.521.289.723.2](a)
[image:7.595.344.503.54.249.2](b)
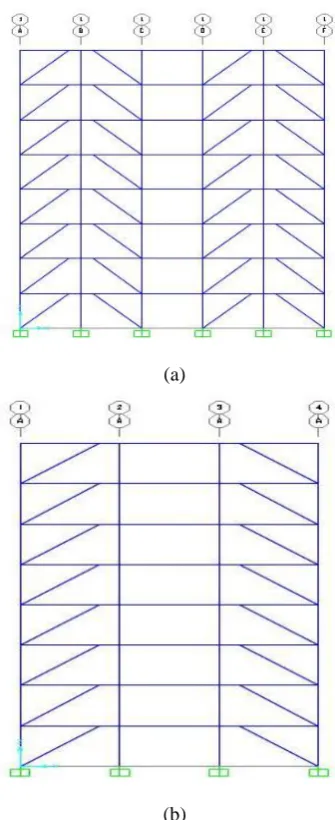
Figure 10: 8 Story V-braced frame (a) Elevation of 1 and 4 (b) elevation of A and F
(a)
(b)
Figure 11: 8 Story Inverted-V braced frame (a) elevation of 1 and 4 (b) elevation of A and F
(a)
[image:7.595.339.507.285.696.2](b)
Figure 12:8 Story Diagonal braced frame (a) elevation of 1 and 4 (b) elevation of A and F
3.2 Modelling for Linear and Nonlinear Analysis A model replicates the real
[image:7.595.91.241.571.746.2]which is designed mainly to diagnose the damages, therefore, needs nonlinear analysis. The method of modelling is the major task for controlling the nonlinear analysis, therefore building frame must be modelled for nonlinear behavior.
3.2.1 Linear Analysis of Structure
The behavior of structure under earthquake is quite different. While performing the linear analysis of structure, structure is allowed to perform up to elastic limit only. The linear analysis of structure is done in following ways:
1) Equivalent static analysis 2) Response spectrum analysis 3) Time history analysis
In our study linear analysis is done with response spectrum analysis method.
3.2.1.1 Response Spectrum analysis
[image:8.595.66.272.317.531.2]This is one of the most popular method. The response spectrum curve is used to dothis type of analysis. The response spectrum curve is the summation of peak responses of the idealized single degree freedom system subjected to the various earthquake ground motions.
Figure 13: Response Spectra for medium soil for 5% damping
This method idealizesthat the mass of structure on every floor is lumped at roof levels. The diaphragm is modelled at this level to ensure the rigidity at this level. Here the elasticity remains during the analysis and no stiffness degradation occurs. In this method the profile of lateral forces is not arbitrary anymore but calculated by combination of different modes of structure.
3.2.2 Nonlinear static analysis (pushover analysis)
In the Nonlinear Static procedure the structural behavior is no longer linear, and the rules of elasticity do not apply any more. Stresses are not proportional to strains; forces are not proportional to displacement and bending moments are not proportional to curvatures. A lateral force profile that approximates the earthquake loading is applied with several different types of force distributions: triangular, uniform, modal or even adaptive distributions that change from step to step. Obviously, the structural and member stiffness is no longer constant, but rather it is updated at every step and the
structure gradually softens as plastic hinges develop at the locations of structural damage. As a result, the force vs. deformation curve, which is the so-called capacity curve, is not linear any more, but has a parabolic shape as the structural deformations increase disproportionally with the level of lateral loading. In other words, for the same level of load increase, the increase of the deformations gets larger as we push further on in the inelastic range.
3.2.2.1 Capacity
For deformation-controlled actions, the component capacities are taken as permissible inelastic deformation limits that are determined considering all coexisting forces and deformations at the target displacement. For force-controlled actions,the component capacities are taken as lower‐bound strengths that are determined considering all coexisting forces and deformations at the target displacement
3.2.2.2 Demand
For deformation-controlled actions, the component demands are the deformations, as these are calculated from the nonlinear analysis.For force-controlled actions, the component demands are the forces, as these are calculated from the nonlinear analysis. Here, the demands are not determined from capacity design considerations, as in the linear methods, since inelasticity is explicitly accounted for the nonlinear analysis method, and the capacity design concept is not needed anymore
3.2.2.3 Performance
The main concept behind performance-based engineering is the need for more than one performance levels, contrary to the current design practice, which imposes one main performance level (usually collapse prevention) with limited requirements and some additional clauses for the serviceability limit state. All the assessment methodologies that found in the modern codes are based on this philosophy, whilst there is also a tendency to change gradually as the philosophy of design codes too.
III. RESULTANDDISCUSSIONS Introduction
Typical 1st mode shape Lateral load profile Figure 14: Typical 1st mode shape and lateral load profile.
3.2 First Mode Shapes
First mode shapes for frame without bracing, inverted-v brace, V-brace and diagonal braced framed for two different heights i.e. 4 story and 8 story are obtained and shown in fig4.2 and fig4.3 respectively.
(b) Inverted-V brace frame
(d) Diagonal braced frame
Figure14 : 1st mode shapes of 4 story steel frame
(a) Frame without bracing
(c) V- braced frame
(b) Inverted-V brace frame
(c) V- braced frame
[image:10.595.305.546.50.648.2](d) Diagonal braced frame
Figure 15: 1st mode shapes of 8 story steel frame
4.3 Fundamental natural period
[image:10.595.311.542.58.404.2] [image:10.595.108.254.60.238.2]The fundamental time period of the frame isfound by both IS code and modal analysis performed in SAP2000. The values are presented in table 4.1. The fundamental time period from the modal analysis is more than that suggested by the code in each case, therefore base shear is reduced to some percentage.
Table III.1 Fundamental period of vibration Type of frame IS code
time period T (sec)
Computational time period T (sec)
4 -Story frame Frame without bracing
0.548 1.23942
Inverted-V braced frame
0.548 0.82865
V-braced frame 0.548 0.77999 Diagonal-braced
frame
0.548 0.65626
8- story frame Frame without bracing
0.922 2.4168
Inverted-V braced frame
0.922 1.1699
V-braced frame 0.922 1.168
Diagonal-braced frame
0.922 1.33568
[image:10.595.85.260.395.632.2]3.3 Interstory Drift
[image:10.595.307.547.435.659.2]Figure 17: Variation of story drift of model frames of 8 story
Fig16 and fig 17 shows the plot of story drift at different story levels for different model of 4 and 8 story considered in this study. It is observed that story drift reduces considerably in braced frames when compared to frame without bracing. Also, diagonal braced frame has reduced story drift than another brace frame (Inverted-V and V-braced frame).
3.4 Pushover curve
[image:11.595.305.554.313.519.2]Pushover analysis is performed on modelled frame as describes in chapter 3 by using SAP2000 and pushover curves for modelled frames are presented and shown as follows.
Figure 18:Pushover curve of 4 story steel frame without bracing
Figure 19: Pushover curve of 4 story steel frame with Inverted-V bracing
[image:11.595.52.283.451.665.2]Figure 21: Pushover curve of 4 story steel frame with diagonal bracing
Figure 23: Pushover curve of 8 story steel frame without bracing
Figure 22: Pushover curve of 8 story steel frame with Inverted-V bracing
Figure 24: Pushover curve of 8 story steel frame with V- bracing
Figure 25: Pushover curve of 8 story steel frame with diagonal bracing
3.5 Comparison of Pushover Analysis of Model Frame
Table III.2Base shear and displacement of 4 story Type of frame Base shear(kN) Displ (m) Frame without
bracing
1740 0.48
Inverted-V braced frame
1896.45 0.089
V- braced frame 3052 0.171
Diagonal braced frame
3408 0.0746
Table III.3 Base shear and displacement of 8 story Type of frame Base
shear(kN)
Frame without bracing
2681 0.96
Inverted-V braced frame
3066.9 0.457
V- braced frame 2743.8 0.2515
Diagonal braced frame
[image:13.595.43.293.50.389.2]3435.39 0.147
Figure 26: Comparison amongst 4 story model frames
From the above two figure i.e. fig 26 and fig 27it is clear that the capacity of braced frame is more than the capacity of frame without bracing.
Figure 27: Comparison amongst 8 story model frames
3.6 Performance Point
[image:13.595.49.290.450.628.2]The performance point is the point where the capacity and demand of structure are equal. Hence, performance point is determined automatically by SAP2000 using procedure described in ATC-40. As displacement increases, the period of the structure lengthens. This is reflected directly in the capacity spectrum. Displacement increases the damping and reduced demand; hence optimum point should have a higher capacity for lesser displacement.
Figure 28: Performance curves of model frame of 4 story
Figure 29:Performance curves of model frame of 8 story
IV. CONCLUSION
Following are the major conclusions obtained from the present study.
1. There is difference between modelled time period of srtucture and IS code time period.
2. Fig. 4.4 and fig. 4.5 shows the plot of story drift at different story levels for different model of 4 and 8 story considered in this study. It is observed that story drift reduces considerably in braced frames when compared to frame without bracing. Also, diagonal braced frame has reduced story drift than another brace frame (Inverted-V brace and V-brace frame).
3. Fig. 6.12 and fig.6.13 shows the pushover curves for Inverted-v brace frame, V- brace frame, Diagonal-brace frame and frame without bracing for two different heights i.e. 4 story and 8 story respectively. It can be observed that frame without bracing has got more performance displacement and less base shear when compared to the other models. It can been seen that bracing have increased level of performance both in terms of base shear carrying capacity and roof displacement.Also the base shear carrying capacity of diagonal brace frame is more than that of inverted-V and
V-brace frames.
4. The provision of bracing enhance the base shear carrying capacity of the frames and reduces the roof displacement undergone by structure.
5. Fig. 4.16 and fig. 4.17shows that capacity and demand curve drawn for steel frame models with different bracing arrangements and also for frame without bracing for zone III. The diagonal brace model has increase performance level compare to other type of bracing arrangements.
6. Pushover analysis is good approach to get performance of structure.
Recommendation for Future Work
1. Eccentrically braced frame with alternate link lengths along the frame height can be study.
2. Nonlinear dynamic analysis for the present work needs to be used for better performance evaluation.
3. Location of progressive collapse failure due to sudden failure of critical structural members may be identified and quantified using the basic concept of the present study.
4. Performance based design can be done.
5. Building with unsymmetrical plan can also be analysed with procedure given in the paper.
REFERENCES
1. Popov, Egor P., and Michael D. Engelhardt. "Seismic eccentrically braced frames." Journal of Constructional Steel Research 10 (1988): 321-354.
2. Popov, E. P., J. M. Ricles, and K. Kasai. "Methodology for optimum EBF link design." Proceedings, Tenth World Conference of Earthquake Engineering. Vol. 7. 1992.
3. World Conference on Earthquake Engineering. Beijing. 2008. 4. Mohammed Idrees Khan and Mr. Khalid Nayaz Khan, “Seismic
Analysis of Steel Frame with Bracings using Pushover analysis.”International Journal of Advanced Technology in Engineering and Science, Volume No.02, Issue No. 07, July 2014. 5. Goel, Rakesh K. "Evaluation of nonlinear static procedures using
strong-motion building records." Civil and Environmental Engineering (2003): 70.
6. Chopra, Anil K., and R. Goel. "Modal pushover analysis of SAC buildings."Proceedings SEAOC Convention, San Diego, California. 2001.
7. Federal Emergency Management Agency (FEMA),( 1997).NEHRP 8. IS 1893 Part 1 (2002),”Indian Standard Criteria for Earthquake
Resistant Design of Structures”, Bureau of Indian Standards, New Delhi
9. IS: 800 (2007), General Construction in Steel – Code of Practice, Bureau of Indian Standards, New Delhi, 2007
10. Applied Technology Council, ATC-40. Seismic evaluation and retrofit of concrete Buildings, California, 1996; Vols. 1 and 2.