Abstract: In this paper we compare and analyze the complexity of three functions: Fast Fourier transform (FFT), Discrete Cosine Transform (DCT) and Discrete Wavelet Transform (DWT), used in image transformation. The purpose of all the algorithms is to shift the signal from space or time domain to frequency domain for de-noising or compression. We compare the simulated process time of both one and two dimensional FFT, DCT and DWT (Symlet and Debauches 1) using image and speech signal. The process time is found lowest for FFT and highest for DWT, provided its basis function governs the process time and DCT provide the moderate result. Finally the quality of compressed image under the three mathematical functions are compared, where DWT is found as the best and FFT yields worst result.
Keywords: Basis function, MSE, Butterfly algorithm, process time, confidence level.
I. INTRODUCTION
E
normous number of recent works found pertinent to comparison of three mathematical functions: DFT, DCT and DWT. In [1], DCT, DWT and FFT are applied in lossy image compression technique including theoretical analysis of above three functions. Similar analysis is found in [2] by the same authors, where the image of 256 × 256 for DCT, 100 × 100 for FFT and 720 × 720 for DWT are used and the percentage compression is shown in tabular form.The final conclusion of both papers is DCT is the best lossy image compression technique. We get the same illusion from JPEG compression algorithm but JPEG 2000 uses DWT. The ECG signal of telecardiology contains large amount of data to be recorded hence its compression is necessary. The following mathematical tools of frequency analysis: FFT, DST, DCT, SAPA/FAN and DCT-II are applied for lossless compression of ECG and DCT and SAPA/FAN is found better than other techniques in lossless compression, explained in [3].
Revised Manuscript Received on November 05, 2019. * Correspondence Author
Samsunnahar Khandakar, M.Sc. Student, Department of Computer Science and Engineering, Jahangirnagar University, Dhaka, Bangladesh.
Email: [email protected]
Jahirul Islam Babar, M.Sc. Student, Department of Computer Science and Engineering, Jahangirnagar University, Dhaka, Bangladesh.
Email: [email protected]
Anup Majumder*, Lecturer, Department of Computer Science and Engineering, Jahangirnagar University, Dhaka, Bangladesh.
Email: [email protected]
Md. Imdadul Islam, Professor,Department ofComputer Science and Engineering, Jahangirnagar University, Dhaka, Bangladesh.
Email: [email protected]
In [4], the performance of 32 and 64 point FFT is computed applying multiple RADIX Algorithms. The authors applied the concept of pipeline in FFT, to increase the throughput of system. Simulation of three algorithms: Radix-2, Radix-4 and Radix-8 is used for comparison. In [5], instead of ‘minutiae based approach’ the authors applied ‘image based approach’ in fingerprint identification. Four mathematical tools: Fast Fourier Transform (FFT), Discrete Cosine Transform (DCT), Discrete Wavelet Transform (DWT) and Gabor Filter has been implemented for feature extraction of fingerprint. The paper also deals with details theoretical analyses of above mathematical tools and the distribution of their coefficients. Similar technique i.e. feature vector of an image of fingerprint is determine using above three mathematical tools in [6], where the percentage of recognition rate is found maximum for DCT and worst for DWT and FFT provides some intermediate value.
Watermarking technique have been applied in several color image by combining DWT (Discrete Wavelet Transform) and DCT (Discrete Cosine Transform). By selecting one color component from RGB (red, green, blue) components of color image, the watermarking technique is done. This methodology is more secured and impactful because the embedded watermarking can only be extracted from the red component or features as discussed in [7]. Combination of DWT and DCT has been used for embedding and extraction copyright protection by using digital watermarking method. This two method DWT+DCT applied on two-dimensional images. This technique works in frequency domain and it is more robust then provides good performance as proposed in [8]. Shivang Ghetia et al. has executed 2-D discrete cosine transform algorithm on GPU. They have used and implemented 2-D DCT with parallel approach on NVIDIA GPU using CUDA (Compute Unified Device Architecture) as discussed in [9].
The Fast Fourier Transform is at every turn used in digital signal processing algorithms. FFT algorithms utilize many applications for example, OFDM, noise reduction, digital audio broadcasting, and digital video broadcasting. It’s used to design butterflies for a separate point of FFT discussed in [10]. A similar application of FFT is found in [11], where Cooley and Tukey explained the FFT algorithm relevant to digital signal processing by decreasing the order of complexity of DFT from N2 to Nlog2N. The paper includes the architectures of FFT processor to implement OFDM transmissions, such as a
Single path Delay Commutator
(SDC), Multipath Delay
Commutator (MDC), Single
Complexity Analysis and Accuracy of Image
Recovery Based on Signal Transformation
Algorithms
path Delay Feedback (SDF), and Multipath Delay Feedback (MDF). A unique approach to design and perform Fast Fourier Transform(FFT) using Radix-42 algorithm, and how the multidimensional index mapping reduces the complexity of FFT computation have been proposed in [12].
The principal objective of this article is to compare the complexity of three different algorithms of DFT, DCT and DWT both analytically and to verify the time complexity by simulation. We next apply all the algorithms in image compression to observe the quality of images at a glance then then we verify the observation by evaluating mean square error (MSE) between original and recovered image.
The remainder part of the article is composed as section II presents the theory and methodologies of DFT, FFT, DCT and DWT; section III confers the result and discussions based on the theoretical investigation of section II and section IV determines the complete analysis.
II. METHODOLOGY
A. DFT and FFT
The Fast Fourier Transform (FFT) is such an algorithm that measures the discrete Fourier transform (DFT) of a sequence, or its counter operation i.e. IDFT is done by IFFT. Fourier transform assign a signal from its original domain (often time or space) to a representation in the frequency domain and vice versa.
To produce FFT from DFT, we can separate the an N-point DFT of,
𝑋 𝑚 = 𝑁−1𝑛=0𝑥 𝑛 𝑒−𝑗 2𝜋𝑛𝑚𝑁 (1) into its even and odd indexed elements like,
𝑋 𝑚 = 𝑥 2𝑛 𝑊𝑁2𝑛𝑚 + 𝑊𝑁𝑚 𝑥 2𝑛 + 1 𝑊𝑁2𝑛𝑚 𝑁/2−1 𝑛=0 𝑁 2−1 𝑛=0
Where, 𝑊𝑁= 𝑒− 𝑗 2𝜋
𝑁
The sequence X(m) again can be resolve into two parts like,
𝑋 𝑚 = 𝑥 2𝑛 𝑊𝑁/22𝑛𝑚+ 𝑊𝑁𝑚 𝑁/2−1𝑛=0 𝑥 2𝑛 + 1 𝑊𝑁/22𝑛𝑚 =
𝑁 2−1
𝑛 =0
𝐶 𝑚 + 𝑊𝑁𝑚𝐷(𝑚)
and
𝑋 𝑚 + 𝑁/2 = 𝑥 2𝑛 𝑊𝑁/22𝑛𝑚 − 𝑊𝑁𝑚 𝑥 2𝑛 +
𝑁 2−1 𝑛=0 𝑁 2−1 𝑛=0 1 𝑊𝑁
2
2𝑛𝑚 = 𝐶 𝑚 − 𝑊
𝑁𝑚𝐷 𝑚
Above process is continued to get 2-point DFT called FFT.
B. Discrete Wavelet Transform
In DWT the scaling and shift parameters are a = 2m and b = n2m respective, where m and n are integer. The basis function is written as,
(2 ) ()
2 2 )
( ,
, t n t
n t a
b t
t m mn
m m
b
a
and the DWT of f(t) is,
2 ( 1)
2 () (2 )
2 1 ) , ( n n m m m
m f t t ndt
n m
d (6)
The DWT of a discrete time sequence f(n) is computed in an alternate way like,
1
0
,
0 ( ), ( )
1 ) , ( 0 N n k k n n f M k k
W (7)
1 0 , ( ) ), ( 1 ) , ( N n k j n n f M k jW , for j ≥ k0, (8)
where , ( )
0k n k
and j,k(n) are the scaling and wavelet basis function, k0 is the arbitrary staring scale, W(k0,k)and) , (j k
W are the approximation and detail coefficients.
C. 2D DWT
One scaling function φ(x, y) of 2D DWT and three wavelet functions
i(
x
,
y
);
D V H
i , , are used. Let us consider
an image f(p, q) of sizeMN2J2L. The DWT is expressed as:
1 0 1 0 , ,0 ( , ), ( , )
1 ) , , ( 0 M p N q n m
k pq
q p f MN n m k
W (9)
1 0 1 0 , , ( , ) ), , ( 1 ) , , ( M p N q i n m j i q p q p f MN n m jW
, (10)where i
H,V,D
Usually k0 = 0 as the convention, M = N = 2J, j = 0, 1, 2,..,
J-1and m = n = 0, 1, 2, …, 2j-1.
The scaling and wavelet basis function are expressed as,
x y
jx m jy n
jn m
j, , , 222 ,2
and
x y i
jx m jy n
ji n m
j
, 22 2 ,2
,
, ,
where their shape depends on type of wavelet like Haar wavelets, Symlets, Daubechieswavelets etc.
D. Discrete Cosine Transform
The DCT of a two dimensional signal
f
(
m
,
n
) is
expressed
as,
. 0 ; 1 , 0 2 ) 1 2 ( cos 2 ) 1 2 ( cos ) , ( 1 ; 0 ) , ( 2 ) , ( 1 0 1 0 1 0 1 0 v u N v u N v n N u m n m f N v u n m f N v u F N m N n N m N n (11)
Here instead of exponential basis function of DFT, DCT uses the cosine function as the basis function.
III. COMPLEXITYANALYSIS
Fast Fourier transform (FFT) is an algorithm which is used to implement Discrete Fourier Transform (DFT) with lowest complexity, whereas two stage DFT is an intermediate algorithm found better than
conventional DFT but worse than
FFT. The complexity of
conventional DFT is O(N2), complexity of Butterfly/Radix-2 DFT is O(Nlog2N) and complexity of 2-stage DFTs is
O(N2/4), the similar complexity is also found for DCT. Two dimensional Haar DWT or 2D Fast Fourier Transform has complexity of O(4N2log2N). The 2D DWT based on the
Mallat wavelet function has the complexity of O(4MN2log2N), where M represents the vanishing moments
number of the mother wavelet used. Actually complexity of DWT depends on basis functions but DFT and DCT has the same basis function hence always shows the same complexity.
IV. ALGORITHMINCOMPUTATIONPROCESS
TIMEANDMSEOFIMAGES
The entire operation of FFT, DCT and DWT on image and signal vector, used in this paper is given below.
1. Read the RGB image IRGB
2. Convert the image IRGB to grayscale image I of M×N
3. Convert I(x, y) to a one dimensional vector x(k) of 1×MN 4. Apply one dimensional DFT, two stage DFT, FFT, DCT
and DWT on x(k)
5. Measure CPU time of above operation called experimental process time
6. Compare it with theoretical CPU time derived from big O notation and CPU cycle
7. Apply two dimensional DFT, two stage DFT, FFT,DCT and DWT on I(x, y)
8. Measure CPU time
9. Apply 8×8 block processing operation on image I(x, y) using a mask of zeros in medium and high frequency region and ones in low frequency region under DCT like JPEG. Compare the original and compressed images. 10. Apply similar operation under FFT and compare the
original and compressed images
11. Apply DWT under hard threshold to compress the image I(x, y)
12. Compare the original and compressed image using the formula of mean square error (MSE) as:
N
i m
j N
i m
j
j i x
j i y j i x
e
1 1 2 1 1
2
) , (
) , ( ) , (
(12)
Where, x represents the original image and y is the recovered one from the compressed one.
The next part of the paper will deal with the result based on operation of this sub-section.
V. RESULTANALYSIS
We run the algorithm on the data array of size 4, 8, 16, 32, 64, 128, 256, 512, 1024, 2048 and 4096. Every time we determine the process time on the PC (Intel® Core™
i7-8550U CPU, 1.80 GHz, 8.00 GB RAM,
CLOCK_PER_SECOND =1000) and plot the results shown in the following fig.1. Incorporating machine parameters with the theoretical complexity (using big O notation) of DFT, we compare the analytical and simulated process time (run time of code) of DFT and found the confidence level of 98% or above. The comparison is made for three cases: in fig.
1(a) butterfly DFT called FFT in fig. 1(b) 2-stage DFT and in fig.1 (c) Conventional DFT.
(a)
(b)
(c)
Fig.1 Comparison of theoretical and experimental process time for (a) Butterfly (b) Two stage and (c)
Fig.2 Comparison of process time among three types of DFT operation
After getting high confidence level we only use the simulation results for the rest of the results section. Fig.2 shows the comparison of Butterfly, two stage and conventional DFT, where butterfly seems to be the best, two stage DFT show moderate result and the conventional DFT needs maximum process time. The increment of process time of both two stage DFT and the conventional DFT is linear but
Butterfly DFT seems to be non-linear hence the difference in process time for larger input data becomes wider visualized from fig.2.
Next we compare of process time of one dimensional DWT, DCT and FFT as shown in table I. Here we take six images of different size and one speech signal. The image of N×M is converted to one dimensional vector of 1× NM before applying the algorithms. The process time is found maximum for DWT (also depends on basis function), minimum for FFT and DCT gives intermediate value. Finally two dimensional operation of DWT, DCT and FFT are compared taking the same images as shown in table II, where the relative performance is found same like table I. The process time of two dimensional operation needs more time compared to one dimensional operation for the image of same size. This can be explain from the architecture of a machine in its internal operation on two dimensional signal or matrix.
Table-I: Comparison of process time of one dimensional transform
Image Size Process Time
In seconds DWT (Symlet)
Process Time In seconds DWT
(Debauches 1)
Process Time In seconds DCT
Process Time In seconds FFT
576×787 0.1250 0.1406 0.0781 0.0313
576×787 0.0938 0.1094 0.0938 0.0313
512×512 0.1250 0.1563 0.1094 0.0469
384×512 0.0781 0.1094 0.0625 0.0313
175×230 0.0781 0.1094 0.0938 0.0313
4001×1 0.0625 0.0625 0.0469 0.0216
266×267 0.0938 0.1094 0.1563 0.0938
Table-II: Comparison of process time of two dimensional transform
Image Size Process Time
In seconds DWT2 (Symlet)
Process Time In seconds
DWT2 (Debauches 1)
Process Time In seconds
DCT2
Process Time In seconds
FFT2
576×787 0.1719 0.1719 0.1656 0.1094
576×787 0.2031 0.1719 0.1488 0.1094
512×512 0.1719 0.1406 0.1575 0.0938
384×512 0.1719 0.1598 0.1631 0.0938
175×230 0.0938 0.1094 0.0938 0.0625
Table III: MSE between original and recovered image
Images MSE of FFT2 MSE of DCT2 MSE of DWT2 Size of image
Lena 0.0035 0.0023 0.0011 512×512
Barbara 0.0190 0.0122 0.0017 576×720
Boat 0.0092 0.0028 0.0010 576×787
Mandrill 0.0485 0.0206 0.0015 266×267
Onion 0.0096 0.0054 0.0015 135×198
Sangsaptak 0.0217 0.0099 0.0013 175×230
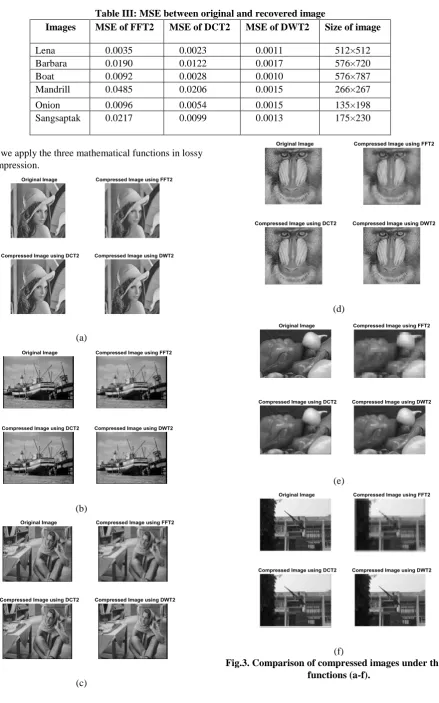
Finally we apply the three mathematical functions in lossy image compression.
(a)
(b)
(c)
(d)
(e)
[image:5.595.89.261.204.730.2](f)
The comparative errors are shown in table III, where DWT2 (Symlet) provides the minimum error and maximum error is found for the case of FFT2. Similar results are also visualized from fig.3, where original image is compared with three compressed images under FFT2, DCT2 and DWT2. The compressed image seems to be the best for DCT2 case at a glance.
VI. CONCLUSIONANDFUTUREWORK
The concept of the paper is applicable in development of real time computer vision model for moving object detection. Here the system will sense the presence of an object using spectrum of the moving image to activate the alarm system. In these case, FFT is found best of all in context of process time. Still we have the scope of include adaptive DWT, where among several wavelet basis functions (i.e. Symlet, Debauches, Mallet etc.), we can choose the best one to optimize the accuracy and process time of object recognition/detection.
REFERENCES
1. Teddy Mantoro and Fifit Alfiah, ‘Comparison methods of DCT, DWT
and FFT techniques approach on lossy image compression,’ 2017 International Conference on Computing, Engineering, and Design (ICCED), 23-25 Nov 2017, Kuala Lumpur, Malaysia
2. Fifit Alfiah, Saepudin, Sutarya, Indra Purnama and Ryan Anggara, ‘Comparison Methods of DCT, DWT and FFT Techniques Approach on Lossy Image Compression,’ International Journal of Computer Techniques, vol. 5, Issue 1, pp.20-24, Feb 2018
3. Hamed Hakkak and Mahdi Azarnoosh, ‘Analysis of lossless
compression techniques time-frequency-based in ECG signal compression,’ Asian Journal of Biomedical and Pharmaceutical Sciences, vol. 9, Issue 66, pp.16-25, Jan 2019
4. Priyanka, R. Bhonde and R. D. Ghongade, ‘A Review Paper on Design
and Simulation Analysis of 32 and 64 Point FFT Using Multiple Radix Algorithm,’ IJCSMC, vol. 5, Issue. 1, pp.198-201, January’ 2016 5. Kavita Tewari and Renu L. Kalakoti, ‘Fingerprint Recognition and
Feature Extraction Using Transform Domain Techniques,’ 2014 International Conference on Advances in Communication and Computing Technologies, 0-11 Aug. 2014, Mumbai, India
6. M. P. Dale and M. A. Joshi, ‘Fingerprint Matching Using Transform
Features,’ TENCON 2008, 2008 IEEE Region 10 Conference, 19-21 Nov. 2008, Hyderabad, India
7. Ravinder Singh, Manish Mathuria, Kailash Rathore, Santosh Kumar, ‘A Robust Color Image Watermarking using Combination of DWT and DCT,’ International Journal of Computer Applications (0975 – 8887), pp.11-14, 4th International IT Summit Confluence 2013.
8. Nawaf Hazim Barnouti, Zaid Saeb Sabri, Khaldoun L. Hameed,
‘Digital Watermarking Based on DWT (Discrete Wavelet Transform) and DCT (Discrete Cosine Transform),’ International Journal of Engineering & Technology, volume 7(4), pp. 4825-4829, 2018 9. Shivang Ghetia, Nagendra Gajjar, Ruchi Gajjar, ‘Implementation of
2-D Discrete Cosine Transform Algorithm on GPU,’ International Journal of Advanced Research in Electrical, Electronics and Instrumentation Engineering, vol. 2, pp. 3024-3030, July 2013 10. Mayura Patrikar and Vaishali Tehre , ‘Design and Power Measurement
of 2 And 8 Point FFT Using Radix-2 Algorithm for FPGA Implementation,’ IOSR Journal of VLSI and Signal Processing (IOSR-JVSP), vol. 7, Issue 1, pp. 44-48, Feb. 2017
11. K. Jayaram and C. Arun, ‘Survey Report for Radix 2, Radix 4, Radix 8 FFT Algorithms,’ International Journal of Innovative Research in Science, Engineering and Technology, vol. 4, Issue 7, pp. 5149-5154, July 2015
12. Aniket Shukla and Mayuresh Deshmukhm, ‘Comparative Study of Various FFT Algorithm Implementation on FPGA,’ vol.1, Issue 1, pp.19-22, November 2012.
AUTHORSPROFILE
Samsunnahar Khandakar is a M.Sc student of Computer Science and Engineering, Jahangirnagar University, Dhaka, Bangladesh. She had completed her B.Sc also (2014-2017) in Computer Science and Engineering, Jahangirnagar University. Her School and College was Jahangirnagar University School and College. She had work on Image processing, Artificial Intelligence and Signal Processing Algorithm. She had also work on Complexity Analysis of Signal Transformation Algorithm. Recently she has been working on Discrete Wavelet Transform and Fuzzy Inference System. Which has been being used for Bangla handwritten numerical character recognition. In B.Sc she had work on various image processing algorithm like Fast Fourier Transform, Discrete Wavelet Transform and Discrete Fourier Transform. She has great interest in Artificial Intelligence.
Jahirul Islam Babar studying in M.Sc. at the Department of Computer Science and Engineering (CSE) of Jahangirnagar University. He has completed his B.Sc. also from the same department of Jahangirnagar University from 2014 to 2017. He has completed his HSC from Dhaka City College under the Board of Dhaka with getting GPA-5.00(out of 5.00) in 2013. He has completed his SSC Hazir Hat Millat Academy under the Board of Comilla with getting GPA-5.00 in 2011. His M.Sc. thesis is about face attribute manipulation using generative adversarial networks. His research interest falls into Image Processing, Machine Learning and Artificial Intelligence.
Anup Majumder received his B.Sc. (Honors) and M.Sc. in Computer Science and Engineering from Jahangirnagar University, Dhaka, Bangladesh in 2014Anup Majumder received his B.Sc. (Honors) and M.Sc. in Computer Science and Engineering from Jahangirnagar University, Dhaka, Bangladesh in 2014 and 2015 respectively. Previously, he worked as a lecturer in the Department of Computer Science and Engineering, Daffodil International University, Dhaka, Bangladesh. Previously, he also worked as a lecturer at the Institute of Information Technology, Noakhali Science and Technology University, Noakhali, Noakhali-3814, Bangladesh. Currently, he is working as a lecturer in the Department of Computer Science and Engineering, Jahanginagar University, Savar, Dhaka-1342, Bangladesh. His research interest is focused on Artificial Intelligence, Machine Learning and Expert System, and Data Mining.
Md. Imdadul Islam has completed his B.Sc. and M.Sc Engineering in Electrical and Electronic
Engineering from Bangladesh University of