Abstract— Most scientific data analysis computations consume voluminous data distributed across multiple geographic locations. Moving this data to computational resources is a standard practice in such data analyses. Several factors preclude this movement of data to computational resources; these factors include the sheer volume of the data, the availability of network bandwidth, and the policies governing the movement of data that have been put in place by the institutions and individuals that own the data in question. To cope with such a scenario, an increasingly appealing choice is to move computations to the data. This is made possible by the fact that increasingly powerful commodity machines make it reasonable to assume that powerful compute capabilities will be available in close network proximity to the data. In this paper, we present an architecture for distributed data analysis, which relies on the notion of moving computations to data. For an important class of scientific applications this approach is especially well-suited.
Index Terms— Collaborative work, Distributed computing, Distributed information systems, Data processing
I. INTRODUCTION
N recent years, there has been an exponential growth in the amount of data processed by the scientific applications. Most of these data is distributed across different geographical locations. For example, many experiments such as CMS and Atlas under the Large Hadron Collider will produce an enormous amount of data, once it is in operation. It is expected to produce tens of Petabytes (PB) of data per year even after multiple layers of online filtrations. These data will be stored in many geographic locations. The Large Synoptic Survey Telescope produces astronomical images reaching about 20 Terabytes (TB) a night. Similarly, large distributed data sets are available in many other domains such as biology, chemistry, seismology, and healthcare. Most data analyses on these data fall into the category of data intensive analysis, where the CPU:IO ratios are well below 10000:1[1].
The state of the art requires moving data to the processing
Manuscript received March 7, 2008. This work was supported by the National Science Foundation's Division of Earth Sciences under Grant EAR-0446610, and the Department of Energy under STTR grant number DE-FG02-
J. Ekanayake is with the Indiana University, Bloomington, IN 47405 USA. (corresponding author to provide phone: 812-855-4810; fax: 812-856-7972; e-mail: jekanaya@ cs.indiana.edu).
S. Pallickara is with Indiana University, Bloomington, IN 47405 USA. (e-mail: [email protected]).
G. Fox is with Indiana University, Bloomington, IN 47405 USA (e-mail: [email protected]).
power to perform various analyses on these distributed data. Many grid technologies focus on building a large computation power by connecting distributed compute resources to a single computation grid. These computation grids provide the necessary flops for today's scientific data analyses. However, the movement of data is inevitable when a large amount of distributed data is processed using the grid technology. Although we use matured high performance file transfer protocols such as GridFTP[2], still, the transfer of large amount of data over wide area networks is not an optimized solution.
Cycle harvesting techniques such as Berkeley Open Infrastructure for Network Computing [3] achieve massive computational power by aggregating the compute time donated by the voluntary participants around the globe. This technique requires the movement of both data and the computation in a more fine grain level, and an analysis takes longer time to complete.
Jim Gray presented a key matrix for various costs associated with moving data over the Internet [4]. He pointed out that the movement of data over a wide area network to a computational resource is only worth if the problem requires more than 100,000 CPU cycles per byte of data.
Apart from the above, some special limitations exist, where the movement of data is constrained due to the rules and regulations of organizations and the countries, which own these data. For example, when performing various data analyses on healthcare related data, the data itself is not allowed to be moved, but only the computed averages.
Amazon.com’s Simple Storage Service(S3) and its Elastic Compute Cloud(EC2) provide a new paradigm for data storage and compute power. However, large data transfers from the S3 storage system to the outside, increase the cost of using S3. The data transfer between the S3 storage system and the EC2 compute cloud is free. By adopting the approach of moving computation to data, and by performing the necessary computations on EC2, the users can eliminate the costly data transfers between S3 and the other compute resources.
According to the above, we believe that this approach-moving computation to data – will allow us to accrue significant performance benefits in processing voluminous, distributed data, as it precludes the necessity of voluminous data transfers by performing the analysis (either entirely or a large portion of it) in a close network-proximity to the data.
The availability of results of data analysis in near real-time is another especially critical feature in domains such as
An Architecture for Composable Scientific Data
Analysis
Jaliya Ekanayake, Shrideep Pallickara, and Geoffrey Fox
meteorology and seismology. This real-time availability of results is also desirable in other domains such as particle physics since it allows physicists to perform multiple analyses until a desired goal is achieved. Scalability is a crucial consideration to support real time or near real-time results.
We are interested in the class of scientific applications where the processing exhibits the composable property. Here, the processing can be split into smaller computations, and the partial-results from these computations merged after some post-processing to constitute the final result. This is distinct from the tightly-coupled parallel applications where the synchronization constraints are typically in the order of microseconds instead of the 50-200 millisecond coupling constraints in composable systems. The level of coupling between the sub-computations is higher than those in the decoupled-model such as the multiple independent sub-tasks in job processing systems such as Nimrod[5].
To delve a little deeper into the composable property, consider a common practice in many particle physics data analyses where the aim is to identify a particular type of events within a collection of millions of events. The result of such analysis would be a histogram of possible events. We can easily break the initial set of events into smaller subsets and run the same analysis software on these subsets concurrently. The resulting histograms can then be combined to produce the final result.
Online retrieval of information from distributed information collections is another example of composable computation. The results obtained from each information collection are communicated to the client application where it merges the results according to their relevance values. Google’s map-reduce framework [6] is also based on the composability property.
When the volume of the data is large, even the tightly coupled parallel applications can withstand looser synchronization constraints. This observation can be exploited to highlight the composable features of the algorithm, and thereby achieve better scalability. We are currently working on enhancing the scalability of a clustering and dimension reduction algorithm[7], implemented using MPI like synchronization. The initial data set is divided into sub data sets, and the program is executed on each data set in a different computer. At the synchronization points, the results are communicated to another set of services, which performs the necessary operations, and post the results back(equivalent to MPI_Allreduce). This will continue until the entire computation is over.
The composable property of an application not only supports better scalability, but also supports moving computation to data. In this paper, we present an architecture for composable scientific data analysis, which utilizes the approach of moving computation to data and also achieve better scalability. Security and fault tolerance are two crucial aspects, which we support in our architecture. Collaboration in data analysis is also a feature of our architecture.
The rest of the paper is organized as follows. Section II discusses the proposed architecture and the core software
components. Section III of the paper discusses the advanced research prototype of the system and section IV presents the initial performance evaluation of our system. Section V discusses the related work in this area of research. We present our conclusions and future work in section VI.
II. ARCHITECTURE
A. Proposed Architecture
Two main features that our architecture supports are: (i) composable data analysis and (ii) collaboration. We expect the data and the computational power used for various analyses can be distributed across many organizations, and hence our architecture should be able to support such settings. These factors define the main functionalities that our architecture should support, namely:
1. Locate data and the computational power available 2. Perform the analysis in a scalable manner
3. Retrieve results/partial results or locations of results 4. Collaborative data analysis
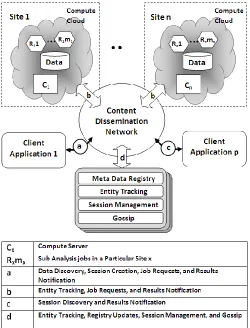
5. Perform the above in secure and fault tolerant manner We derive an architecture capable of performing the above by integrating three key software subsystems. They are: 1. A software system that performs the role of a gateway to
both data and computational resources in a particular domain, and also handles the computation jobs (we call this Compute Server)
2. A content dissemination network as the communication sub system
3. Software component to keep track of the entities, analysis sessions, and the meta data of the entire system.
Fig. 1 shows the architecture of the proposed system with the above software components.
The proposed architecture uses a Compute Server (CX in
Fig. 1) at each remote site where the data and the computational power are available. It can operate at each individual computer or in a head node of a cluster or in a node (or nodes) of a grid-computing infrastructure. The only assumption we made with respect to the Compute Server is that it is in a close network proximity to the data and data is accessible to it.
We use publish/subscribe messaging feature of NaradaBrokering[8] as the main communication mechanism in our architecture. NaradaBrokering is a content distribution infrastructure, and comprises of a distributed network of cooperating broker nodes. It can be used as a message-oriented middleware or as a notification framework. Communication within NaradaBrokering is asynchronous, and the substrate places no constraints on the size, rate, or scope of the interactions encapsulated within events or the number of entities present in the system. In addition, it incorporates support for wide verity of transport protocols making it an ideal communications infrastructure for heterogeneous distributed systems.
data accessible to each Compute Server. We have given complete details of a scalable approach to tracking entities in a distributed system in a secure and authorized manner in [9]. Agents also keep track of the data analysis sessions, and use a gossip protocol to synchronize this information between the agents. Entities in the system use a discovery mechanism to locate agents.
Fig. 1. Architecture of the Proposed Collaborative Data Analysis Framework.
B. Distributed Analysis
At the startup, each Compute Server publishes its availability and the data that it can access to an agent, which starts keeping track of the Compute Server and the data accessible to it. A scientist who needs to perform a distributed data analysis, first, discovers an agent using his/her client application, and then proceeds to locate the Compute Server and the data using the agent. After identifying the necessary data, the scientist creates a data analysis session by specifying the location of the data, the analysis functions, and the configurations such as communication topics over which the results are published. Then the client application constructs the necessary computation job descriptions, and publishes them using NaradaBrokering. The client application also relays this information to the agent to facilitate the collaborative data analysis.
The Compute Servers subscribed to topics receive job descriptions via NaradaBrokering. Once a Compute Server receives a job description, it performs the necessary security constraints, and proceeds to execut the job in a temporary
directory that it created to hold the various data files related to the job. At the end of each job, the Compute Server publishes the output of the job using the messaging substrate. These results are directly received by the client applications where they perform necessary post processing functions such as merging, fitting, and plotting operations.
The client application may not necessarily perform the final post processing functions as stated above. At the start of each analysis, the Compute Servers can be instructed to send the location of the results, instead of the results itself after an analysis job. This way the client application can start another layer of the analysis from these results without moving the data from its original location. This feature of our architecture allows hierarchical data analyses where the analyses are performed in a series of stages.
The scientist can decide the granularity of the analysis jobs by specifying a value for the grouping of data to each sub analysis. This information is used by the Compute Server to start multiple sub analyses (as shown RXMX in Fig. 1) once a
job description is received. The composability nature of the analysis allows this fragmentation where each sub analysis operates on a part of the data. This feature in our architecture improves the overall scalability of the data analyses, and it can utilize the computational power available as a cluster of computers or as many-core architectures better.
The architecture also supports collaboration on sharing results of a particular data analysis among a group of collaborating participants. We have given a complete description of the collaborative aspect of the above architecture in [10] and hence do not describe it here.
C. Security
The above infrastructure spans multiple domains of control, and therefore the security aspect of the framework is an important consideration. We use NaradaBrokering's secure and authorized end-to-end delivery of streams feature [11] to secure the communications between all the entities in our architecture. This ensures that only the authorized entities can discover and publish messages to the topics created within the framework. The analysis job descriptions carry the credentials(a X.501 security certificate) of the scientists who initiate the analysis. A gridmap file, similar to other grid frameworks such as the GlobusToolkit [12], is used at the Compute Servers to map the Distinguished Name of the credential to the user account in the computational resource. This ensures that a particular scientist can only access the data and the computational resources authorized to him/her by the domain.
D. Fault Tolerance
that agent to discover data and Compute Servers available and proceed with the analysis. Having multiple agents prevents the failure of some agents from stopping the function of the entire system. Failure of a Compute Server results an incomplete result set. However, the composability property of the data analysis allows users to restart the analysis in a different instance of the Compute Server for the data files that have not been analyzed. In our current architecture, user intervention is required in selecting a new Compute Server and for restarting the analysis.
III. IMPLEMENTATION
As part of an effort funded by the DoE we are working with the High Energy Physics group at Caltech with their particle physics analysis tool – Clarens, which allows scientists to launch computations related to their analysis, followed by visualization of histograms produced by these computations. ROOT[14] was the data analysis framework for the particle physicist, and the Clarens server also supports execution of data analysis functions written in ROOT.
The goal of the analysis is to execute a set of analysis functions on a collection of data files produced by the high-energy physics experiments. After processing each data file, the analysis produces a histogram of identified features. These histograms are then combined to produce the final result of the overall analysis. The physicists, first, try the analysis functions on the data available locally, and once the analysis functions are fine-tuned, they want the functions to be performed on all the relevant data available. The sheer volume and the distributed nature of the data require a better scalable architecture to perform the above.
We used the above data analysis as our first proof of concept implementation of the proposed architecture, and demonstrated that our system can perform the data analysis in a much more scalable manner while minimizing the movement of data.
Clarens is a grid enabled web service framework, implemented in Python, which supports most common web service protocol stacks comprising HTTP and SOAP/XML-RPC with SSL/TLS encryption and X.509 certificate-based authentication. Although the server implementation of Clarens is Python-based, it provides client libraries for other languages such as Python, Iguana, JavaScript, and most importantly, the C++ based interpreted language (CINT [15]) supported by the ROOT Analysis framework. All the above features make the Clarens an ideal candidate for the Compute Server in our architecture, and hence we decided to use it for this proof of concept.
NaradaBrokering is implemented in Java and it is the main communication medium in our architecture. Therefore, every entity in the architecture should be able to access NaradaBrokering. We developed a C++ API for NaradaBrokering so that it can be accessible from both ROOT and Python (Clarens is implemented in Python) using a set of wrappers. During the first phase of the work, we exclude the implementation of agents, and we are currently working on completing the implementation to comply with the proposed architecture.
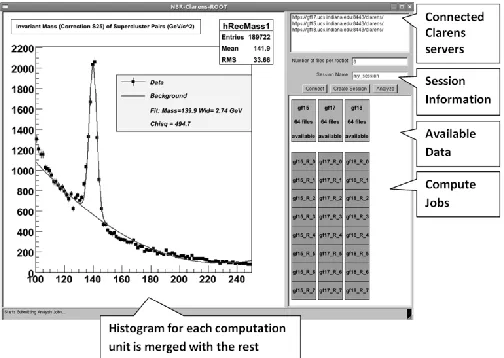
[image:4.612.315.567.188.367.2]Fig. 2 shows a screenshot of the user interface captured during one of our benchmarks. The top right corner of the image shows the available Clarens servers (in this case, there are three). Once a server is located, the user interface displays the number of data files accessible to each Clarens server. Then the user creates a session specifying the number of data files to be grouped into each analysis job (we call them rootlets). At this point, the interface displays the individual analysis jobs under the corresponding Clarens server. Next, the user can proceed to submit these jobs to Clarens servers using the user interface.
Fig. 2. User Interface of Proof of Concept Implementation.
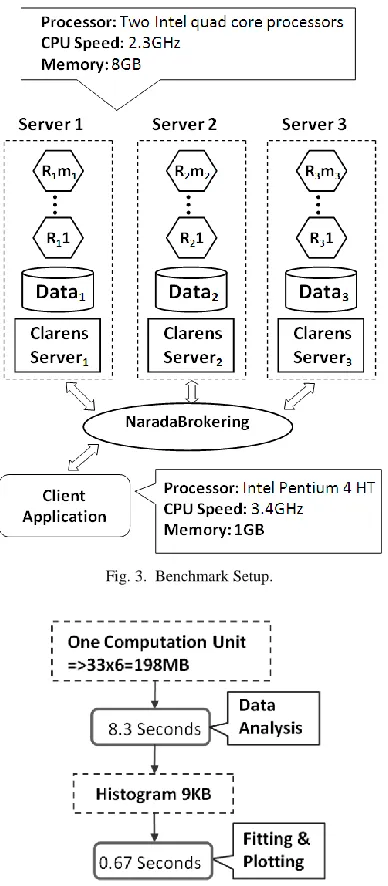
At the end of processing each rootlet, the respective Clarens server notifies the client by publishing the result. Once a result event is received, the user interface performs the necessary post-processing. In our use-case, the size of a single data file is 33MB and we group multiple of these files for a single execution unit (rootlet) for the analysis. The resulting histogram of an analysis job is nearly 9KB in size. Once a histogram is received by the user interface, it merges the histogram with the existing histograms and executes a ―fitting‖ function to fit a curve to the available data, and finally, it updates the current result displayed in the canvas. It also shows the progress of the overall data analysis by changing the color of each compute job shown on the canvas.
IV. RESULTS
We performed several benchmarks to evaluate the scalability of the proof of concept implementation. Fig. 3 shows the benchmark setup we used for all our measurements. We setup three Clarens servers in three different computers, and placed an equal amount (but different data) of data in each computer. Although we placed the data on the computers where the Clarens server are installed, it is not a must. The only requirement in this regard is that the Clarens servers should be able to access the data. We placed nearly 2.11 GB of data in each computer.
performed in the client’s computer.
[image:5.612.320.559.115.271.2]Next, we performed a benchmark to evaluate the scalability of our implementation with respect to a single Clarens server. We measured the total execution time of the analysis by varying the number of sub execution units (rootlets). Fig. 5 shows the results of the above benchmark.
Fig. 3. Benchmark Setup.
Fig. 4. Main Processing Tasks and their Execution Times
The results clearly indicate that the increase in the number of sub analyses reduces the overall data analysis time (bottom line in the graph – Fig. 5). In our use case, each sub analysis produce a histogram of similar size (≈ 9KB in size) irrespective of the amount of data analyzed. Therefore, as we increase the number of sub execution units, the total communication overhead, the job creation overhead, and the post processing costs increase. This is the reason for the shift in the top line (total time) in the graph (Fig. 5).
After measuring the scalability using a single Clarens server, we performed a similar benchmark including all three
servers to simulate a distributed data analysis scenario. The amount of data analyzed is three times larger (≈6.33 GB) than the earlier benchmark. Fig. 6 shows the results of the above benchmark.
[image:5.612.78.272.134.577.2]Fig. 5. Data Analysis Time under Varying Number of Sub Analysis (rootlets) Performed using One Clarens Server (Compute Server)
Fig. 6. Data Analysis Time under varying Number of Sub Analysis (rootlets) Performed in Three Clarens Servers (Compute Server) to Simulate a
Distributed Data Analysis Scenario.
Fig. 6 clearly highlights the scalability in our architecture. Even though the data set we used in this benchmark is three times larger than the previous one, the overall minimum data analysis time is still closer to the minimum value in previous benchmark. As we increase the number of sub analysis, after a certain point, the overhead costs associated with the communication, job creation and the post processing dominates the overall data analysis cost. This is the reason for the upward shift in the top line of the graph in Fig. 6.
The amount of the data transferred between the Client Application and the Clarens servers depends on two factors viz. (i) the size job description (including the data analysis functions) and (ii) the total amount of results generated from the sub analyses. Although the size of the job description does not change with the number of sub analyses performed, as we increase the number of sub analyses, the amount of data transferred as results increases. However, in our use case, the total amount of data transferred between the Client Application and the Clarens servers is less than 1 MB.
[image:5.612.321.561.307.458.2]set of sub analyses may be the input to the next set of sub analyses. Therefore, the amount of data movement is higher than a two-step data analyses. However, by performing a large fraction of the analysis in a close network proximity to the data we can avoid the bulk data transfers using our architecture.
V. RELATED WORK
Most scientific applications can be categorized either as compute intensive or as data intensive applications. Performing the computation in multiple compute resources is the key concept in parallelization, and it is often exploited to achieve better scalability for the application. Many grid infrastructures[16], such as Open Sceince Grid[17] and TeraGrid[18] and also the cycle harvesting techniques such as BOINC, focus on building a large computational power by integrating distributed set of compute resources to a single computation grid. This approach has proven to be very successful in performing large scientific analyses and simulations that require large processing power. However, the above model does not fit best to the second category of scientific applications i.e. the data intensive applications, as the underlying infrastructure requires moving the data to the computational power, which is inefficient, costly in terms of network bandwidth, and sometimes impossible due to rules and regulations.
Our architecture provides a scalable framework for performing data intensive scientific applications that are composable in nature. We do this by adopting the approach – moving computation to data. We assume that the scientist has access to a set of computers, and that these computers are able to access the data needed for the computations. Scientists have continued to prefer this model due to its responsiveness and the ability to launch multiple concurrent experiments while enforcing security constraints.
Google’s map-reduce programming paradigm exploit the composability feature to achieve scalability. Jeffrey Dean and Sanjay Ghemawat discuss the map reduce programming style in detail, and also provide sample use cases relevant to Google’s computation needs such as computing ReverseWeb-Link Graph , performing distributed sorts etc, on the large volume of information collections they have. Rob Pike et al. introduce the programming language Sawzall[19] that is developed in Google to streamline the mapreduce style programming. The Sawzall also provides various library routines specific to the domain of web search related data processing. Google’s mapreduce implementation has the following general characteristics; (i) Data is stored in a distributed file system (Google File System- GFS[20]), (ii) Processing is handled by large clusters of shared nothing commodity nodes, and (iii)Intermediate results are stored locally and their locations are communicated to the required processes. The availability of data in a single file system favors their way of using the above paradigm. However, this assumption does not hold true for the scientific applications processing data distributed across different organizations. In addition, the closed operation (both data and computational
power is available within the organizational boundaries) allows them to relax the security constraints.
Dryad presented by Micheal Isard et al. is a distributed execution engine for coarse grain data parallel applications[21]. It combines the mapreduce programming style with dataflow graphs to solve the computation tasks. Dryad's computation task is a set of vertices connected by communication channels, and hence it processes the graph to solve the problem. Hung-chin Yang et al.[22] adds another phase ―merge‖ to mapreduce style programming mainly to handle the various join operations in database queries. Hadoop[23] is an apache project that support map-reduce style programming.
One observation we made regarding the map reduce paradigm and the composable scientific applications is that the adaptation of a generic programming framework for scientific applications is difficult. The scientific applications have the domain specific constraints in implementing them. For example, the particle physics data analysis we used, is completely implemented in ROOT specific C++ language(CINT), and the post processing functions are embedded in a graphical user interface, again developed using CINT. This observation leads us to place the programming model in our architecture in a very abstract level.
We expect the scientists to implement two functions: first, the Compute Task and the second the Post Processing Function ( or the driver of the remaining analysis). These can simply be some wrapper scripts developed to execute the functions that they have. Both these functions expect a message containing a set of bytes as the input parameter. These messages can be encoded using any scheme preferable to the scientists such as SOAP, JSON[24] etc. In the Compute Function, the scientist program, how the results of the computation are communicated back to the Post processing Function as well. We provide the necessary API for the content dissemination network and the other system configurations. Once a result is received by the Post Processing Function, again as a message, it can decide whether to proceed with another analysis or simply render the results in a GUI. We believe that this approach is much more easier for scientist to adopt than a programming paradigm.
Lei Pan et al. in their paper[25] present an agent based implementation to execute sequential algorithms in much more scalable manner. Their architecture can be used to avoid moving large amounts of data by placing the agents in a close network proximity to the data. However, the paper does not describe how such a setting can be used for processing data distributed across organizational boundaries.
PROOF [26] provides a cluster based scalable solution for analyzing large amount of particle physics data files in parallel. A master node controls PROOF’s analyses. PROOF also supports multi-tier masters. The tree structured master-participant connections may cause a single point of failure where as in the proposed architecture we do not impose any such single point of control over the data analysis. Also the metadata regarding the analysis jobs are maintained by multiple agents. Client can always connect to a different agent if the one that it was connected to fails
technology where Matthew at el. explain how the subtask processing can be exploited using grid technology. However, the document does not explain a possible method to combine the retrieved results by multiple searches. J. Callan [29] discusses the advantages of using multiple databases to retrieve information with a detailed discussion on merging document rankings from multiple results sets from different databases.
N. Yamamoto et al. [30] discuss worldwide parallel and distributed data analysis in the observational astronomical field based on a network shared file system Gfarm. Here the main focus is to allow multiple processors to access data files and their replicas in an efficient manner.
VI. CONCLUSION AND FUTURE WORK
In this paper, we have presented a scalable architecture for composable data analysis tasks. Our architecture adopts the approach -moving computation to data - and thereby minimizes the data movement present in many standard data analyses techniques. The architecture exploits the composable property of the class of data analyses that we are interested, to achieve better scalability by executing the overall analysis as a collection of sub analysis that can be executed concurrently. The proposed architecture is domain-independent, failure resilient, and enforces security constraints such as authorization, integrity and confidentiality. Ultimately, we expect that for the class of applications that have the composable property, this research would make the scientific analysis process faster, collaborative and more efficient. The initial proof of concept implementation provides promising results establishing the claims that we made on scalability and data movement. We are working on completing the implementation with respect to the proposed architecture and also to come with a more general implementation that can be used in other scientific data analysis tasks with minimum modifications. Hierarchical data analysis using our architecture is another area that we are currently working on, and we expect that the knowledge gain in this path will also help us to understand the class of applications and their requirements better and hence allow us to refine the architecture. We also expect this research to extend to a class of applications that use a variant of workflow that satisfies real-time execution constraints [31].
REFERENCES
[1] G. Bell, J. Gray, and A. Szalay, ―Petascale Computational
Systems:Balanced CyberInfrastructure in a Data-Centric World,‖ IEEE Computer, vol. 39, no 1, pp. 110-112, Jan. 2006.
[2] GridFTP,http://www.globus.org/grid_software/data/gridftp.php [3] D.P. Anderson, ―BOINC: A System for Public-Resource Computing and
Storage,‖ GRID 2004, pp. 4-10.
[4] J. Gray, ―Distributed Computing Economics‖, Computer Systems Theory, Technology, and Applications, A Tribute to Roger Needham, A. Herbert and K. Sparck Jones eds., Springer, 2004,pp 93-101.
[5] R. Buyya, D. Abramson, and J. Giddy, ―Nimrod/G: An Architecture for a Resource Management and Scheduling System in a Global
Computational Grid,‖ Proc. 4th Int'l Conf. on High Performance Computing in Asia-Pacific Region (HPC Asia 2000), IEEE CS Press, Los Alamitos, Calif., USA, 2000.
[6] J. Dean and S. Ghemawat, ―Mapreduce: Simplified data processing on large clusters,‖ Proc. OSDI’04: 6th Symposium on Operating Systems. [7] X. Qiu. G. C. Fox, H. Yuan, S. Bae, G. Chrysanthakopoulos, H. F.
Nielsen, ―Parallel Clustering and Dimensional Scaling on Multicore Systems‖, Technical Report at Community Grids Lab Publications, Feb, 2008, http://grids.ucs.indiana.edu/ptliupages/publications/hpcsfeb21-08.pdf
[8] S. Pallickara, G. Fox, ―NaradaBrokering: A Distributed Middleware Framework and Architecture for Enabling Durable Peer-to-Peer Grids,‖ Middleware 2003, pp. 41-61.
[9] S. Pallickara, J. Ekanayake, and G. Fox, ―A Scalable Approach for the Secure and Authorized Tracking of the Availability of Entities in Distributed Systems,‖ IPDPS 2007, pp. 1-10.
[10] J. Ekanayake, S. Pallickara, and G. Fox, ―A Collaborative Framework for Scientific Data Analysis and Visualization,‖ The 2008 International Symposium on Collaborative Technologies and Systems, submitted for publication.
[11] S. Pallickara, M. Pierce, H. Gadgil, G. Fox, Y. Yan, and Y. Huang, ―A Framework for Secure End-to-End Delivery of Messages in
publish/Subscribe Systems,‖ GRID 2006, pp. 215-222.
[12] I. Foster and C. Kesselman, ―Globus: A Metacomputing Infrastructure Toolkit,‖ Proceedings of the Workshop on Environments and Tools for Parallel Scientific Computing, Lyon, France, August 1996.
[13] S. Pallickara, H. Bulut, and G. Fox, ―Fault-Tolerant Reliable Delivery of Messages in Distributed Publish/Subscribe Systems,‖ Proceedings of the 4th IEEE International Conference on Autonomic Computing. [14] ROOT - An Object Oriented Data Analysis Framework,
http://root.cern.ch/
[15] CINT - The CINT C/C++ Interpreter, http://root.cern.ch/twiki/bin/view/ROOT/CINT
[16] I. Foster, C. Kesselman, J. Nick, and S. Tuecke, ―The physiology of the grid: an open grid services architecture for distributed systems integration,‖ 2002.
[17] Open Science Grid, http://www.opensciencegrid.org [18] TeraGrid, http://www.teragrid.org
[19] R. Pike, S. Dorward, R. Griesemer, and S. Quinlan, ―Interpreting the data: Parallel analysis with sawzall,” Scientific Programming Journal Special Issue on Grids and Worldwide Computing Programming Models and Infrastructure," vol. 13, no. 4, pp. 227–298, 2005.
[20] S. Ghemawat, H. Gobioff, and S. Leung, "The Google file system,‖ Symposium on Op-erating Systems Principles, pages 29–43, Lake George, New York, 2003.
[21] M. Isard, M. Budiu, Y. Yu, A. Birrell, and D. Fetterly,
―Dryad:Distributed data-parallel programs from sequential building blocks,‖ European Conference on Computer Systems , March 2007. [22] H. chih, A. Dasdan, R. L. Hsiao, and D. S. Parker, ―Map-reducemerge:
Simplified relational data processing on large clusters,‖ SIGMOD, 2007. [23] Hadoop Project at Apache, http://hadoop.apache.org
[24] JSON -JavaScript Object Notation, http://www.json.org/ [25] L. Pan, L. F. Bic, and M.B. Dillencourt,"Distributed sequential
computing using mobile code: moving computation to data," ICPP2001: 30th International Conference on Parallel Processing, Valencia, Spain, IEEE (2001) 77—86
[26] PROOF – The Parallel ROOT Facility, http://root.cern.ch/twiki/bin/view/ROOT/PROOF [27] GRID IR - GRID Information Retrieval,
http://www.w3c.rl.ac.uk/Euroweb/poster/112/gridir.html
[28] M. J. Dovey,‖ Music GRID: A Collaborative Virtual Organization for Music Information Retrieval Collaboration and Evaluation,‖ In the MIR/MDL Evaluation Project White Paper Collection (2nd ed., pp. 50--52), Champaign, IL: GSLIS.
[29] J. Callan, Distributed information retrieval, In W.B. Croft, editor, Advances in information retrieval, chapter 5, pages 127-150, Kluwer Academic Publishers, 2000.
[30] N. Yamamoto, O. Tatebe, S. Sekiguchi, "Parallel and Distributed Astronomical Data Analysis on Grid Datafarm", Proceedings of 5th IEEE/ACM International Workshop on Grid Computing,2004, pp.461-466, 2004.