TECHNICAL NOTE
Optimizing a PCR protocol
for
cpn
60-based microbiome profiling
of samples variously contaminated with host
genomic DNA
Lisa A Johnson
1, Bonnie Chaban
1,2, John C S Harding
3and Janet E Hill
1*Abstract
Background: The current recommended protocol for chaperonin-60 (cpn60) universal target based microbiome profiling includes universal PCR of microbiome samples across an annealing temperature gradient to maximize the diversity of sequences amplified. However, the value of including this gradient approach has not been formally evalu-ated since the optimization of a modified universal PCR primer cocktail for cpn60 PCR. PCR conditions that maximize representation of the microbiome while minimizing PCR-associated distortion of the community structure, especially in samples containing large amounts of host genomic DNA are critical. The goal of this study was to measure the effects of PCR annealing temperature and the ratio of host to bacterial DNA on the outcome of microbiota analysis, using pig microbiota as a model environment.
Findings: Six samples were chosen with an anticipated range of ratios of pig to bacterial genomic DNA, and univer-sal cpn60 PCR amplification with an annealing temperature gradient was used to create libraries for pyrosequencing, resulting in 426,477 sequences from the six samples. The sequences obtained were classified as target (cpn60) or non-target based on the percent identity of their closest match to the cpnDB reference database, and non-target sequences were further processed to create microbiome profiles for each sample at each annealing temperature. Annealing temperature affected the amount of PCR product generated, with more product generated at higher temperatures. Samples containing proportionally more host genomic DNA yielded more non-target reads, especially at lower annealing temperatures. However, microbiome composition for each sample across the annealing temperature gradient remained consistent at both the phylum and operational taxonomic unit levels. Although some microbial sequences were detected at only one annealing temperature, these sequences accounted for a minority of the total microbiome.
Conclusions: These results indicate that PCR annealing temperature does have an affect on cpn60 based microbi-ome profiles, but that most of the differences are due to differences in detection of low abundance sequences. Higher annealing temperatures resulted in larger amounts of PCR product and lower amounts of non-target sequence ampli-fication, especially in samples containing proportionally large amounts of host DNA. Taken together these results provide important information to guide decisions about experimental design for cpn60 based microbiome studies. Keywords: cpn60, Microbiome profiling, Pig microbiome, PCR conditions, Gradient PCR, Pyrosequencing, Host microbiome
© 2015 Johnson et al. This article is distributed under the terms of the Creative Commons Attribution 4.0 International License (http://creativecommons.org/licenses/by/4.0/), which permits unrestricted use, distribution, and reproduction in any medium, provided you give appropriate credit to the original author(s) and the source, provide a link to the Creative Commons license, and indicate if changes were made. The Creative Commons Public Domain Dedication waiver (http://creativecommons.org/ publicdomain/zero/1.0/) applies to the data made available in this article, unless otherwise stated.
Open Access
*Correspondence: [email protected]
Background
Complex microbial communities play a fundamental role in the health of animals, humans and the environ-ment, and new opportunities to more fully characterize and understand these communities are available due to advances in sequencing technologies. The chaperonin-60 universal target (cpn60 UT, a 549–567 bp segment of the
cpn60 gene) has been demonstrated to be a preferred
barcode sequence for bacteria [1], and an especially
useful target for high resolution microbiome profiling [2–10]. However, this approach, like any other that relies on PCR amplification of a target gene, distorts our view of the true community composition [11, 12].
One parameter of PCR that contributes to amplifica-tion bias is the annealing temperature. Previous work has
indicated that performing the cpn60 UT PCR across a
range of annealing temperatures and pooling the results improves the comprehensive assessment of microbial
diversity of a sample [13]. The current recommended
protocol involves 12 PCR reactions across an anneal-ing temperature gradient for each sample that are
sub-sequently pooled to create a sequencing library [14].
Including a full temperature gradient adds expense and logistical complexity to the protocol, and the importance of this procedure has not been re-evaluated since the development and application of a universal primer cock-tail that improves representation of high G + C content organisms [15, 16], and coincident adoption of new gen-erations of Taq polymerases and other PCR reagents.
Another parameter that may affect how a microbial community is amplified is the ratio of host to microbial genomic DNA. Large proportions of host genomic DNA can interfere with the amplification of cpn60 UT, resulting in non-target amplification. A previous study of the upper respiratory tract of pandemic H1N1 influenza patients demonstrated that samples containing large proportions of human DNA resulted in non-target amplification
origi-nating from the human genome during sequencing [3].
Although comprehensive microbiome profiles were gen-erated, it was with additional, perhaps unnecessary cost due to greater sequencing depth requirements to ensure adequate coverage of the microbiome in the context of large amounts of host genomic DNA.
The goal of this study was to measure the effects of PCR annealing temperature and the ratio of host to bacterial
DNA on the outcome of cpn60-based microbiota
analy-sis using the recommended PCR primer cocktail, and pig microbiota as a model environment.
Methods
Sample collection and DNA extraction
Six samples were collected, five from different anatomical sites within a single pig, and one from an environmental
soil sample. Samples were chosen to represent an antici-pated range of pig to bacterial DNA ratios, from entirely pig to entirely bacterial. Samples were collected from a pig with congenital nasal obstruction, euthanized in an unrelated study designed and conducted in accord-ance with the Canadian Council for Animal Care and approved by the University of Saskatchewan Commit-tee on Animal Care and Supply (Protocol #20130034). Samples collected included a section of brain tissue, a nasal swab, a stomach mucosal scraping, a colon mucosal scraping and feces (collected from rectum). Soil collected from the grounds of the University of Saskatchewan cam-pus, was used as a pig genomic DNA free sample. All samples were stored at −20°C until DNA extraction.
Total genomic DNA extraction was performed on 0.2 g of material from the six samples using a previously described protocol that combines mechanical disrup-tion and chemical extracdisrup-tion [17]. An extraction blank, consisting of ultrapure water, was carried through DNA extraction and sequencing. The DNA concentration of each sample extract was measured by spectrophotome-try, and samples were diluted to a concentration of 10 ng/ μl for PCR.
Quantitative PCR (qPCR)
Quantification of bacterial and pig genomic DNA in each sample was performed by qPCR using the primers as described in Table 1. Estimation of bacterial content was obtained using primers targeting the V1–V3 region the 16S rRNA gene [18] in a qPCR assay described
previ-ously [3], while estimation of pig genomic DNA content
was based on the quantification using the pig alpha actin gene.
All qPCR reactions were performed in duplicate, including a no template control (NTC) and a standard curve, which was prepared with the target-containing plasmids at concentrations of 100–107 copies/reaction.
Each reaction contained 1 × iQ SYBR Green Supermix
(Bio-Rad, Mississauga, ON, Canada), 400 nM of both
forward and reverse primers, and 2 μl of template DNA,
in a final volume of 25 μl. All reactions used the follow-ing program: 95°C for 3 min, 40 cycles of 95°C for 15 s, annealing temperature (Table 1) for 15 s, 72°C for 15 s, and final extension at 72°C for 5 min. A dissociation curve was also run for 81 cycles at 0.5°C increments from 55 to 95°C. PCR was performed on a MyiQ thermocycler (Bio-Rad), and the data was analyzed using iQ5 Optical System Software.
cpn60 universal target PCR and pyrosequencing
Amplification of the UT region of the cpn60 gene was
performed using a primer cocktail consisting of a 1:3
(Table 1). Primers were modified with the addition
of multiplexing ID tags at the 5′ end. Each PCR
reac-tion contained 1 × PCR reaction buffer, 2.5 mM MgCl2,
200 μM dNTP, 800 nM primer cocktail, 2.5 U Platinum
Taq DNA Polymerase (Invitrogen, Burlington, ON, Can-ada) and 2 μl of template DNA, in a final volume of 50 μl. For each sample, four PCR reactions were performed in a thermocycler (Eppendorf Mastercycler) over an anneal-ing temperature gradient with the followanneal-ing program: 94°C for 5 min, 40 cycles of 95°C for 30 s, annealing tem-perature (Table 1) for 30 s, and a final extension of 72°C for 2 min. A NTC and positive amplification control were
included with each gradient. PCR products (5 μl) were
resolved and visualized on a 1% agarose gel by ethidium bromide staining. Products were then purified by aga-rose gel extraction (QIAEX II gel extraction kit, Qiagen, Mississauga, ON, Canada) and suspended in TE buffer [10 mM Tris (pH 8), 1 mM EDTA]. The resulting 28 amplicon libraries were prepared and pooled in equimo-lar concentrations and sequenced using the Roche 454 GS Junior system as per manufacturer’s instructions.
OTU assembly and analysis
Raw pyrosequencing data was processed by using the default on-rig procedures from 454/Roche. Filter-passing reads were used in the subsequent analyses for each of the pyrosequencing libraries. Sequence reads were de-multiplexed and processed to generate operational taxo-nomic units (OTU) with the microbial Profiling Using
Metagenomic Assembly (mPUMA) pipeline [19] using
Trinity for OTU assembly. Processing of sequence reads by mPUMA includes identification and removal of ampli-fication primer sequences and identiampli-fication of putative chimeras using the C3 chimera checker. Watered-BLAST
[20] comparison to the cpnDB_nr reference database
(version 20130321, downloaded from http://www.cpndb.
ca) [21] was used to identify each OTU. Sequences identi-fied as non-target were reference mapped (GS Reference Mapper, Roche, Bradford, CT, USA) to the pig genome
(Sus scrofa, Genbank Accession AEMK01000000) to determine the amount of non-target amplification of pig genome origin. Coverage and Shannon diversity for each library was calculated using Mothur [22]. Principal coor-dinates analysis of jackknifed Bray–Curtis dissimilarity matrices was performed in QIIME [23].
Results and discussion
Genomic DNA extraction and quantification
Estimated copy numbers of pig genomes and bacte-rial genomes were determined by qPCR targeting the pig α-actin or bacterial 16S rRNA genes. Starting quantities were calculated based on interpolation using a standard curve of a ten-fold dilution series of plasmid containing the target sequence. For the α-actin PCR, a linear standard curve was obtained over a range of 102–107 copies per
reac-tion (efficiency 105%, r2 = 0.996). For the 16S rRNA PCR, a
linear standard curve was obtained over a range of 104–107
copies per reaction (efficiency 73%, r2 = 0.955). Based on the
estimate copy numbers, ratios of pig and bacterial genomic DNA were 80:1 (brain), 0.8:1 (nasal), 2.3:1 (stomach), 1.3:1 (colon), 0.0004:1 (feces), and 0:100 (soil) (Table 2).
cpn60 PCR and pyrosequencing
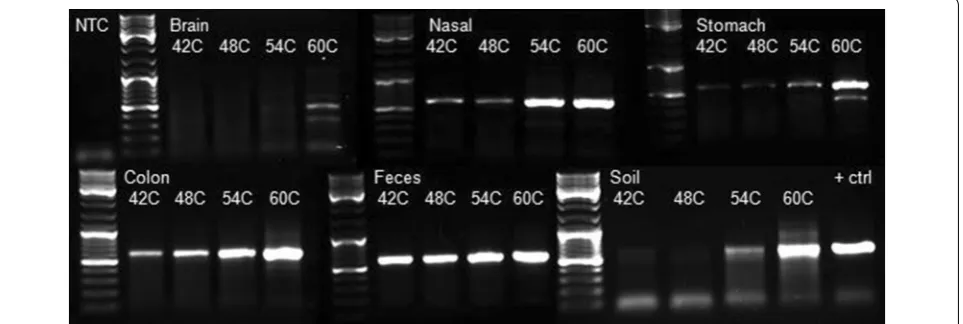
The cpn60 UT PCR products generated for each sample
across the annealing temperature gradient were
visual-ized on an agarose gel (Figure 1). The amount of PCR
product produced varied by sample type and annealing temperature. For all sample types, the amount of PCR product generated increased with higher annealing tem-peratures, indicating that annealing temperature can have a dramatic effect on the amount of PCR product produced. The relationship between annealing
tempera-ture and PCR efficiency is well known [24].
Increas-ing hybridization strIncreas-ingency by elevatIncreas-ing the annealIncreas-ing temperature reduces the occurrence of non-productive annealing events where primers anneal to non-target regions of the template. Although these interactions could lead to primer extension, the resulting products
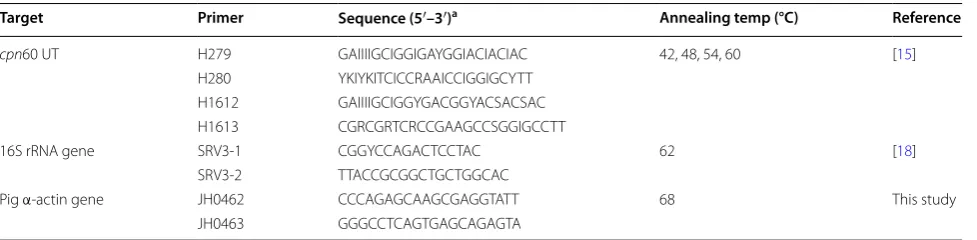
Table 1 PCR primer sequences
a I = inosine, Y = G or T, K = G or T, R = A or G, S = G or C.
Target Primer Sequence (5′–3′)a Annealing temp (°C) Reference
cpn60 UT H279 GAIIIIGCIGGIGAYGGIACIACIAC 42, 48, 54, 60 [15] H280 YKIYKITCICCRAAICCIGGIGCYTT
H1612 GAIIIIGCIGGYGACGGYACSACSAC H1613 CGRCGRTCRCCGAAGCCSGGIGCCTT
16S rRNA gene SRV3-1 CGGYCCAGACTCCTAC 62 [18]
SRV3-2 TTACCGCGGCTGCTGGCAC
[image:3.595.57.546.102.222.2]would be unlikely to participate in further amplification and could interfere with amplification of target regions by providing primer annealing sites.
Sequencing from the 28 libraries resulted in 426,477 high quality reads, with library sizes ranging from 1,707 to 81,128 reads (median 10,124). To facilitate comparison and reduce errors in interpretation due to unequal sam-pling depth [25], libraries were sub-sampled to the size of the smallest library of 1,707 reads. Coverage values for the subsampled pig derived amplicon libraries were >0.94. Coverage for the soil libraries ranged from 0.81 to 0.88, reflecting the greater diversity of these samples (see below). Reads were assembled into OTU and com-pared to the cpnDB reference database for assignment
of nearest neighbour taxonomic labels to cpn60
(tar-get) OTU, and to identify non-target sequences. OTU sequences were classified as target (cpn60) or non-target based on the percent identity of their closest database
match. Our previous experience and analysis of cpn60
reference data in cpnDB has led the establishment of a
cutoff of 55% identity for discrimination of cpn60 and
non-target sequences. Additional file 1 shows the typical, bimodal distribution of percent identity values observed when amplicon libraries include non-target sequences. Detailed analysis of non-target OTU is described below.
OTU identified as cpn60 sequences (1164/2164 OTU
assembled) corresponded to 480 nearest neighbour spe-cies: 380 OTU detected in soil, 104 in colon, 103 in feces, 52 in stomach, 23 in nasal swab, and 36 in brain. A sum-mary of the nearest neighbour species detected in each sample and the number of sequence reads associated with each is given in Additional file 2.
Target and non‑target amplification
OTU with <55% identity to the closest match in the cpnDB reference database were considered non-target and removed from microbiota analysis. Sequence reads contributing to these non-target OTU were screened
Table 2 Quantification of genomic DNA extracted from pig tissue and soil microbiomes
a Quantities reported are the average of duplicates ± standard deviation.
Sample Gene copies per 20 ng DNAa
Pig α‑actin Bacterial 16S rRNA Pig:bacteria DNA ratio
Brain 9.57 × 10⁵ ± 2.75 × 10⁵ 1.20 × 10⁴ ± 1.79 × 10³ 80:1
Nasal cavity 5.65 × 10⁶ ± 7.07 × 10⁴ 6.77 × 10⁶ ± 6.91 × 10⁵ 0.8:1
Stomach mucosa 4.76 × 10⁶ ± 1.23 × 10⁶ 2.04 × 10⁶ ± 1.26 × 10⁵ 2.3:1
Colon mucosa 8.21 × 10⁶ ± 2.58 × 10³ 6.08 × 10⁶ ± 3.30 × 10⁴ 1.3:1
Feces 1.09 × 10⁵ ± 6.21 × 10³ 2.45 × 10⁸ ± 4.79 × 10⁷ 0.0004:1
[image:4.595.56.544.102.213.2]Soil Not detected 3.81 × 10⁵ ± 2.82 × 10⁵ All bacterial
[image:4.595.59.541.254.416.2]against the pig genome to identify non-specific amplifi-cation products of pig origin. Any remaining sequences, likely of microbial origin, were assigned to the category
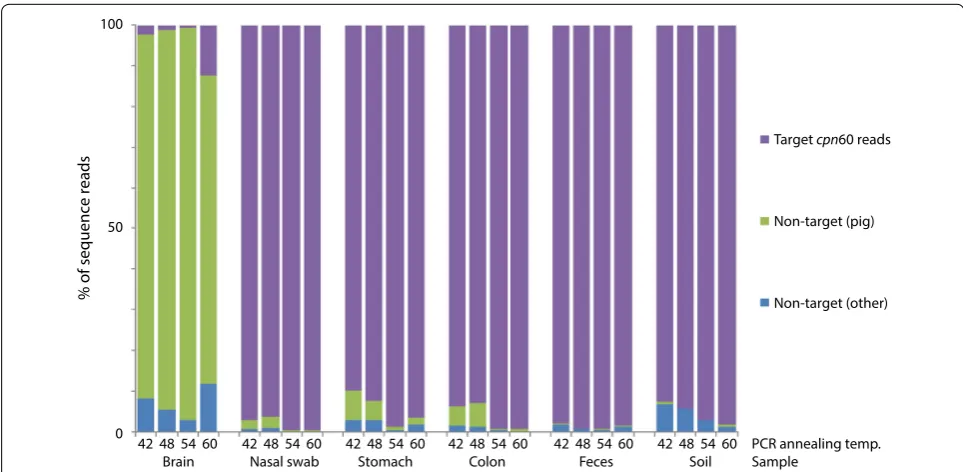
non-target (other origin). The proportions of cpn60
target and non-target (pig and other origin) sequence
reads in each library are shown in Figure 2. The
aver-age target:non-target ratio across the four annealing temperature libraries for each sample were 4:96 (brain), 98:2 (nasal), 94:6 (stomach), 96:4 (colon), 99:1 (feces) and 96:4 (soil). Furthermore, samples containing appreci-able proportions of pig genomic DNA (brain, nasal swab, stomach and colon mucosal scrapings) yielded more non-target reads corresponding to the pig genome, especially at lower annealing temperatures. For example, the brain sample, which was estimated to contain 99% pig genomic DNA, resulted in 89% of the total reads corresponding to non-target pig genome amplification. Alternatively, the nasal and stomach samples, which contained 45 and 70% pig genomic DNA respectively, resulted in 1 and 4% of the total reads to correspond to the pig genome.
The profiles corresponding to the brain sample libraries
contained from 0.8 to 12.3% bacterial cpn60 sequences
(269 reads total) (Figure 2). While some of these sequence reads may originate from the brain tissue, trace contami-nation was detected in the extraction negative and some of these sequences were also detected in the brain librar-ies. Thus, the detection of microbial sequences the brain libraries was at least partially due to contamination of the sample during collection at necropsy, and/or during
laboratory processing. Brain microbial reads were not analyzed further.
There was an observed trend of greater proportions of non-target amplification at lower annealing tempera-tures, especially in samples containing large proportions of host DNA (Figure 2). This finding is consistent with
a previous cpn60 microbiome study where non-target
amplification from samples of the human upper respira-tory tract, containing an order of magnitude more human DNA than bacterial DNA, accounted for up to 85% of the data generated [5].
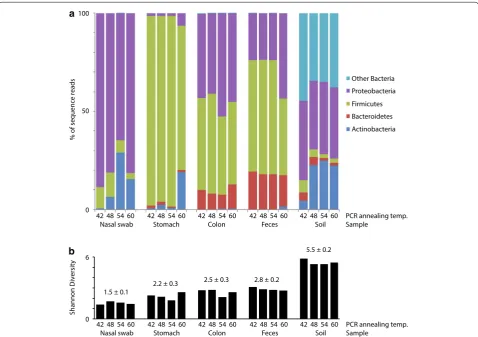
Effect of annealing temperature on phylum level profiles
cpn60 OTU were used to generate phylum level
micro-biome profiles, which were generally consistent within body site, regardless of annealing temperature (Figure 3). The nasal passage libraries were dominated by Proteo-bacteria (average of 4 annealing temperature libraries, 79%), Actinobacteria (13%) and Firmicutes (8%), similar to previous descriptions of the pig tonsil microbiome [26]. The stomach libraries contained mostly Firmicutes (91%), with some Actinobacteria (6%) and Proteobacteria (3%), consistent with the most abundant phyla identified
in the stomach microbiomes of horses [27]. The colon
and feces libraries were dominated by Firmicutes (45 and 53%, respectively), Proteobacteria (46 and 29%), and Bacteriodetes (9 and 18%) as expected based on previ-ous descriptions of these environments [28, 29]. The soil libraries included Proteobacteria (37%), Actinobacteria
% of sequence reads
100
50
0
42 48 54 60 42 48 54 60 42 48 54 60 42 48 54 60 42 48 54 60 PCR annealing temp. Nasal swab Stomach Colon Feces Soil Sample
42 48 54 60 Brain
Target cpn60 reads
Non-target (pig)
[image:5.595.56.538.464.700.2]Non-target (other)
(19%), Bacteriodetes (3%), and Firmicutes (3%), with 38% of the reads belonging to other phyla. Diversity was lowest in the nasal swab libraries (Shannon diversity 1.5 ± 0.1) and highest in the soil libraries (5.5 ± 0.2), and no consistent relationship of annealing temperature and library diversity was observed (Figure 3b).
Effect of annealing temperature on species level profiles To expand on the phylum level comparisons and make a more detailed comparison of the microbial profiles pro-duced across the annealing temperature gradient, we investigated whether different taxa were detected at dif-ferent annealing temperatures. OTU sequences with the same nearest neighbour in cpnDB were combined as nearest neighbour “species” and their abundances com-bined accordingly for this analysis (Additional file 2). At this level, the overall similarity between microbiome profiles generated at different annealing temperatures is also apparent. Figure 4 shows the results of principal coordinates analysis based on Bray–Curtis dissimilarity values for species level microbiome profiles of all samples
and annealing temperatures. Microbiome profiles cluster according to tissue or material of origin, with feces and colon overlapping.
To further understand the relationship between OTU abundance and prevalence in the different annealing temperature libraries we examined the distribution of
individual OTU sequences. Figure 5 shows the number
of nearest neighbour species (left side) and the num-ber of sequence reads associated with OTU (right side) detected at specific annealing temperatures for each sample type. For each sample type, the total number of sequence reads was obtained by combining the sub-sampled libraries for each annealing temperature. The proportion of total species that were detected at all four annealing temperatures ranged from 24.2% (92/380) for soil to 35.3% (36/102) for feces (Figure 5, left). How-ever, when abundance was considered, it was apparent that the majority of sequence reads were associated with OTU that were detected at all annealing tempera-tures (Figure 5, right). For all samples, OTU sequences detected at all annealing temperatures accounted for a
Other Bacteria Proteobacteria Firmicutes Bacteroidetes Actinobacteria
% of sequence reads
100
50
0
42 48 54 60 42 48 54 60 42 48 54 60 42 48 54 60 42 48 54 60 PCR annealing temp.
Nasal swab Stomach Colon Feces Soil
1.5 ± 0.1 2.2 ± 0.3
2.5 ± 0.3 2.8 ± 0.2
5.5 ± 0.2
Shannon Diversit
y
0 6
Sample
a
b
42 48 54 60 42 48 54 60 42 48 54 60 42 48 54 60 42 48 54 60 PCR annealing temp.
[image:6.595.59.538.362.699.2]Nasal swab Stomach Colon Feces Soil Sample
minimum of 83.0% of reads. For example, although 8 species were detected only in the 60°C stomach library, these OTU accounted for only 1.7% of the data. Overall, for the pig microbiomes analyzed, from 86.5% (colon) to 96.4% (nasal swab) of the sequence reads were associ-ated with OTU detected at all annealing temperatures. Interestingly, the proportion of sequence reads associ-ated with OTU detected at all annealing temperatures was noticeably lower for the soil library where these common OTU accounted for only 75.8% of the sequence data, which reflects the greater diversity and more even frequency distribution of OTU in this microbiome rela-tive to the pig associated communities.
Nearest neighbour species could be detected at specific annealing temperatures because they are preferentially amplified at those annealing temperatures, however this was not addressed in our study. An alternative explana-tion is that these OTU were simply so rare in the starting sample that they were only detected sporadically at the sequencing depth used. For example, in the nasal librar-ies, 2/23 OTU were detected at 42, 54 and 60°C but not
at 48°C (Figure 5a, left). However, these OTU account
for only 6/6,828 sequence reads and so it seems plausi-ble that additional sequencing depth in the 48°C library would result in their detection. Indeed, it was observed that for samples where additional sequence reads were available, addition of more sequences into the analysis
[image:7.595.304.539.87.609.2]resulted in detection of more of the rare OTU in more annealing temperature libraries, and thus fewer nearest neighbours being detected only at one annealing temper-ature (data not shown).
Figure 4 Principal coordinates analysis based on Bray–Curtis dis-similarity values. The analysis was based on the average pairwise dissimilarities from 100 jackknifed data sets at a sampling depth of 1,000 reads per sample. Sample of origin and annealing temperature for each microbiome are indicated.
[image:7.595.57.296.443.669.2]Conclusion
The universal cpn60 PCR annealing temperature had
effects on the amount of PCR product produced and the microbiota profiles produced at both phylum and OTU levels. However, the differences observed in profiles were largely due to low abundance sequences, especially in the animal associated microbiomes examined. The amount of non-target amplification was somewhat greater at lower annealing temperatures, but was most prominent for samples containing large proportions of host genomic DNA. OTU uniquely detected at certain annealing tem-peratures were rare, and accounted for a small proportion of microbiota profiles, although this finding was affected by sampling depth. Taken together, these results indicate that the logistically complex and expensive process of including a full temperature gradient in cpn60 amplicon library production may not be necessary, depending on the goals of the experiment. In cases where samples are known to contain large amounts of host DNA, amplifi-cation at the maximum annealing temperature feasible will minimize non-target amplification. However, practi-tioners of cpn60 based microbiome profiling should also consider that if detection of rare OTU is critical to the experimental goals, an annealing temperature gradient may still prove useful to increase the likelihood of captur-ing of all of the microbial diversity present in the environ-ment of interest.
Availability of supporting data The data set support-ing the results of this article is available in the NCBI SRA repository, and is associated with BioProject accession
PRJNA260274, http://www.ncbi.nlm.nih.gov/bioproject/
PRJNA200951.
Abbreviations
OTU: operational taxonomic unit; cpn60: chaperonin-60; UT: universal target; NTC: no template control; mPUMA: microbial Profiling Using Metagenomic Assembly
Additional files
Additional File 1: Title of data: Distribution of percent identities of
cpn60 OTU sequences to their nearest neighbour in the cpnDB reference database. Description of data: The lower distribution (OTU with <55% identity) contains non-cpn60 sequences, largely pig genomic DNA sequences, which were subsequently mapped on to the pig genome for confirmation of their origin. The majority of pig genomic DNA sequences were assembled from the brain tissue sample, which also had the highest ratio of host:bacteria genomic DNA of any of the samples in the study. Manual inspection of OTU sequences with <55% identity but that did not map on to the pig genome indicated that many of them were of bacterial origin (bacterial, non-cpn60 sequences).
Additional File 2: Title of data: Nearest neighbour species detection frequencies. Description of data: The number of sequence reads associ-ated with each nearest neighbour species detected in each sample library are shown.
Authors’ contributions
JEH, JCSH and BC designed the experiment. LAJ and JCSH collected samples. LAJ performed the microbiome sample preparation and data generation. BC performed the qPCR. LAJ and JEH performed the microbiome analysis. LAJ drafted the manuscript. All authors read and approved the final manuscript.
Author details
1 Department of Veterinary Microbiology, Western College of Veterinary Medicine, University of Saskatchewan, Saskatoon, SK S7N 5B4, Canada. 2 Present Address: Department of Life Sciences, Imperial College London, London SW7 2AZ, UK. 3 Department of Large Animal Clinical Sciences, Western College of Veterinary Medicine, University of Saskatchewan, Saskatoon, SK S7N 5B4, Canada.
Acknowledgements
LAJ was supported by an Undergraduate Student Research Award from the Natural Sciences and Engineering Research Council of Canada (NSERC). The authors wish to thank Champika Fernando for technical assistance.
Compliance with ethical guidelines
Competing interests
The authors declare that they have no competing interests.
Received: 3 September 2014 Accepted: 13 May 2015
References
1. Links MG, Dumonceaux TJ, Hemmingsen SM, Hill JE (2012) The chaper-onin-60 universal target is a barcode for bacteria that enables de novo assembly of metagenomic sequence data. PLoS One 7(11):e49755 2. Chaban B, Links MG, Paramel Jayaprakash T, Wagner EC, Bourque DK,
Lohn Z et al (2014) Characterization of the vaginal microbiota of healthy Canadian women through the menstrual cycle. Microbiome 2:23 3. Chaban B, Albert A, Links MG, Gardy J, Tang P, Hill JE (2013)
Charac-terization of the upper respiratory tract microbiomes of patients with pandemic H1N1 influenza. PLoS One 8(7):e69559
4. Links MG, Demeke T, Gräfenhan T, Hill JE, Hemmingsen SM, Dumonceaux TJ (2014) Simultaneous profiling of seed-associated bacteria and fungi reveals antagonistic interactions between microorganisms within a shared epiphytic microbiome on Triticum and Brassica seeds. New Phytol 202(2):542–553
5. Desai AR, Links MG, Collins SA, Mansfield GS, Drew MD, Van Kessel AG et al (2012) Effects of plant-based diets on the distal gut microbiome of rainbow trout (Oncorhynchus mykiss). Aquaculture 350:134–142 6. Schellenberg JJ, Links MG, Hill JE, Dumonceaux TJ, Kimani J, Jaoko W et al
(2011) Molecular definition of vaginal microbiota in East African com-mercial sex workers. Appl Environ Microbiol 77(12):4066–4074
7. Oliver KL, Hamelin RC, Hintz WE (2008) Effects of transgenic hybrid aspen overexpressing polyphenol oxidase on rhizosphere diversity. Appl Envi-ron Microbiol 74(17):5340–5348
8. Pratt DL, Dumonceaux TJ, Links MG, Fonstad TA (2012) Influence of mass burial of animal carcasses on the types and quantities of microorganisms within a burial site. Trans Am Soc Agric Biol Eng 55(6):2195–2212 9. Town JR, Links MG, Fonstad TA, Dumonceaux TJ (2014) Molecular
characterization of anaerobic digester microbial communities identifies microorganisms that correlate to reactor performance. Bioresour Technol 151:249–257
10. Town J, Annand H, Pratt D, Dumonceaux T, Fonstad T (2014) Microbial community composition is consistent across anaerobic digesters processing wheat-based fuel ethanol waste streams. Bioresour Technol 157:127–133
11. Polz MF, Cavanaugh CM (1998) Bias in template-to-product ratios in multitemplate PCR. Appl Environ Microbiol 64(10):3724–3730 12. Ishii K, Fukui M (2001) Optimization of annealing temperature to reduce
13. Hill JE, Seipp RP, Betts M, Hawkins L, Van Kessel AG, Crosby WL et al (2002) Extensive profiling of a complex microbial community by high-through-put sequencing. Appl Environ Microbiol 68(6):3055–3066
14. Schellenberg J, Links MG, Hill JE, Hemmingsen SM, Peters GA, Dumon-ceaux TJ (2011) Pyrosequencing of chaperonin-60 (cpn60) amplicons as a means of determining microbial community composition. Methods Mol Biol 733:143–158
15. Hill JE, Town JR, Hemmingsen SM (2006) Improved template representa-tion in cpn60 PCR product libraries generated from complex templates by application of a specific mixture of PCR primers. Environ Microbiol 8(4):741–746
16. Hill JE, Fernando WMU, Zello GA, Tyler RT, Dahl WJ, Van Kessel AG (2010) Improvement of the representation of bifidobacteria in fecal microbiota metagenomic libraries by application of the cpn60 universal primer cocktail. Appl Environ Microbiol 76(13):4550–4552
17. Dumonceaux TJ, Hill JE, Briggs SA, Amoako KK, Hemmingsen SM, Van Kes-sel AG (2006) Enumeration of specific bacterial populations in complex intestinal communities using quantitative PCR based on the chaper-onin-60 target. J Microbiol Meth 64(1):46–62
18. Lee DH, Zo YG, Kim SJ (1996) Nonradioactive method to study genetic profiles of natural bacterial communities by PCR-single-strand-conforma-tion polymorphism. Appl Environ Microbiol 62(9):3112–3120
19. Links MG, Chaban B, Hemmingsen SM, Muirhead K, Hill JE (2013) mPUMA: a computational approach to microbiota analysis by de novo assembly of OTUs based on protein-coding barcode sequences. Microbiome 1:23 20. Schellenberg J, Links MG, Hill JE, Dumonceaux TJ, Peters GA, Tyler S et al
(2009) Pyrosequencing of the chaperonin-60 universal target as a tool for determining microbial community composition. Appl Environ Microbiol 75(9):2889–2898
21. Hill JE, Penny SL, Crowell KG, Goh SH, Hemmingsen SM (2004) cpnDB: a chaperonin sequence database. Genome Res 14(8):1669–1675
22. Schloss PD, Westcott SL, Ryabin T, Hall JR, Hartmann M, Hollister EB et al (2009) Introducing mothur: open-source, platform-independent, community-supported software for describing and comparing microbial communities. Appl Environ Microbiol 75(23):7537–7541
23. Caporaso JG, Kuczynski J, Stombaugh J, Bittinger K, Bushman FD, Costello EK et al (2010) QIIME allows analysis of high-throughput community sequencing data. Nat Methods 7(5):335–336
24. Rychlik W, Spencer WJ, Rhoads RE (1990) Optimization of the anneal-ing temperature for DNA amplification in vitro. Nucleic Acids Res 18(21):6409–6412
25. Gihring TM, Green SJ, Schadt CW (2012) Massively parallel rRNA gene sequencing exacerbates the potential for biased community diversity comparisons due to variable library sizes. Environ Microbiol 14(2):285–290
26. Lowe BA, Marsh TL, Isaacs-Cosgrove N, Kirkwood RN, Kiupel M, Mulks MH (2012) Defining the “core microbiome” of the microbial communities in the tonsils of healthy pigs. BMC Microbiol 12:20
27. Perkins GA, den Bakker HC, Burton AJ, Erb HN, McDonough SP, McDon-ough PL et al (2012) Equine stomachs harbor an abundant and diverse mucosal microbiota. Appl Environ Microbiol 78(8):2522–2532 28. Hill JE, Seipp RP, Betts M, Hawkins L, Van Kessel AG (2002) Extensive
profiling of a complex microbial community using genomic techniques. In: Canadian Society of Microbiologists 52nd Annual General Meeting. Saskatoon, Saskatchewan
29. Leser TD, Lindecrona RH, Jensen TK, Jensen BB, Moller K (2000) Changes in bacterial community structure in the colon of pigs fed different experi-mental diets and after infection with Brachyspira hyodysenteriae. Appl Environ Microbiol 66(8):3290–3296
Submit your next manuscript to BioMed Central and take full advantage of:
• Convenient online submission
• Thorough peer review
• No space constraints or color figure charges
• Immediate publication on acceptance
• Inclusion in PubMed, CAS, Scopus and Google Scholar
• Research which is freely available for redistribution