City, University of London Institutional Repository
Citation
:
Giaralis, A. and Spanos, P. D. (2009). Determination of design spectrumcompatible evolutionary spectra via Monte Carlo peak factor estimation. Paper presented at the 7th International Probabilistic Workshop (7th IPW), 25th - 26th November 2009, Delft, The Netherlands.
This is the unspecified version of the paper.
This version of the publication may differ from the final published
version.
Permanent repository link:
http://openaccess.city.ac.uk/911/Link to published version
:
Copyright and reuse:
City Research Online aims to make research
outputs of City, University of London available to a wider audience.
Copyright and Moral Rights remain with the author(s) and/or copyright
holders. URLs from City Research Online may be freely distributed and
linked to.
City Research Online: http://openaccess.city.ac.uk/ [email protected]
Determination of design spectrum compatible
evolutio-nary spectra via Monte Carlo peak factor estimation
Agathoklis Giaralis1, Pol D Spanos2
1School of Engineering and Mathematical Sciences, City University, London, UK 2George R. Brown School of Engineering, Rice University, Houston, TX, USA
Abstract: The problem of generating ensembles of artificial non-stationary
earthquake accelerograms compatible with a given (target) response/design spectrum is cast on a stochastic basis. The design spectrum of the European aseismic code provisions (EC8) for various soil conditions and damping ratios is used as a paradigm of a design/target spectrum. The generated accelerograms are construed as realizations of a non-stationary random process; they are char-acterized in the frequency domain by a parametrically defined evolutionary power spectrum (EPS). An appropriate least squared optimization problem is formulated for the determination of the parameters of the EPS. The solution of this problem involves the incorporation of a “peak factor” which is used to re-late the target spectrum to the EPS in a probabilistic context. To this end, a comprehensive Monte Carlo study is undertaken to estimate numerically the statistical properties of the peak factor from appropriately computed popula-tions, and to derive polynomial expressions for the median frequency-dependent peak factors (peak factor spectra). These expressions are used in conjunction with the herein adopted optimization problem to determine EPSs compatible with the EC8 design spectrum. The derived median peak factor spectra yield an excellent level of agreement between the EC8 spectrum and the ensemble average and median response spectra of simulated EPS-compatible ensembles of accelerograms.
1 Introduction
Note that, contemporary code provisions regulating the aseismic design of structures repre-sent the input seismic loads by means of analytically defined response/design spectra (e.g. [4]). This practice allows for considering linear dynamic response-spectrum based types of analyses which significantly facilitates the design of ordinary structures (e.g. [5]). Never-theless, by its definition, a design spectrum neither corresponds to an individual earthquake record associated with a certain seismic event nor to a specific stochastic process. In this respect, design spectra cannot be straightforwardly considered in conjunction with dy-namic time-history analyses which involve the complete knowledge of the acceleration trace (accelerogram) of the motion of the ground. The incorporation of these kinds of analyses is commonly mandated by regulatory agencies in the design of special structures and facilities of critical importance. In this context, aseismic code provisions require the representation of the seismic severity by means of suites of design spectrum compatible accelerograms. That is signals whose average response spectrum is in agreement with a prescribed (elastic) design spectrum satisfying specific “compatibility criteria”. Such ac-celerograms can be derived either by manipulation of field recorded ground motions, or by generation of time-histories belonging to an appropriately defined stochastic process which is consistent with the given design spectrum (see e.g. [7], [25] and references therein).
To this end, various researchers have proposed methods to relate a response/design spec-trum to a power specspec-trum characterizing a stationary stochastic process (e.g. [8]; [17]; [16]). This relation necessitates the consideration of the so-called “peak factor” which is closely associated with the first passage problem of the response of stochastically excited linear single-degree-of-freedom (SDOF) systems (see e.g. [26]). Obviously, assigning a stationary process to a response/design spectrum involves a rather restrictive limitation in dealing with an inherently non-stationary phenomenon (i.e. the strong ground motion dur-ing a seismic event). Nevertheless, a very limited number of research studies have consid-ered the case of relating an evolutionary power spectra (EPS) characterizing a non-stationary random process to a given response/design spectrum. The main difficulty in this case, is that no reliable expressions for the peak factor exists. Certain previous studies (e.g. [10]; [27]; [20]; [11]; [12]) have provided numerical results associated with the peak re-sponse and the first passage problem of linear SDOF systems excited by non-stationary input processes. However, the considered input EPSs have been somewhat arbitrarily se-lected as either modulated white noise, or colored noise having a boxcar envelop function. Obviously, these forms of EPSs have limitations in modelling seismic acceleration proc-esses.
the EC8 spectrum. These are incorporated in the aforementioned formulation to achieve enhanced level of compatibility of the derived artificial accelerograms with the EC8 spec-trum compared to the previous study of GIARALIS and SPANOS [7] which have assumed a constant peak factor value. The level of compatibility is assessed by comparison of the average and the median response spectra of ensembles of the generated artificial signals with the EC8 design spectrum.
2 Theoretical
Background
2.1
Relation of an evolutionary power spectrum to a design spectrum
Let the acceleration process ug(t) of the ground motion due to a seismic event be modelled
as a uniformly modulated non-stationary stochastic process. That is,
( )
( ) ( )
g
u t = A t y t , (1)
where A(t) is a deterministic time dependent envelop function and y(t) is a zero-mean sta-tionary stochastic process. The exponential modulated function [1]
( )
exp 2b A t =Ct ⎛⎜− t⎞⎟
⎝ ⎠ , (2)
is adopted herein to model the non-stationary features of the strong ground motion inten-sity exhibited by typical field recorded seismic accelerograms. The parameter C>0 is pro-portional to the intensity of the ground acceleration process while the parameter b>0 controls the shape of the envelope. Assuming that A(t) varies slowly with time, the process
ug(t) can be characterized in the frequency domain via a two-sided evolutionary power
spectrum (EPS) G(t,ω) given by the expression [18]
( )
( ) ( )
2,
G t ω = A t Y ω . (3)
In the latter equation Y(ω) denotes the power spectrum of the stationary stochastic process
y(t). In this study, the Clough-Penzien (CP) spectrum given by the expression [6]
( )
2 4
2
2 2
2 2 2
2 2
1 4
1 4 1 4
g
g f
g f
g g f
Y
ω ω
ζ
ω ω
ω
ω ζ ω ω ζ
ω ω ω
⎛ ⎞ ⎛ ⎞ + ⎜⎜ ⎟⎟ ⎜⎜ ⎟⎟ ⎝ ⎠ ⎝ ⎠ = ⎛ ⎛ ⎞ ⎞ ⎛ ⎞ ⎛ ⎛ ⎞ ⎞ ⎛ ⎞ ⎜ −⎜⎜ ⎟⎟ ⎟ + ⎜⎜ ⎟⎟ ⎜ −⎜⎜ ⎟⎟ ⎟ + ⎜⎜ ⎟⎟ ⎜ ⎝ ⎠ ⎟ ⎝ ⎠ ⎜ ⎝ ⎠ ⎟ ⎝ ⎠ ⎝ ⎠ ⎝ ⎠ 2 f ω ω (4)
with ω ω≤ b.
is considered, where ωb is a cut-off frequency beyond which Y(ω) attain negligible values
for the influence of the surface soil deposits on the frequency content of the propagating seismic waves via the effective stiffness (ωg) and damping (ζg) parameters. The parameters
ωf and ζf control the properties of the high-pass filter incorporated by the model to suppress
the low frequencies (see also [7]).
Furthermore, consider a linear quiescent unit-mass SDOF system, with ratio of critical vis-cous damping ζn and natural frequency ωn, base-excited by the acceleration process ug(t).
The relative displacement response process x(t) of this system with respect to the motion of its base is governed by the equation
( )
2( )
2( )
( )
;( )
( )
n n n g
x t + ζ ω x t +ω x t = −u t x =x
0 0 =0, (5)
in which a dot over a symbol denotes time differentiation. Focusing on lightly damped systems (i.e. ζn<0.1), the response x(t) is assumed to be a narrow-band process. In this case
the time-evolving variance of the response process x(t) can be replaced by the variance of its amplitude [21]. A reliable expression for the latter quantity reads [22]
( )
2 a t σ( )
(
)
(
) (
)
2 2 0exp 2 exp 2 ,
t
a n n n n
n
t π t G n d
σ ζ ω ζ ω τ τ ω τ
ω
= −
∫
. (6)In the practice of aseismic design of structures often only a relative displacement design spectrum Sd(ωn, ζn) is provided to the designer for the definition of the input seismic
sever-ity. This design spectrum is not related to any specific EPS. Clearly, an “inverse” stochas-tic dynamics problem must be considered to relate an EPS G(t,ω) defined by Eqs. (2)-(4) to a given design spectrum Sd(ωn, ζn). Following SPANOS and VARGAS LOLI [23], this
prob-lem can be formulated by relying on the equation (see also [7])
(
,) (
, , ,)
max{
(
, ,)
}
d n n n n t a n n
S ω ζ =r ω ζ G p σ t ω ζ ,G . (7)
In Eq. (7) the so-called “peak factor” r is the critical parameter establishing the equiva-lence between the given design spectrum Sd and the EPS G to be determined in a statistical
manner (see e.g. [26]). Essentially, it corresponds to the scalar by which one needs to mul-tiply the peak standard deviation of the response amplitude (assumed to be equal to the peak standard deviation of the response process x) attained at some time instant tmax var to
reach a certain peak response level Sd with probability p. In general, the peak factor
de-pends on the properties ζn and ωn of the considered SDOF system and on the EPS of the
input strong ground motion. Further discussion on the peak factor is included in sections 3.2 and 3.3 in light of numerical data obtained from Monte Carlo simulations for input EPSs associated with the design spectrum of the European aseismic code regulations [4].
An approximate point-wise solution of the inverse problem of Eq. (7) can be obtained by minimizing the error [7]
(
)
2 2 1 M j j je S q
=
with
(
( ))
2 , , 1,...,
0 , 1,..., 2
d n j n j
S j
S M
j M M
ω ζ ⎧ = ⎪ = ⎨ = + ⎪⎩
( )
( )( )
( )(
)
(
)
( )(
)
2 2 *2 *
3
2 * *2 *
* exp
, 1,...,
2
2 2 1
2 4 exp , 1,..., 2
j j
n j n j
j j M j M j M j M j M
n n j M j M j M
r C t bt
Y j M
q t bt bt
b t j M M
π
ω ζω
γ γ
ζ ω γ
− − − − − − − − ⎧ − ⎪ = ⎪ ⎪⎪ =⎨ − − − − ⎪ − + − = + ⎪ ⎪ ⎪⎩ ( ) 2
j n n j b
γ = ζ ω −
at a certain set of M natural frequencies {ωn(j)} for j= 1,…,M, where the symbol tj* denotes
the time instant at which the variance 2
( )
a t
σ corresponding to the linear SDOF system with natural frequency ωn(j) is maximized. In all ensuing numerical results, a
Levenberg-Marquardt algorithm with line search (see e.g. [14]) is used to solve the over-determined nonlinear least-square fit optimization problem of Eq. (8) for the unknown parameters C, b, ωg, ζg, ωf,ζf of the herein adopted EPS form.
2.2
Simulation of design spectrum compatible seismic accelerograms
Clearly, an EPS G(t,ω) obtained as discussed in the previous section defines a non-stationary process ug(t) whose realizations achieve a certain level of compatibility with the
given design spectrum Sd. In particular, it is expected that generated non-stationary
time-histories compatible with such an EPS will constitute seismic accelerograms whose re-sponse spectra will lie close to the design spectrum Sd. Such accelerograms can be
numeri-cally generated by first synthesizing stationary discrete-time signals as sampled versions of the continuous-time stochastic process y(t) appearing in Eq. (1). That is,
[ ]
( )
s , 0,1,...,y s = y sT s= N, (9)
with s b
T π
ω
≤ sampling interval
where N should be selected appropriately so that A(NTs) is negligible. Next, these
station-ary records are multiplied individually by the corresponding discrete/sampled version of the envelop function defined in Eq. (2) to obtain the final artificial records with non-stationary intensity as Eq. (1) suggests.
In this study, stationary discrete-time signals y s
[ ]
are synthesized by filtering arrays of discrete-time Gaussian white noise w[s] with a two-sided unit-intensity power spectrum band-limited to ωb through an autoregressive-moving-average (ARMA) filter of orderpseudo-random numbers belonging to a Gaussian distribution with zero mean and variance equal to 2ωb . The aforementioned filtering operation is governed by the difference equation
[ ]
[
]
[
]
1 0
m n
k l
k l
y s d y s k c w r l
= =
= −
∑
− +∑
−, (10)
in which cl (l=0,1,…,n) and dk (k= 1,…,m) are the ARMA filter coefficients. Herein, the
auto/cross-correlation matching (ACM) method is adopted to determine these coefficients so that the power spectrum of the process y s
[ ]
matches the CP spectrum Y(ω) of the proc-ess y[s]. In this manner, the process y s[ ]
can reliably model the process y[s]. The mathe-matical details of the ACM method can be found in [24].It is further noted that the non-stationary artificial records generated as discussed above are further processed to address the issue of baseline correction (e.g. [2]). This is accomplished efficiently by appropriate zero-padding and forward/backward filtering of the records using a standard Butterworth high-pass filter of order 4 and cut-off frequency 0.10Hz [3].
3
Numerical results pertaining to the EC8 design spectrum
For the purposes of this study, a Monte Carlo analysis to estimate the statistical properties of the peak factor r appearing in Eq. (7) associated with the EC8 design spectrum is per-formed [4]. Specifically, CP evolutionary power spectra (EPSs) compatible with the EC8 design spectrum for peak ground acceleration (PGA) of 0.36g (g= 9.81 m/sec2), for three different damping ratios ζn= 2%, 5%, and 8% and for all five soil conditions prescribed by
the EC8 are considered: a total of 15 EPSs. These have been obtained as discussed in sec-tion 2.1 assuming a constant peak factor r= 3 / 4π (see also [7]).
For each of the thus obtained EPSs a suite of 10000 spectrum-compatible non-stationary artificial accelerograms has been generated and base-line adjusted as described in section 2.2. Next, each suite is “fed” to a series of 200 linear SDOF systems with natural periods ranging from 0.02sec to 6sec. The damping ratio of these systems is set to coincide with the value of ζn considered in deriving each of the EPS from the corresponding EC8
spec-trum. For every such system defined by the properties Tn= 2π/ωn and ζn and excited by a
specific suite of accelerograms the response ensembles (x(k)(t); k=1,2,…,10000) are calcu-lated via numerical integration of Eq. (5) [13]. Finally, populations of peak factors (r(k);
k=1,2,…,10000)are computed from the above ensembles as the ratio of the population of peak responses over the maximum standard deviation of the response ensemble. That is,
( )
(
)
( )
(
)
{
}
( )
(
)
(
)
{
2}
max , , ,
, ,
max , , ,
k n n k t n n k n n t
x t T G r T G
E x t T G
ζ ζ ζ = ⎧ ⎫ ⎨ ⎬ ⎩ ⎭ . (11)
derivation of the 15 considered EPSs nor by the value of the constant peak factor 3 / 4π involved in this derivation. However, they do reflect the different spectral contents and effective durations (as controlled by the b parameter of Eq. (2)) of the various G EPSs; certainly they depend strongly on the dynamical properties (Tn, ζn) of the SDOF system
considered.
3.1
Monte Carlo analysis of peak response time instants
In the course of computing the denominator of Eq. (11) two quantities need to be consid-ered. First, is the peak value of the mean square of the response ensembles (equal to the variance since the simulated signals are base-line corrected to have zero mean value). Sec-ond is the time t= tmax var at which this value is attained. Fig. 1 provides plots of both of
these quantities as functions of the natural period of the SDOF systems considered for damping ratio ζn= 5% for the five EC8 soil types. The spectral shapes of the variance (Fig.
[image:8.595.176.436.343.523.2]1(a)) are similar to the EC8 displacement design spectrum (see [4]). And, as more flexible oscillators are considered the maximum response variance is reached at later times.
Fig. 1: Peak variances and time instants tmax var at which these peak values are attained for
the response ensembles pertaining to EC8 spectrum compatible EPSs for PGA= 0.36g reported in [7] (ζn= 5%). Ensemble includes population: 10000.
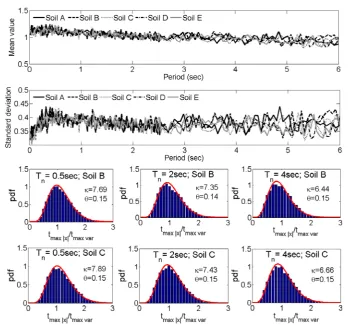
Furthermore, the computation of the numerator of Eq. (11) involves the calculation of the time instants tmax|x| at which the peak value of each response time-history is attained. Fig. 2
shows certain plots associated with the statistical properties of the tmax|x| populations nor-malized by the tmax var time instants for ζn=5%. Specifically, Fig. 2(a) and 2(b) plots the
further elucidate this point, six histograms of such populations related to certain oscillators and the corresponding fitted gamma distributions (solid lines) are shown in Fig. 2. It is reported that in general the gamma distribution yielded the best parametric fitting results based on a standard maximum likelihood estimation algorithm. The gamma distribution of a random variable z reads [15]
(
/ ,)
1( )
1exp z , 0f z κ θ κ zκ z
θ κ θ
− ⎛ ⎞
= ⎜− ⎟
Γ ⎝ ⎠ ≥ (12)
where
( )
( )
1 ,0
exp t t dtκ
κ ∞ −
Γ =
∫
−and κ, θare the “shape” and “scale” parameters, respectively. Similar results as the above have been observed for response ensembles corresponding to ζn=2% and 8% not presented
[image:9.595.116.467.290.615.2]here for brevity.
Fig. 2: Mean value spectra, standard deviation spectra, and histograms of populations of time instants tmax |x| at which the peak response is observed normalized by the time
instants tmax var at which the peak response variance is attained. The considered
response ensembles are the same as in Fig. 1.
3.2
Monte Carlo analysis of peak factors
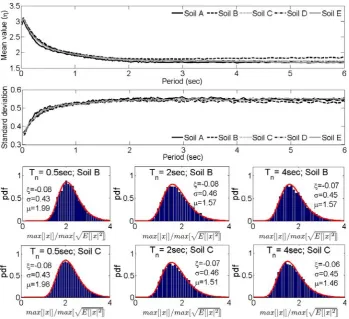
period (median peak factor spectra) for all the EC8 soil conditions and for ζn= 5% are
shown in Fig. 3(a). These spectra possess a significant merit for the purposes of this study. Specifically, when substituted in Eq. (7) the following criterion between a design/response spectrum Sd and an EPS G is established: considering an ensemble of non-stationary
sam-ples compatible with G (i.e. generated as described in section 2.2), half of the population of their response spectra will lie below Sd (i.e. Sd is the median response spectrum).
[image:10.595.131.481.315.634.2]Conse-quently, the probability of exceedance p appearing in Eq. (7) becomes equal to 0.5. Evi-dently, the median peak factor possesses a complicated dependence with the natural period of linear SDOF oscillators. Interestingly, similar trends have been previously reported in the literature (see Fig. 8.17 and 8.18 in [26]). From a practical viewpoint, the most impor-tant conclusion drawn from Fig. 3(a) is that the various shapes of the underlying evolutio-nary power spectrum corresponding to the different EC8 shapes of the design spectrum depending on the soil conditions has a minor effect on the median peak factor spectrum. In other words, the five curves of Fig. 3(a) lie very close to each other. The significance of this observation in practical terms will become clear in the following section.
Fig. 3: Median spectra, standard deviation spectra, and histograms of populations of peak responses normalized by the peak ensemble standard deviation. The considered
response ensembles are the same as in Fig. 1.
been included in Fig. 3 related to certain oscillators and input EPSs. Generalized extreme value distributions given by the equation,
(
/ , ,)
1exp 1 z 1/ 1 z 1 1/f z
ξ ξ
μ μ
ξ σ μ ξ ξ
σ σ σ
− −
⎛ ⎛ − ⎞ ⎞⎛ − ⎞
= ⎜⎜− +⎜ ⎟ ⎟⎟⎜ + ⎟
⎝ ⎠ ⎝ ⎠
⎝ ⎠
−
(13)
where 1 ξ z μ 0 σ
−
+ > ,
have been fitted to these histograms (solid lines). In the above equation and in Fig. 3 μ cor-responds to the “center of mass” of the population, σ is a “spread” factor and ξ is the “shape” factor. Note that in all cases examined the value of parameter ξ is negative. This corresponds to a “type III” extreme value distribution of the Weibull kind [9].
3.3
EC8 compatible peak factor and evolutionary power spectra
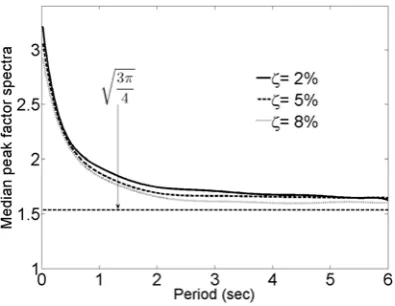
The shape of the median peak factor spectrum is relatively insensitive with respect to the shape of the corresponding evolutionary power spectrum and thus to the shape of the EC8 design spectrum. Thus, it is reasonable to consider the average of these spectral curves for the various soil conditions of EC8 and for each value of the damping ratio herein conside-red. Further, polynomial curve fitting can be applied to the above averaged median peak factor spectra to obtain an analytical expression to approximate the numerically derived median peak factors. The eigth-order polynomials plotted in Fig. 4 and expressed by the equation
( )
80
ˆ j , 0.02 6sec
j j
r T p T T
=
=
∑
≤ ≤ . (14)approximate reasonably well the averaged median peak factor spectra. The coefficients pj
[image:11.595.192.390.542.695.2]of these polynomials are given in Tab. 1.
Tab. 1: Coefficients of the fitted polynomials to the averaged numerically obtained median peak factor spectra from all EC8 defined soil types.
p0 p1 p2 p3 p4 p5 p6 p7 p8
ζ= 2% 3.3079 -4.9375 8.3621 -8.3368 5.0420 -1.8983 0.4469 -0.0639 0.0051
ζ= 5% 3.1439 -3.9836 5.9247 -5.3470 2.9794 -1.0439 0.2305 -0.0311 0.0023
[image:12.595.83.527.632.742.2]ζ= 8% 2.9806 -3.2070 4.1190 -3.1733 1.4746 -0.4144 0.0689 -0.0062 0.0002
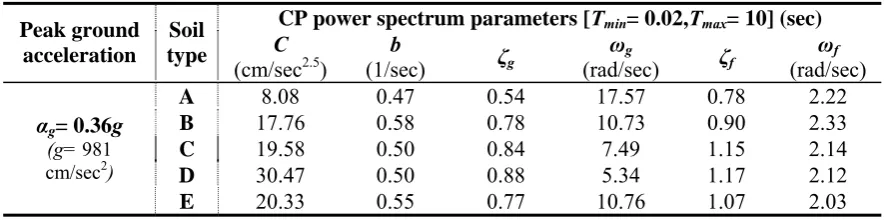
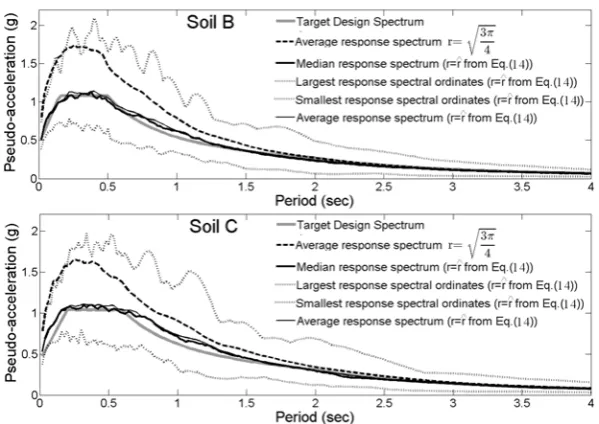
Table 2 shows CP evolutionary power spectra compatible with the EC8 design spectrum for PGA= 0.36g, damping ratio 5% and for all soil conditions obtained by solving the op-timization problem of Eq. (7) using the frequency-dependent averaged median peak factor spectrum of Eq. (14). In Fig. 5 median pseudo-acceleration response spectra for en-sembles of 100 baseline-corrected artificial accelerograms compatible with the CP spectra of Tab. 2 are plotted along with the corresponding target design spectrum. For comparison, average pseudo-acceleration response spectra for ensembles of 100 baseline-corrected arti-ficial accelerograms compatible with CP spectra derived by assuming a constant peak fac-tor equal to
ˆ
r
3 re also included. Clearly, the influence of the peak factor incorpora-ted on the matching of the average response spectra of the artificial signals obtained via solving the stochastic problem of Eq. (7) is quite strong. Evidently, the use of the peak factor of Eq. (14) improves significantly the quality of this matching compared to that a-chieved via the constant peak factor (see also [7]). Furthermore, in terms of pseudo-acceleration spectral ordinates and for the range of natural periods that most of the ordinary structures are designed to withstand seismically induced forces a satisfactory matching is attained for the frequency-dependent peak factor. More importantly, it is noted that the shapes of the prescribed EC8 design spectra for the various soil types exhibit considerable variations. Thus, it is reasonable to argue that the average EC8 peak factor spectrum of Eq. (14) can yield results of similar quality as those of Fig. 5 for target design spectra prescri-bed by other contemporary aseismic code provisions, as well. Obviously, the latter claim warrants further numerical investigation.
/ 4 π , a
Incidentally, the significant discrepancy of the average response spectra obtained under the assumption of a constant peak factor η= 3 / 4π from the target spectrum can be readily justified by considering the deviation of the averaged median peak factor spectrum from the constant level of 3 / 4π shown in Fig. 4.
Tab. 2: Parameters for the definition of CP evolutionary power spectra compatible with
various EC8 design spectra for the frequency-dependent peak factor of Eq. (14).
CP power spectrum parameters [Tmin= 0.02,Tmax= 10] (sec)
Peak ground acceleration
Soil
type C
(cm/sec2.5) (1/sec) b ζg (rad/sec)ωg ζf (rad/sec)ωf
A 8.08 0.47 0.54 17.57 0.78 2.22
B 17.76 0.58 0.78 10.73 0.90 2.33
C 19.58 0.50 0.84 7.49 1.15 2.14
D 30.47 0.50 0.88 5.34 1.17 2.12
αg= 0.36g (g= 981 cm/sec2)
Fig. 5: Pseudo-acceleration response spectra of ensembles of 100 simulated accelerograms compatible with CP evolutionary power spectra derived by assuming a constant
peak factor of 3 / 4π and the frequency-dependent peak factor of Eq. (14).
4 Concluding
Remarks
In this work, an inverse stochastic dynamics approach has been adopted to relate an evolu-tionary power spectrum (EPS) to a given seismic design spectrum. A solution of this prob-lem in an approximate point-wise least-squared sense has allowed for defining a design spectrum consistent EPS characterizing a non-stationary stochastic process. Subsequently, an efficient simulation technique for producing EPS compatible non-stationary time-histories has been employed along with acausal high-pass filtering for adjusting the base-line of the simulated signals. Ensembles of thus generated signals constitute artificial seis-mic accelerograms whose response spectra achieve a certain level of agreement with the design spectrum.
The thus derived median peak factor spectra have been further incorporated in the solution of the aforementioned inverse stochastic problem to yield EC8 consistent EPSs. The achieved level of consistency has been assessed by comparing the average and median populations of response spectra of ensembles of EPS compatible artificial accelerograms. Compared with similar data from a previous study incorporating constant peak factors in the derivation of EC8 compatible EPSs [7], the average and median of the herein generated signals lie significantly closer to the EC8 spectrum. This result establishes the usefulness and practical merit of the reported EC8 compatible median peak factor and evolutionary power spectra for simulating EC8 design spectrum consistent non-stationary accelerograms to be used as input for time-history elastic and inelastic dynamic analyses for the aseismic design of critical structured facilities.
As a final note, and given the enhanced level of consistency of the derived EPSs with the EC8 design spectrum, it is suggested that these EPSs can be further considered as input spectra to perform non-stationary linear and non-linear random vibration analyses for the design of structures regulated by the EC8 provisions. In the non-linear case, the method of statistical linearization can perhaps be employed [19].
5 References
[1] Bogdanoff, J. L.; Goldberg, J. E.; Bernard, M. C.: Response of a simple structure to a random earthquake-type disturbance. Bulletin of the Seismological Society of America, 51 (1961), 293-310.
[2] Boore, D. M.; Bommer, J. J.: Processing of strong-motion accelerograms: needs, op-tions and consequences. Soil Dynamics and Earthquake Engineering, 25 (2005), 93-115.
[3] Boore, D. M.: On pads and filters: Processing strong-motion data. Bulletin of the Seismological Society of America, 95(2005), 745-750.
[4] CEN.: Eurocode 8: Design of Structures for Earthquake Resistance - Part 1: General Rules, Seismic Actions and Rules for Buildings. EN 1998-1: 2004. Comité Européen de Normalisation, Brussels, 2004.
[5] Chopra, A. K.: Dynamics of Structures. Theory and Applications to Earthquake Engi-neering. Prentice-Hall, New Jersey, 2001.
[6] Clough, R. W.; Penzien, J.: Dynamics of Structures. Second Edition. Mc-Graw Hill, New York, 1993.
[8] Kaul, M. K.: Stochastic characterization of earthquakes through their response spectrum. Earthquake Engineering and Structural Dynamics 6 (1978), 497-509.
[9] Kotz, S.; Nadarajah, S.: Extreme Value Distribution.,Theory and Applications. Impe-rial College Press, London, 2000.
[10] Mason, A. B.; Iwan, W.D.: An approach to the first passage problem in random vibra-tion,” Journal of Applied Mechanics, ASME, 50(1983), 641-646.
[11] Michaelov, G.; Lutes, L. D.; Sarkani, S.: Extreme value of response to nonstationary excitation. Journal of Engineering Mechanics, ASCE 127(2001), 352-363.
[12] Morikawa, H.; Zerva, A.: Approximate representation of the statistics for extreme res-ponses of single degree-of-freedom system excited by non-stationary processes. Pro-babilistic Engineering Mechanics 23 (2008), 279-288.
[13] Nigam, N. C.; Jennings, P. C.: Calculation of response spectra from strong-motion earthquake records. Bulletin of the Seismological Society of America 59 (1969), 909-922.
[14] Nocedal, J.; Wright, S. J.: Numerical Optimization. Springer-Verlag, New York, 1999.
[15] Papoulis, A.; Pillai, S.U.: Probability, Random Variables and Stochastic Processes. Fourth Edition. McGraw-Hill, New York, 2002.
[16] Park, Y. J.: New conversion method from response spectrum to PSD functions. Jour-nal of Engineering Mechanics, ASCE 121 (1995), 1391-1392.
[17] Pfaffinger, D. D.: Calculation of power spectra from response spectra. Journal of En-gineering Mechanics, ASCE 109(1983), 357-372.
[18] Priestley, M. B.: Evolutionary Spectra and Non-Stationary Processes. Journal of the Royal Statistical Society. Series B (Methodological) 27(1965), 204-237.
[19] Roberts, J. B.; Spanos, P.D.: Random Vibration and Statistical Linearization. Dover Publications, New York, 2003.
[20] Senthilnathan, A.; Lutes, L.D.: Nonstationary maximum response statistics for linear structures. Journal of Engineering Mechanics, ASCE 117(1991), 294-311.
[21] Spanos, P. D.: Non-stationary random vibration of a linear structure." International Journal of Solids and Structures 14(1978), 861-867.
[22] Spanos, P. D.; Lutes, L. D.: Probability of response to evolutionary process. Journal of the Engineering Mechanics Division, ASCE 106(1980), 213-224.
[24] Spanos, P. D.; Zeldin, B. A.: Monte Carlo Treatment of Random Fields: A Broad Per-spective. Applied Mechanics Reviews 51 (1998), 219-237.
[25] Spanos, P. D.; Giaralis, A.; Jie, L.: Synthesis of accelerograms compatible with the Chinese GB 50011-2001 design spectrum via harmonic wavelets: artificial and historic records. Earthquake Engineering and Engineering Vibrations 8 (2009), 189-206.
[26] Vanmarcke, E. H.: Structural Response to Earthquakes. Seismic Risk and Engineering Decisions. Eds: Lomnitz, C.; Rosenblueth, E. Elsevier, Amsterdam, 1976.
[27] Zembaty, Z: A note on non-sationary stochastic response and strong motion duration.
![Fig. 1: Peak variances and time instants tmax var at which these peak values are attained for the response ensembles pertaining to EC8 spectrum compatible EPSs for PGA= 0.36g reported in [7] (ζn= 5%)](https://thumb-us.123doks.com/thumbv2/123dok_us/1619889.115063/8.595.176.436.343.523/variances-instants-attained-ensembles-pertaining-spectrum-compatible-reported.webp)