City, University of London Institutional Repository
Citation:
Spanos, P. D., Giaralis, A. and Li, J. (2009). Synthesis of accelerograms compatible with the Chinese GB 50011-2001 design spectrum via harmonic wavelets: artificial and historic records. Earthquake engineering and engineering vibration, 8(2), pp. 189-206. doi: 10.1007/s11803-009-9017-4This is the unspecified version of the paper.
This version of the publication may differ from the final published
version.
Permanent repository link:
http://openaccess.city.ac.uk/921/Link to published version:
http://dx.doi.org/10.1007/s11803-009-9017-4Copyright and reuse: City Research Online aims to make research
outputs of City, University of London available to a wider audience.
Copyright and Moral Rights remain with the author(s) and/or copyright
holders. URLs from City Research Online may be freely distributed and
linked to.
Synthesis of accelerograms compatible with the Chinese GB
50011-2001 design spectrum via harmonic wavelets: artificial and historic
records
P.D. Spanos1*, A. Giaralis2 and Li Jie3
1 Professor, L. B. Ryon Chair in Engineering, Rice University, Houston, TX, 77005-1827, USA
2 Post-Doctoral Fellow, Department of Civil and Environmental Engineering, Rice University, Houston, TX, 77005-1827, USA
3 Professor, Institute of Architectural Engineering, Tongji University, Shanghai 200092, China
Abstract: A versatile approach is employed to generate artificial, and to modify field recorded
accelerograms which satisfy the compatibility criteria prescribed by the Chinese aseismic code
provisions GB 50011-2001. In particular, a frequency dependent peak factor derived by means of
appropriate Monte Carlo analyses is incorporated to relate the GB 50011-2001 design spectrum to a
parametrically defined evolutionary power spectrum (EPS). Special attention is focused on the
definition of the frequency content of the EPS to accommodate the mathematical peculiarities of the
aforementioned design spectrum. Further, a one-to-one relationship is established between the
parameter controlling the time-varying intensity of the EPS and the effective strong ground motion
duration. Subsequently, an efficient auto-regressive moving-average (ARMA) filtering technique is
utilized to generate ensembles of non-stationary artificial accelerograms whose average response
spectrum is in a close agreement with the considered design spectrum. Furthermore, a harmonic
wavelet based iterative scheme is incorporated to modify these artificial signals and field recorded
accelerograms pertaining to the May, 2008 Wenchuan seismic event to achieve a close matching of
the signals’ response spectra with the GB 50011-2001 design spectrum on an individual basis.
Zero-phase high-pass filtering is performed to accomplish proper baseline correction of the acquired
spectrum compatible artificial and field accelerograms.
Keywords: design spectrum; Chinese aseismic code; artificial accelerograms; evolutionary power
spectrum; peak factor; recorded accelerograms; wavelets
1 Introduction
The concept of the elastic response spectrum has proven an indispensable tool in describing
the hazard posed by seismic events on structured facilities over several years (Chopra, 2007). In this
regard, the induced seismic loads are typically represented by means of smooth analytically defined
elastic design (response) spectra in the contemporary code provisions for aseismic design of
structures (e.g. GB 50011-2001, 2001; Bommer and Ruggeri, 2002; CEN, 2004; ICC, 2006).
Furthermore, regulatory agencies allow a certain level of structural damage to occur depending on
the severity of the considered seismic action within a performance based design framework. To this
aim, inelastic design spectra of reduced spectral ordinates are utilized to account for the expected
inelastic/hysteretic response of ordinary structures conforming to certain “regularity” criteria in
terms of mass and stiffness distribution in plan and elevation. In this manner, these structures can be
conveniently designed by means of linear response spectrum based equivalent static or dynamic
analyses incorporating proper modal combination rules. These analyses yield the maximum values
of the various quantities of interest to the design process.
Note, however, that explicit consideration of the time-evolving attributes of the structural
response becomes critical in addressing the needs of specific earthquake-resistance design scenarios
of particular structures. Examples of such structures include important to the community
infrastructure that must remain operational after a major seismic event; “irregular” structures;
facilities equipped with various passive and/or active vibration control devices for the mitigation of
the seismic hazard (e.g. base isolators, energy dissipation devices, tuned-mass dampers, etc);
geotechnical engineering constructions. In these cases, aseismic code provisions require dynamic
time-history analyses to be performed. In the context of these analyses, the input seismic action is
represented by ground acceleration time-histories which should generally reflect the characteristics
of the expected strong ground motion in terms of amplitude, frequency content, and duration. To this
end, most code regulations world-wide, require a minimum number of time-histories to be
considered as input for time-history analysis whose average response spectrum is compatible (i.e. in
a close agreement) with a prescribed elastic design spectrum (e.g. Bommer and Ruggeri, 2002).
These time-histories can be “real” recorded accelerograms pertaining to historical seismic events, or
artificial numerically generated signals derived from an appropriate strong ground motion model.
A plethora of methods can be found in the literature to address the issue of providing
response/design spectrum compatible collections of acceleration time-histories for time-history
analyses. A relatively recent class of methods involves selecting accelerograms from well-populated
data banks and scaling by a constant scalar (e.g. Naeim et al., 2004; Kottke and Rathje, 2008).
However, in many instances only a small number of real accelerograms is available to the designer,
hopefully recorded at sites corresponding to similar soil conditions and seismogenetic environments
with those characterizing the site of the structure to be designed. A common approach to achieve
compatibility between the average response spectrum of these accelerograms with a given design
spectrum is to modify them deterministically in the time (e.g. Hancock et al., 2006) or in the
frequency domain (e.g. Karabalis et al., 2000; Mukherjee and Gupta, 2002; Suarez and Montejo,
2005; Suarez and Montejo, 2007; Das and Gupta, 2008). A different approach involves casting the
problem at hand on a probabilistic basis by interpreting the accelerograms as realizations of a
“mother” stochastic process characterized in the frequency domain by its power spectrum. In this
regard, various researchers have considered the derivation of response/design spectrum consistent
stationary power spectra (Gupta and Joshi, 1993; Shrikhade and Gupta, 1996; Falsone and Neri,
and Spanos, 2009) for deriving artificial response spectrum compatible signals via random field
simulation (see also Spanos and Zeldin, 1998). In a similar context, a vast amount of literature has
been devoted to developing “seismological” models amenable to a frequency domain representation
aiming to capture the influence of the seismic fault rupture (source), the seismic waves propagation
(path), and the local soil conditions (site) in the strong ground motion (Lam et al., 2000; Ólaffson et
al., 2001; Boore, 2003). Eventually, random field simulation techniques are utilized to obtain
acceleration time-histories compatible with these models, commonly referred to as “synthetic”
accelerograms (e.g. Lam et al., 2000; Bommer and Ruggeri, 2002). Apart from the above standard
probabilistic approaches for obtaining artificial/synthetic accelerograms to be used in time-history
analysis applications, Iyama and Kuwamura (1999) employed the wavelet transform, Lin and
Ghaboussi (2001) considered properly trained stochastic neural networks, Wang et al. (2002)
utilized the adaptive chirplet transform and Wen and Gu (2004) incorporated the empirical mode
decomposition in conjunction with the Hilbert transform to capture the time-varying frequency
content of recorded earthquakes and to simulate non-stationary strong ground motion signals.
Furthermore, comprehensive lists of earlier research efforts on the topic at hand can be found in the
review articles of Spanos (1983), Preumont (1984), and Carballo and Cornell (2000).
This paper focuses on providing design spectrum compatible accelerograms satisfying the
aseismic code provision requirements posed in China by the code GB 50011-2001. For this task, the
integrated methodology developed in Giaralis and Spanos (2009) is followed since it encompasses
the requisite tools to both generate artificial and manipulate real recorded accelerograms as
mandated by the GB 50011-2001 code.
Specifically, the adopted methodology combines two distinct formulations which are further
extended and tailored herein to accommodate the GB 50011-2001 code. The first formulation
involves the approximate solution of an inverse stochastic dynamics problem to relate a
concept of the “peak factor” (see also Vanmarcke, 1976; Spanos and Vargas Loli, 1985). In this
respect, artificial accelerograms can be generated as samples of the design spectrum-consistent EPS.
An efficient state-of-the-art filtering technique relying on an auto-regressive moving-average
(ARMA) discrete-time filter is utilized for this purpose. Special attention is given to establish a
relationship between the effective strong ground motion duration and the relevant parameter
controlling the time-evolving property of the parametric EPS form. The frequency content of the
latter is defined via the well-known Kanai-Tajimi spectrum (Kanai, 1957), which obviously should
be construed as a purely mathematical instrument. Furthermore, a GB 50011-2001 design spectrum
consistent frequency dependent peak factor is derived via pertinent Monte Carlo simulations.
The second formulation of the adopted methodology utilizes the family of harmonic wavelets
(Newland, 1994) for modifying iteratively individual accelerograms to achieve a close agreement of
their response spectra with a target design spectrum (see also Mukherjee and Gupta, 2002). This
iterative procedure is applied to the artificial signals simulated based on the first formulation to
improve the agreement of their response spectra with the GB 50011-2001 design spectrum on an
individual basis. Furthermore, treatment of real recorded accelerograms by the aforementioned
wavelet-based iterative procedure is also adopted for meeting the compatibility criteria of the GB
50011-2001 code provisions. In particular, a detailed design example is included in which certain
accelerograms recorded during the May, 2008 Wenchuan event are iteratively modified to achieve
enhanced matching of the associated response spectral ordinates with a target spectrum defined in
conjunction with GB 50011-2001.
In all of the aforementioned tasks, appropriate base-line correction is achieved by ad-hoc
acausal zero-phase high-pass filtering.
2 Simulation of artificial spectrum compatible earthquake records
2.1 Adopted parametric non-stationary model for strong ground motion
Consider a sample of a zero-mean separable non-stationary stochastic process represented in
the domain of time t as the product of a deterministic time-dependent envelop function A(t) with a
zero-mean stationary stochastic process y(t); it is meant to model the ground acceleration ug(t) due to
a seismic event, that is,
( )
( ) ( )
g
u t = A t y t . (1)
Assuming that A(t) varies slowly with time, the non-stationary process ug(t) can be characterized by
a two-sided evolutionary power spectrum (EPS) G(t,ω) in the domain of frequency ω given by the
equation (Priestley, 1965)
( )
( ) ( )
2, , b
G t ω = A t Y ω ω ω≤ ; (2)
in this equation Y(ω) denotes the band-limited stationary power spectrum of the stationary stochastic
process y(t), and ωb is the highest frequency of interest. The above model has been used extensively
in the literature to capture the evolutionary attributes of the intensity exhibited by typical recorded
seismic accelerograms pertaining to historic seismic events. That is, an initial period of development
followed by a relatively slow decay in time. Various parametric forms of envelop functions have
been proposed in the literature for the purpose; a comprehensive list can be found in Jangid (2004).
Herein, the exponential modulated function given by the expression (Bogdanoff et al., (1961))
( )
exp 2 b A t =Ct ⎛⎜− t⎞⎟⎝ ⎠ , (3)
is adopted. In Eq. (3), C is a parameter proportional to the intensity of the ground acceleration
process while the b parameter controls the shape of the envelop function. Specifically, it is easy to
max
2 exp(1)
C A
b
= . Furthermore, by considering the time-dependent cumulative energy E(t) of the
process ug(t) given by the equation
( )
(
)
0
,
b b
t
E t G d d
ω ω
τ ω ω τ
−
=
∫ ∫
, (4)and by adopting the effective strong-ground motion duration as defined by Trifunac and Brady
(1975), that is,
95 05
eff
T =t −t , (5)
where
( )
95 0.95(
)
;( )
05 0.05(
)
E t = E t→ ∞ E t = E t→ ∞ , (6)
the following relations are derived by using Eqs. (2)~(4) and (6) (see also Quek et al., 1990):
(
2 2)
(
)
(
2 2)
(
)
95 2 95 2 exp 95 0.1 ; 05 2 05 2 exp 05 1.9
b t + bt + −bt = b t + bt + −bt = . (7)
Clearly, Eqs. (5) and (7) establish a non-linear relationship between the effective duration and the
parameter b. A plot of this relationship is given in Fig. 1, while Fig. 2 includes plots of the envelop
function of Eq. (3) normalized by Amax, and of the corresponding cumulative energy E(t) normalized
by the total energy E(t→∞) for various values of b. It is noted that similar results can be readily
derived by considering any other of the numerous definitions of the effective duration of strong
ground motion found in the literature (see e.g. Bommer and Martínez-Pereira, 1999 and references
therein). It is further pointed out that selecting large values for the b parameter may violate the
“slowly-varying” attribute of the envelop function which must hold for Eq. (2) to be valid. In a
recent work, Politis et al. (2006) verified that Eq. (2) holds within engineering precision for b= 0.5
(Teff= 11s) by employing the adaptive chirplet transform.
In accounting for the frequency content of the ground acceleration process, any of the
various phenomenological (see e.g. Lutes and Lilhanand, 1979; Clough and Penzien, 1993; Falsone
Ólaffson et al., 2001; Boore, 2003) can be used to represent the power spectrum function Y(ω) in Eq.
(2). In this work, the Kanai-Tajimi (K-T) power spectrum (Kanai, 1957) is adopted which has been
widely used in strong ground motion characterization (e.g. Lai, 1982), and in simulation of
earthquake accelerograms (e.g. Conte et al., 1992). Mathematically, it relates to the squared absolute
value of the frequency response function of a single-degree-of-freedom (SDOF) system with ratio of
critical damping ζg and natural frequency ωg. That is,
( )
(
)
(
)
(
)
(
)
2 2
2
2 2 2
1 4 /
,
1 / 4 /
g g
b
g g g
Y ω ζ ω ω ω ω
ω ω ζ ω ω
+
= ≤
− +
, (8)
in which ζg and ωg account for the filtering effects of the surface soil deposits. The choice of the K-T
spectrum has been dictated by the attributes of the analytical expression adopted in the current
Chinese aseismic code provisions (GB 50011-2001) for the definition of the design spectrum (see
the Appendix A). In particular, the last segment of the pseudo-acceleration response spectrum
pertaining to the range of long natural periods yields monotonically increasing relative displacement
spectral ordinates. This trend excludes the incorporation of a high-pass filter in modeling the
frequency content of the ug process which is usually included to suppress low frequency components
allowed by the K-T spectrum (see e.g. Clough and Penzien, 1993; Giaralis and Spanos, 2009).
2.2 Formulation and approximate solution of an inverse stochastic dynamics problem
Consider a linear quiescent unit-mass SDOF oscillator with ζn ratio of critical damping and
ωn natural frequency base-excited by the acceleration process ug(t). The motion of this system is
governed by the equation
( )
2( )
2( )
( )
;( )
0( )
0 0n n n g
x t + ζ ω x t +ω x t = −u t x = x =
, (9)
where x(t) is the relative displacement process of the oscillator with respect to the motion of its base,
design/response (target) spectrum Sd, it is possible to relate it with an EPS G(t,ω) using the equation
(Spanos and Vargas Loli, 1985)
(
,) (
, ,)
max{
(
, , ,)
}
d n n n n t n n
S ω ζ =r ω ζ G σ ω ζt G . (10)
In the above equation, σ is the time-evolving variance of the amplitude of the relative displacement
response process x. It has been proved by Spanos and Lutes (1980) that for lightly damped
oscillators (ζn<<1) excited by relatively broad-band input excitations a reliable expression for the
variance σ is provided by the equation
( )
(
)
(
) (
)
2
2
0
exp 2 exp 2 ,
t
n n n n n
n
t π t G d
σ ζ ω ζ ω τ τ ω τ
ω
= −
∫
. (11)Furthermore, the symbol r in Eq. (10) denotes the so-called “peak factor”: the critical parameter
establishing the equivalence, within a certain probability/ confidence level, between the target Sd and
the EPS G(t,ω) (see e.g. Vanmarcke, 1976). In general, the peak factor depends on the dynamic
properties of the SDOF oscillator considered (ωn, ζn), and on the frequency content and duration of
the input process, but not on the energy/intensity of the excitation. It is closely related to the
first-passage problem in the field of random vibrations for which no exact convenient solution is known.
Several researchers have provided approximate expressions to estimate r for non-stationary input
processes (see e.g. Mason and Iwan, 1983; Michaelov et al., 2001; Morikawa and Zerva, 2008)
obtained under various restrictive conditions to solve the forward problem defined by Eq. (10),
namely to obtain the response spectrum Sd for a given input EPS. However, most of these
expressions tend to be rather involved mathematically and depend on the SDOF system response
statistics, a fact which significantly hinders the solution of the inverse problem of Eq. (10) (i.e. given
an Sd derive a compatible EPS). To circumvent these difficulties, previous related studies have
assumed a constant value for r appropriately selected to provide conservative results, that is,
processes yielding realizations whose average response spectra would lie above the target design
paper, natural frequency dependent peak factors are derived by means of appropriate Monte Carlo
simulations and used in conjunction with Eq. (10) to achieve a closer matching of the response
spectra of samples characterized by the obtained EPS on the average. Further details on this issue
and numerical results are provided in section 5.
A point-wise approximate solution to the inverse problem of Eq. (10) can be obtained, as has
been originally suggested by Spanos and Vargas Loli (1985), which seeks to satisfy Eq. (10) at a
certain set of frequencies {ωn(j)} for j= 1,…,M, in the least square sense. To this aim, a standard
over-determined non-linear least-square fit optimization problem is formulated as follows (see also
Giaralis and Spanos, 2009)
(
)
2 2
1
min M j j j S σ = ⎧ ⎫ − ⎨ ⎬
⎩
∑
⎭, (12)where
( )
(
)
2 , , 1,...,
0 , 1,..., 2
d n j n
j
S j M
S
j M M
ω ζ
⎧ =
⎪ = ⎨
= +
⎪⎩ , (13)
and
( )
( )
( )
( )(
)
(
)
( )
(
)
2 2 *2 *
3
2 * *2 *
*
exp
, 1,..., 2
2 2 1
2 4 exp , 1,..., 2
j j
n j n j
j j M j M j M j M j M
n n j M j M j M
r C t bt
Y j M
t bt bt
b t j M M
π
ω ζω
σ γ γ
ζ ω γ
− − − − − − − − ⎧ − ⎪ = ⎪ ⎪⎪ =⎨ − − − − ⎪ − + − = + ⎪ ⎪ ⎪⎩ , (14) where ( ) 2
j n n j b
γ = ζ ω − . (15)
In Eqs. (12)-(15) the unknowns to be determined are the set of M time instants {tj*} at which the
variance σ corresponding to the oscillator with natural frequency ωn(j) is maximized, the intensity
parameter C, the envelop shape parameter b and the K-T parameters ωg and ζg, while the total
algorithm with line search is utilized (see e.g. Nocedal and Wright, 1999) to solve the optimization
problem defined by Eqs. (12)-(15) at several tenths of points {ωn(j)} along the frequency band of
interest as detailed in section 5.
2.4 On the simulation of artificial earthquake accelerograms using ARMA models
Obviously, by solving Eqs. (12)-(15) for a given target design spectrum complete
determination of the parametrically defined EPS G(t,ω) is achieved. Next, any appropriate random
field generation method can be utilized to synthesize an arbitrarily large number of non-stationary
accelerograms as realizations of the underlying stochastic process ug characterized by the obtained
EPS. Employing a uniformly modulated (separable) EPS allows this task to be performed in a
two-step procedure. In this regard, at first, discrete stationary time-histories compatible with the K-T
spectrum Y(ω) of Eq. (8) are generated. These records can be interpreted as sampled versions of
realizations of the band-limited continuous-time process y
[ ] ( )
s ,y k =y kT k∈], (16)
where the sampling interval Ts must obey the Nyquist criterion to avoid aliasing. Namely,
s b T π
ω
≤ . (17)
Next, these stationary records are multiplied individually by the corresponding discrete/sampled
version of the envelop function defined in Eq. (3) to obtain the final artificial records with
non-stationary intensity as Eq. (1) suggests.
Several methods for generating discrete-time stationary signals compatible with a prescribed
power spectrum are available in the literature. Spanos and Zeldin (1998) have reviewed the most
common of the methods and commented on their main attributes and relative advantages. Herein, a
filtering method incorporating an autoregressive-moving-average (ARMA) model is used for the
(1988); Conte et al., (1992); Ólaffson et al., 2001). The objective of this simulation method is to
“color” a discrete-time Gaussian white noise process w band-limited to ωb possessing the
autocorrelation function Rww and the power spectrum W(ω)
[ ] [ ]
{
}
2 , ;( )
1 ,0 , b
ww b
u v
R E w u w v W
u v ω
ω ω ω
= ⎧
= =⎨ = ≤
≠
⎩ , (18)
in which E{•} is the operator of mathematical expectation by passing it through an ARMA(p,q)
filter. The latter filter has a frequency response function H given by the equation
( )
01 ; 1 1 s s s q li T l
i T l
p
si T s s
c e
H e i
d e ω ω ω − = − = = = − +
∑
∑
. (19)where cl (l=0,1,…,q) and ds (s=0,1,…,p) are appropriate coefficients with d0=1.
In the discrete-time domain the aforementioned filtering operation is governed by the difference
equation
[ ]
[
]
[
]
1 0 p q k l s ly k d y k s c w k l
= =
= −
∑
− +∑
−, (20)
from which it can be readily understood that the k-sample of the output process y of the
ARMA(p,q) model is calculated recursively as a linear combination of the previous p samples plus a
convolution term involving the white input noise.
There are several methods available for determining appropriate ARMA filter coefficients to
match the power spectrum H e
( )
i Tωs 2 of the processywith the K-T spectrum Y(ω). Clearly, if this issuccessfully accomplished, then the process y defined in Eq. (20) can reliably replace/model the
target discrete process y of Eq. (16). Herein, the auto/cross-correlation matching (ACM) method is
utilized (see Spanos and Zeldin, 1998). According to this method, a relatively long pure
autoregressive (AR) filter is defined to model y at an initial stage. Then, the output auto-correlation
model are equated. Finally, the coefficients of the desired ARMA(p,q) filter are determined by
solving a p+q by p+q system of linear equations, where the values of p and q can be chosen at will to
achieve any level of matching between the target spectrum Y(ω) and the squared modulus of the
frequency response function of the ARMA(p,q) filter. The mathematical details of the adopted ACM
method are included in Spanos and Zeldin, (1988).
3 Deterministic iterative response spectrum matching procedure using harmonic wavelets
As it has already mentioned in the introductory section of this paper, a plethora of methods
exists to modify both historic and artificially generated accelerograms deterministically to achieve
enhanced agreement between their response spectra with a target design spectrum. In the case of
recorded accelerograms pertaining to historic seismic events this need stems from the fact that their
response spectra are usually rather irregular and “jagged” compared to the smooth design spectra
corresponding to the same level of intensity/ peak ground acceleration. Moreover, the response
spectra of individual artificial accelerograms generated from procedures as the one described in the
preceding section are not guaranteed to achieve a sufficient level of matching with a given design
spectrum (see also Spanos and Vargas Loli, 1985; Giaralis and Spanos, 2009). To this aim, the use
of harmonic wavelets in conjunction with an iterative numerical procedure proposed by Giaralis and
Spanos (2009) is employed in the ensuing numerical examples to treat both artificially generated and
accelerograms recorded during the Wenchuan earthquake (May, 2008) to enhance the agreement of
their response spectra with the design spectrum prescribed by the Chinese aseismic code provisions
GB 50011-2001 (Appendix A).
Specifically, a harmonic wavelet of (m,n) scale and k position in time ψ(m,n),k(t) is defined in
( ) (
)
(
)
, 1 exp , 0 , o m n i kT m nn m n m
otherwise
ω ω ω ω
ω ω
⎧ ⎛− ⎞ Δ ≤ ≤ Δ
⎪ ⎜⎜ ⎟⎟
Ψ =⎨ − Δ ⎝ − ⎠
⎪ ⎩
, (21)
which corresponds to an ideal band-pass filter. In Eq. (21) m, n, and k are assumed to be positive
integer numbers, and
2
o T
π ω
Δ = , (22)
where To denotes the total length of the time interval considered in seconds. Note that, Newland
(1994) showed via energy preservation arguments that a collection of harmonic wavelets spanning
adjacent non-overlapping bands at different (m,n) scales along the frequency axis constitutes a
complete and orthogonal basis for finite energy functions. Hence, the harmonic wavelet transform
(HWT) expressed in the time domain by the formula
(
)
( )
( , ),( )
0
, ,
o
T
m n k o
n m
W f m n k f t t dt T
ψ − ψ
⎡ ⎤ =
⎣ ⎦
∫
, (23)in which the bar over a symbol denotes complex conjugation, can be utilized to decompose any
real-valued finite energy signal f(t) into sub-signals fm,n(t), so that, (Spanos et al., 2005; Spanos et al.,
2007)
( )
,( )
, m n m n
f t =
∑
f t , (24)where
( )
1(
)
( )
, ( , ),
0
2 Re n m , ,
m n m n k
k
f t − − W fψ m n k ψ t
=
⎧ ⎡ ⎤ ⎫
= ⎨ ⎣ ⎦ ⎬
⎩
∑
⎭. (25)In this respect, the response of a lightly damped SDOF oscillator of natural frequency within
an interval [mjΔω,njΔω] excited by an accelerogram f(t) would be mainly influenced by the fmj,nj(t)
part of the f(t) signal. Thus, an iterative modification procedure can be devised to scale all
( )
( )
( )( )
( )
( )( )
1 , , n dv v m
m n m n n
v
m
S d
f t f t
D d ω ω ω ω ω ω ω ω Δ + Δ Δ Δ =
∫
∫
(26)to improve the agreement of the response spectrum of an accelerogram f(t) with a target spectrum Sd.
In Eq. (26), D(v)(T) denotes the displacement response spectrum related to f(v)(t) obtained by Eq. (24)
at each iteration.
From a numerical implementation perspective, the fast Fourier transform based algorithms
presented in Newland (1998) can be employed for the efficient computation of the convolution
integral of Eq. (23) in the frequency domain. Moreover, a sufficient number of [mΔω, nΔω] “bins”
need to be considered to cover all frequencies of interest. A related detailed discussion along with
numerical evidence on the impact of the length of these bins on the efficiency of the above described
iterative procedure can be found in Giaralis and Spanos (2009). In general, it is noted that harmonic
wavelets offer certain computational advantages over the wavelet families considered by Mukherjee
and Gupta (2002) and Suarez and Montejo (2005), in the context of similar iterative procedures
advocated in these references, especially when enhanced agreement is mandated only at a certain
band of frequencies (Giaralis and Spanos, 2009). Notably, this is the case of the compatibility
criteria prescribed by aseismic code provisions currently effective in Europe (CEN, 2004) and in the
United States (ICC, 2006).
4 Acausal high-pass filtering for baseline adjustment
It can be readily seen form Eq. (8) that the K-T spectrum does not vanish as ω→0 and thus
allows low-frequency components in the acceleration time-histories which results in abnormalities
in the displacement traces and in the corresponding relative displacement response spectra (e.g.
Clough and Penzien, 1993; Giaralis and Spanos, 2009). Thus, it is necessary to treat the
relatively low cut-off frequency to suppress these low frequency components (see also Chopra and
Lopez, 1979; Conte et al., 1992; Karabalis et al, 2000). In essence, this can be interpreted as a
base-line correction operation which also constitutes an important step in processing raw recorded
seismic signals (Boore and Bommer, 2005). Furthermore, similar baseline correction considerations
are necessitated in dealing with the accelerograms scaled/modified by the iterative procedure
described in the previous section (Montejo and Suarez, 2007; Giaralis and Spanos, 2009). To this
aim, high-pass acausal filtering incorporating a fourth order Butterworth filter with cut-off
frequency of 0.10Hz is performed to address the needs for baseline adjustments in both the
artificially generated and real recorded accelerograms considered in the following section (Converse
and Brady, 1992). Specifically, zero-padding of sufficient length is first introduced before the start
and at the end of each accelerogram to provide sufficient time length for the expected end-effects of
the acausal filtering to be rectified (Boore, 2005). Next, the thus padded accelerograms are filtered
in the forward direction using the aforementioned filter. The filtered signals are then reversed in
time and pass through the same filter for a second time. In this manner, zero-phase filtering is
accomplished which minimizes the impact of the properties of the filter considered on the shape of
the displacement time-histories and the long period response spectral ordinates (Chopra and Lopez,
1979; Boore and Akkar, 2003). The latter is an important advantage of the adopted baseline
correction technique since it practically has insignificant effect on the quality of spectral matching
achieved via the wavelet-based modification procedure (Giaralis and Spanos, 2009).
5 Application to the design spectrum of the current Chinese aseismic code: GB 50011-2001
5.1 Derivation of non-constant peak factors via Monte Carlo simulations
In formulating the stochastic simulation problem of section 2.2 a response spectrum has been
related to a non-stationary stochastic process via Eq. (10) by considering the concept of the peak
over the maximum response variance of a SDOF system subject to a non-stationary random process
ug characterized by the EPS G in the frequency domain (see also Eq. (9)). In this regard, Eq. (10)
establishes the following compatibility criterion between a design/response spectrum Sd and an EPS
G: considering an ensemble of non-stationary samples compatible with G (i.e. generated as
described in section 2.4), half of the population of their response spectra will lie below Sd (i.e. Sd is
the median response spectrum).
Relying on this interpretation of the peak factor, it is possible to estimate r corresponding to
a SDOF with ratio of critical damping ζn and natural period Tn= 2π/ωn excited by a specific EPS G
numerically by relying on the equation
(
)
{
{
(
)
}
}
(
)
{
}
{
2}
max , , , , ,
max , , ,
n n t
n n
n n t
E x t T G r T G
E x t T G ζ ζ
ζ
= . (27)
For a fixed damping ratio ζn and input EPS the above equation yields the so-called average (median)
peak factor spectrum (r-spectrum) (Vanmarcke, 1976).
To this end, a Monte Carlo analysis is undertaken to derive natural period dependent peak
factors pertaining to the Chinese aseismic code provisions (GB 50011-2001), for ζn= 0.05. In
particular, evolutionary K-T spectra are obtained for all 14 possible values of the characteristic
period Tg (see the Appendix A), by solving the optimization problem defined by Eqs. (12)~(15) .
Specifically, a point-wise matching is pursued at 70 frequencies ωn(j) judicially distributed onto the
interval [max{2π/(6.5Tg), 2π/(6)}, 314.16] (rad/s) which is mapped onto the interval [0.02,
min{6.5Tg, 6}] (s) on the axis of natural periods (see also Giaralis and Spanos, 2009). For these
analyses αmax is set equal to 0.50g, and a constant peak factor r= (3π/4)1/2 is assumed. For each of the
thus derived spectra a suite of 10000 spectrum-compatible non-stationary artificial accelerograms is
generated and base-line adjusted as described in sections 2.4 and 4. Next, the responses of a series of
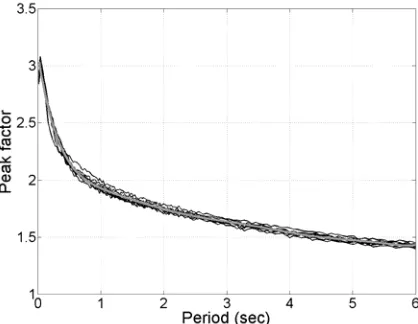
damping ratio excited by the above suites of accelerograms are calculated through Eq. (9). Figure 3
shows all individual r-spectra pertaining to the thus obtained responses computed via Eq. (28) (thin
black lines). Clearly, each such spectrum is associated with a GB 50011-2001 design spectrum of a
specific shape controlled by the Tg parameter. Evidently, the peak factor has a complex dependency
with the natural period of linear SDOF oscillators. Interestingly, similar trends for r-spectra derived
from stationary K-T input processes have been previously reported in the literature (Vanmarcke,
1976). In passing, it is pointed out that the ratio defined in Eq. (28) is independent of the intensity of
the input process considered. Hence, the derived r-spectra of Fig. 3 are not influenced by the
constant value of the peak factor and the value of αmax adopted to obtain the GB 50011-2001 design
spectrum compatible K-T spectra considered in the aforementioned Monte Carlo simulations.
Arguably, the most important conclusion deduced from Fig. 3 is that the r-spectra are
relatively insensitive to the shape of the GB 50011-2001 design spectrum since they are closely
clustered for all natural period considered. In this regard, it is reasonable to fit a polynomial in the
least square sense to the average of the numerically derived r-spectra curves. In this manner, an
analytic expression for a GB 50011-2001 design spectrum compatible peak factor spectrum is
reached which does not dependent on the Tg parameter. Specifically, the eighth-order polynomial
superimposed in Fig. 3 (thick gray curve) and expressed by the equation
(
)
80
, 0.05 j, 0.02 6s
n j
j
r T ζ p T s T
=
= =
∑
≤ ≤ (28)is found to approximate satisfactorily the average peak factor spectrum. The polynomial coefficients
pj are reported in Table 1. Clearly, the peak factor spectrum of Eq. (28) can be incorporated in Eq.
(14) to obtain EPSs compatible with the various shapes of the GB 50011-2001 design spectrum as
5.2 Design spectrum compatible evolutionary K-T spectra and artificial accelerograms
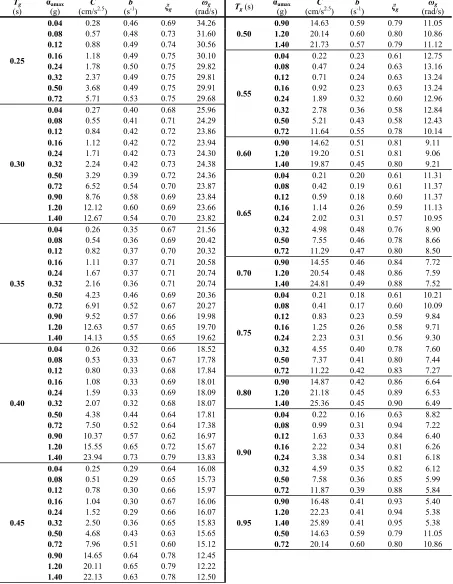
Table 2 shows the requisite parameters for the determination of evolutionary K-T spectra
compatible with the GB 50011-2001 design spectrum for all possible combinations of the quantities
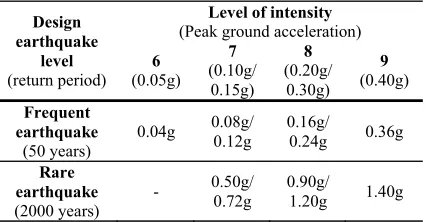
Tg and αmax (Appendix A).Both design levels corresponding to the “frequent” earthquake event
(return period of 50 years) and to the “rare” earthquake event (return period of 2000 years) are
considered. These spectra have been derived by solving the minimization problem of Eqs. (12)~(15)
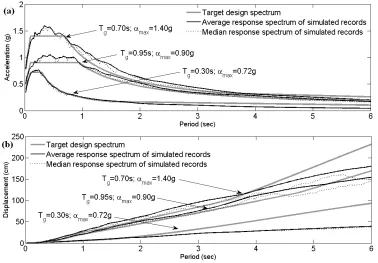
and incorporating in Eq. (14) the natural period dependent peak factor of Eq. (29). Figure 4 provides
examples of the quality of the point-wise matching on the interval [0.02, min{6.5Tg, 6}] (s) achieved
for various values of Tg and αmax in terms of the relative displacement and pseudo-acceleration
spectral ordinates. Furthermore, Fig. 5 shows the average and median response spectra of ensembles
of non-stationary seismic accelerograms compatible with the same K-T spectra considered in Fig. 4.
Each ensemble includes 40 signals generated by means of the ARMA method discussed in section
2.4 and baseline adjusted via high-pass filtering as described in section 4.
Examining the results presented in Fig. 4, it is clear that the adopted parametric model
(evolutionary K-T) does not include enough “degrees of freedom” (i.e. number of free parameters)
to allow the optimization algorithm to trace the GB 50011-2001 design spectrum throughout the axis
of natural periods with the same effectiveness. Better point-wise matching can be accomplished via
models encompassing more degrees of freedom such as the one adopted in Spanos and Vargas Loli
(1985) involving the superposition of more than one uniformly modulated K-T spectra (see also
Falsone and Neri (2000) and Crespi et al., (2002) who considered a simpler stationary version of the
problem at hand). However, these models yield non separable evolutionary processes for the
characterization of strong ground motion whose complexity may limit their practical merits.
Furthermore, it is noted that improved matching between the target spectrum and the obtained
spectral ordinates computed via Eq. (10) for a given EPS G (forward problem), does not necessarily
compatible accelerograms with the target spectrum, especially for a relatively low number of
generated accelerograms. In fact, the achieved agreement of the average response spectra of the
generated accelerograms compatible with the simple evolutionary K-T models is certainly
acceptable by common engineering criteria in the range of periods shorter than 5Tg as evidenced by
Fig 5. In general, it is perhaps more practical to pursue an improved agreement via deterministic
treatment of the generated signals using, for instance, the continuous wavelet transform as described
in the next section, rather than by utilizing more sophisticated parametric expressions for the EPS.
Another issue that deserves further comments is the poor agreement of the average response
spectra of the generated base-line corrected accelerograms with the target design spectrum under
consideration. This is due to the fact that the K-T spectrum cannot capture the relatively slow linear
rate of decay of the last segment of the GB 50011-2001 pseudo-acceleration design spectrum. In
fact, it is noted that the optimization algorithm fails to converge to physically meaningful K-T
parameters if the interval of point-wise matching is stretched to include periods longer than
approximately 6.5Tg. To this end, it is pointed out that although no reference is made in GB
50011-2001 about the relative displacement design spectrum and its shape, the assumption of linearly
decaying pseudo-acceleration spectral ordinates in the range of long periods yields monotonically
increasing spectral ordinates in terms of relative displacements as the stiffness of the linear SDOF
oscillators decreases. This trend deviates somewhat from what is prescribed in other contemporary
aseismic code provisions such as the European EC8 (CEN, 2004) and from what is observed in
recorded accelerograms (e.g. Faccioli et al., 2004), and perhaps it deserves additional scrutinizing.
Moreover, it does not allow the consideration of more sophisticated phenomenological models such
as the Clough-Penzien spectrum (Clough and Penzien, 1993; Giaralis and Spanos, 2009),which
provide a more reliable characterization of the strong ground motion in the range of low-frequencies
Parenthetically, it is noted that the formulation of section 2.2 allows for choosing a shape
parameter b a priori to achieve a desirable effective duration in the generated artificial
accelerograms by solving numerically Eqs. (5) and (7) or by using the graph of Fig. 1. Then, b can
be treated as a constant, instead of a free parameter, and be left out of the optimization problem of
Eqs. (12)~(15). This feature further enhances the versatility of the proposed stochastic method and
can significantly facilitate the aseismic design of structures in cases where the effective duration of
the input strong ground motion is deemed as an important designing parameter (see e.g. Iervolino et
al., 2006; Hancock and Bommer, 2006).
5.3 Enhanced design spectrum compatible matching via the harmonic wavelet transform
In this section a specific design scenario is considered to illustrate the usefulness and
applicability of the harmonic wavelet based iterative matching procedure of section 3 to satisfy the
compatibility criteria of the GB 50011-2001 regulations. Specifically, it is set to design a structure
classified at the highest category of importance (i.e. a structure whose failure will have significant
secondary consequences), located at the capital of China, Beijing, founded on surface soil layers that
fall within the description of soil-type 2 (i.e. relatively stiff soil deposits), for the “rare” earthquake
event according to the GB 50011-2001. Furthermore, suppose that a non-linear dynamic
time-history analysis is deemed essential to be included in the design process. In this case the current
Chinese aseismic code provisions mandate to considering at least two sets of recorded earthquake
accelerograms and one set of artificial earthquake records to be used as input for the aforementioned
analysis. Each set of signals consists of two horizontal orthogonal components assumed to act along
the principal axes of the structure to be designed. The average response spectra of the above signals
on each direction must be in conformity (i.e. in a close agreement) with the GB 50011-2001 design
(target) spectrum corresponding to Tg=0.40s and αmax= 1.40g (see also Shiping, 1993 and Appendix
To accommodate the above requirements, the horizontal orthogonal components (East-West
or E-W and North-South or N-S) of seismic accelerograms recorded in two different sites during the
May, 2008 Wenchuan earthquake of magnitude 7.9 are considered, hereafter named by Wenchuan 1
and 2. These have been retrieved from raw data by means of standard techniques and base-line
adjusted as detailed in section 4 (see also Boore and Bommer, 2005 and the therein references).
Additionally, two artificial accelerograms compatible with the evolutionary K-T spectrum taken
from Table 2 associated with the prescribed GB 50011-2001 target spectrum (with Tg=0.40s and
αmax= 1.40g) are also generated. The two E-W recorded components together with one of the two
artificial signals, namely artificial 1, are grouped together assuming that they will act along the same
principal axis of the structure to be designed in the context of the requisite inelastic dynamic
analysis. Accordingly, a second group of signals comprising the remaining three signals, that is, the
two N-S recorded components and the second artificial signal (artificial 2), is formed acting along
the second structural principal axis.
Plots of the acceleration and displacement traces of the aforementioned groups of signals are
shown in the first and the third “columns” of panels in Fig. 6, respectively. Moreover, Fig. 7
includes the individual response spectra of both groups of signals in terms of pseudo-acceleration
and relative displacement. In the same figure the average response spectra of each group are also
provided and compared with the target spectrum. Obviously, the level of agreement is relatively
poor throughout the axis of natural periods considered. To rectify this shortcoming, the iterative
harmonic wavelet based matching procedure of section 3 is used to modify individually the
considered signals to improve the agreement of the average response spectra of each group with the
GB 50011-2001 target spectrum. Specifically, all signals are projected on a harmonic wavelet basis
spanning the frequency domain up to the Nyquist frequency by scales of constant bandwidths with
n-m= 6 and Δω= 0.0767rad/s via Eq. (23). Then, the obtained sub-signals are iteratively scaled by
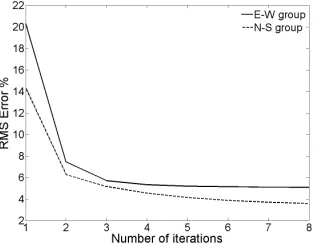
accelerogram as suggested by Eq. (24). After eight iterations the discrepancy between the average
response spectra of the considered groups of modified accelerograms and the target spectrum
gauged by the RMS error (Giaralis and Spanos, 2009)
( ) ( )
( )
2
1
1 Nk
d j j
j
k d j
S T D T RMS error
N = S T
⎛ − ⎞
⎜ ⎟
=
⎜ ⎟
⎝ ⎠
∑
(29)falls well below 6% as shown in Fig. 8. In Eq. (29) D signifies the average relative displacement
response spectrum of a group of signals. The RMS error curves of Fig. 8 have been evaluated at Tj=
1,…,Nk(=300) equally spaced points on the interval [0.02, 6] (s). In Fig. 6 the modified (matched)
accelerograms and their associated displacement time-histories obtained after eight iterations as
described above are juxtaposed with the “unmodified” (original) time-histories considered.
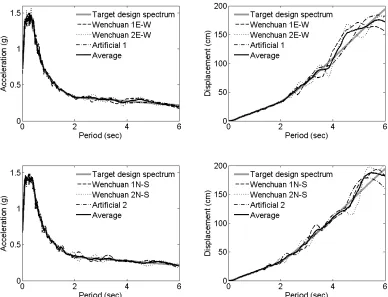
Furthermore, the individual and group averaged pseudo-acceleration and relative displacement
response spectra of the thus modified signals are shown in Fig. 9 along with the target spectrum to
assess the quality of matching achieved.
The effectiveness of the proposed harmonic wavelet based iterative procedure to modify both
“real” recorded and artificially generated signals to meet the compatibility criteria with the design
spectrum of the Chinese aseismic regulations GB 50011-2001 is readily seen by comparison of Figs.
7 and 9. Incidentally, it is observed that the requisite modifications induced by the proposed method
pertain mostly to the low frequency composition of the treated signals. This can be deduced by the
dramatic amplification of the displacement time-histories before and after being processed via the
iterative matching procedure, especially in the case of the recorded accelerograms (see Fig. 6). It is
noted that from a signal processing viewpoint the displacement time-histories constitute low-pass
filtered versions of the corresponding acceleration traces and thus reflect the richness of the
earthquake records in low frequencies. This extensive enrichment of the low frequency content in
the modified accelerograms is a consequence of pursuing a close matching of their response spectra
considered. However, it is known that such low frequency content is rarely observed in recorded
earthquake accelerograms as it can be witnessed by the displacement traces of the original
Wenchuan records considered (see also Faccioli et al., 2004 and Boore and Bommer, 2005).
Obviously, the monotonically increasing behavior of the GB 50011-2001 relative displacement
design spectrum for T>5Tg results in such unusual spectrum compatible accelerograms. In this
respect, future modifications of the Chinese aseismic code may prescribe a pseudo-acceleration
design spectrum whose definition will extent to periods greater than 6s that will yield relative
displacement design spectra converging to a constant spectral displacement for longer periods(see
e.g. CEN, 2004). Ideally, this constant value should be set equal to a prescribed peak ground
displacement, since it is well-established that the peak relative displacement response of very
flexible linear SDOF systems subject to a strong ground motion coincides with the maximum
displacement of the ground.
6 Concluding remarks
A numerical approach has been extended and customized to produce input acceleration
time-histories for linear and nonlinear time-history analysis compatible with the pertinent criteria of the
current Chinese aseismic code provisions (GB 50011-2001). The approach utilizes a stochastic
dynamics formulation to generate artificial accelerograms and a harmonic wavelet based iterative
procedure to modify signals individually to improve the matching of their response spectra with any
given response/design spectrum. A flowchart of the adopted approach is shown in Fig. 10 to further
elucidate the succession of the various involved steps and outcomes.
In the process of generating artificial accelerograms, a polynomial expression for the peak
factor ratio as a function of natural period has been provided by fitting numerically derived data
from appropriate Monte Carlo simulations associated with the GB 50011-2001 design spectrum.
compatible evolutionary Kanai-Tajimi (K-T) spectra for all possible design spectra as defined by the
Chinese aseismic code provisions. Furthermore, the aforementioned numerically derived analytic
expression for the peak factor spectrum can be useful in performing structural reliability analyses for
the design of new or for assessing the performance of existing structures in the context of the GB
50011-2001 regulations, since the peak factor is closely related to the first-passage problem of the
random vibration theory (Vanmarcke, 1976).
Special attention has been also given to relating the shape of the time-envelop function used
to modulate the K-T spectra with a commonly used definition of strong ground motion effective
duration. In this manner, the stochastic dynamics formulation adopted herein can yield artificial
seismic records of a pre-defined effective duration; an attribute which is critical when considering
certain performance criteria within the framework of performance based design of structures
(Iervolino et al., 2006; Hancock and Bommer, 2006).
Evolutionary K-T spectra compatible with all possible shapes and intensity levels of the GB
50011-2001 design spectrum have been provided in tabular form. These have been used to generate
ensembles of artificial accelerograms whose average response spectra are in a close agreement with
the GB 50011-2001 design spectrum. The level of this agreement is significantly enhanced
compared to previous related research efforts using a constant peak factor (Spanos and Vargas Loli,
1985; Marano et al., 2008; Giaralis and Spanos, 2009), as opposed to the herein derived period
dependent peak factor spectrum. Moreover, the reported K-T spectra can significantly facilitate the
design process in applications necessitating accounting for the stochastic nature of the input strong
ground motion in an explicit manner. Specifically, the K-T spectra corresponding to “minor” design
earthquake level for which structures are required to behave elastically can be utilized in conjunction
with linear random vibration formulations to obtain the probabilistic attributes of the response of
multi DOF structures in preliminary stages of the structural design process. Similarly, the K-T
stochastic features of the expected nonlinear/hysteretic response of multi DOF structures in the
context of the statistical linearization method (Roberts and Spanos, 2003).
Furthermore, a specific design example necessitating time-history analysis to be performed
has been considered to illustrate the efficiency of the considered harmonic wavelet iterative
procedure to modify accelerograms to improve the agreement of their response spectrum with the
GB design spectrum. In this context, small suites of accelerograms encompassing recorded
time-histories associated with the magnitude 7.9 Wenchuan seismic event of May, 2008 and artificially
generated signals compatible with a certain evolutionary K-T spectrum have been treated.
Finally, certain suggestions have been made for possible modification of the Chinese
aseismic code of both the design spectrum and the compatibility criteria for the input accelerograms
to be used for dynamic elastic and inelastic time-history analyses to incorporate, if desired, aspects
of the aseismic design philosophy of other areas in the world.
Appendix A. Design spectrum of the Chinese GB 50011-2001 aseismic code provisions
The elastic pseudo-acceleration design spectrum for oscillators with 5% ratio of critical
damping and natural period T, is defined by the current aseismic code provisions effective in China
(GB 50011-2001) by the expression
(
)
(
)
max max 0.9 max 0.9 max0.45 5.5 , 0 0.1
, 0.1
( )
, 5
0.2 0.02 5 , 5 6
g
g a
g g
g g
a T T
a T T
T S T
a T T T
T
a T T T T
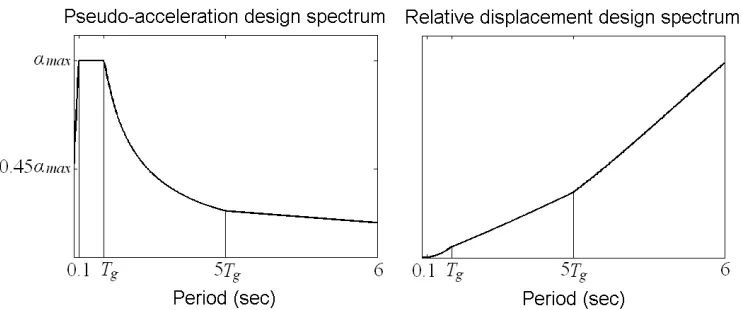
⎧ + ≤ ≤ ⎪ ≤ ≤ ⎪ ⎪ =⎨ ⎛ ⎞ ≤ ≤ ⎜ ⎟ ⎪ ⎝ ⎠ ⎪ ⎪ ⎡ − − ⎤ ≤ ≤ ⎣ ⎦ ⎩ . (A1)
In this equation, αmax is the peak value of the pseudo-acceleration spectral ordinate corresponding to
the flat region of the design spectrum which ends at the characteristic (corner) period Tg, as depicted
The value of αmax depends on a nominal peak ground acceleration associated with the local
“intensity level” taken from the pertinent seismic hazard map of China and the returning period of
the design earthquake considered as shown in table A1. In general, a two-phase performance based
design procedure is mandated according to which structures should behave elastically under the
“minor” or “frequent” earthquake of years return period (63% probability of exceedance in a
50-years period of assumed life service), while they should not collapse under the “major” or “rare”
design earthquake of 2000-years return period (2-3% probability of exceedance within 50-years)
(see also Shiping (1993) and Wang (2004)).
The corner period Tg can take on the values given in table A2 according to the “design
seismic group” that the considered location of construction belongs to. The later is a function of the
epicentral distance and the anticipated earthquake magnitude (e.g. Shiping, 1993). Further, the GB
50011-2001 code relates the corner period to the expected intensity level of the design earthquake
by requiring to increase the values of Tg of table A2 by 0.05sec for intensity levels 8 and 9. Thus, Tg
can overall attain 14 different values ranging from 0.25sec to 0.95sec (see also table 2).
The right panel of Fig. A1 plots the relative displacement design spectrum obtained from the
pseudo-acceleration spectrum of Eq. (A1) via the equation
2
( ) ( )
2
d a
T
S T S T
π
⎛ ⎞
= ⎜⎝ ⎟⎠ . (A2)
The above Sd spectrum is the one considered in section 5 to obtain compatible Kanai-Tajimi
evolutionary power spectra for all possible combinations of αmax and Tg defined in the GB
References
Bogdanoff JL, Goldberg JE and Bernard MC (1961), “Response of a simple structure to a random earthquake-type disturbance,” Bulletin of the Seismological Society of America, 51(2): 293-310.
Bommer JJ and Martínez-Pereira A (1999), “The effective duration of earthquake strong motion,” Journal of Earthquake Engineering, 3(2): 127-172.
Bommer JJ and Ruggeri C (2002), “The specification of acceleration time-histories in seismic design codes,” European Earthquake Engineering, 16(1): 3-16.
Boore DM (2003), “Simulation of ground motion using the stochastic method,” Pure and Applied Geophysics, 160(3-4): 635-676.
Boore DM (2005), “On pads and filters: Processing strong-motion data,” Bulletin of the Seismological Society of America, 95(2): 745-750.
Boore DM and Akkar S (2003), “Effect of causal and acausal filters on elastic and inelastic response spectra,” Earthquake Engineering and Structural Dynamics, 32(11):1729-1748.
Boore DM and Bommer JJ (2005), “Processing of strong-motion accelerograms: needs, options and consequences,” Soil Dynamics and Earthquake Engineering, 25(2): 93-115.
Carballo JE and Cornell CA (2000), “Probabilistic seismic demand analysis: Spectrum matching and design,” Report RMS-41, Department of Civil and Environmental Engineering, Stanford University.
CEN (2004), Eurocode 8: Design of Structures for Earthquake Resistance – Part 1: General Rules, Seismic Actions and Rules for Buildings (EN 1998-1: 2004), Comité Européen de Normalisation, Brussels.
Chopra AK (2007), “Elastic response spectrum: A historical note,” Earthquake Engineering and Structural Dynamics, 36(1): 3-12.
Chopra AK and Lopez OA (1979), “Evaluation of simulated ground motions for predicting elastic response of long period structures and inelastic response of structures,” Earthquake Engineering and Structural Dynamics, 7(4): 383-402.
Clough RW and Penzien J (1993), Dynamics of Structures. Second Edition, Mc-Graw Hill, New York.
Conte JP, Pister KS and Mahin SA (1992), “Nonstationary ARMA modeling of seismic motions,” Soil Dynamics and Earthquake Engineering, 11(7): 411-426.
Converse AM and Brady AG (1992), “BAP: basic strong-motion accelerogram processing software, version 1.0,” Open File Report 92-296A, United States Department of the interior Geological Survey.
Das S and Gupta VK (2008), “Wavelet-based simulation of spectrum-compatible aftershock accelerograms,” Earthquake Engineering and Structural Dynamics, 37(11): 1333-1348.
Faccioli E, Paolucci R and Rey J (2004), “Displacement spectra for long periods,” Earthquake Spectra, 20(2): 347-376.
Falsone G and Neri F (2000), “Stochastic modeling of earthquake excitation following the EC8: power spectrum and filtering equations,” European Earthquake Engineering, 14(1): 3-12.
GB 50011-2001 (2001), Code for seismic design of buildings, National Standard of the People’s Republic of China, China Building Industry Press, Beijing.
Giaralis A and Spanos PD (2009), “Wavelet-based Response Spectrum Compatible Synthesis of Accelerograms- Eurocode Application (EC8),” Soil Dynamics and Earthquake Engineering, 29(1): 219-235.
Gupta ID and Joshi RG (1993), “On synthesizing response spectrum compatible accelerograms,” European Earthquake Engineering, 7(2): 25-33.
Hancock J and Bommer JJ (2006), “A state-of-knowledge review of the influence of strong-motion duration on structural damage,” Earthquake Spectra, 22(3): 827-845.
Hancock J, Watson-Lamprey J, Abrahamson NA, Bommer JJ, Markatis A, McCoy E and Mendis R (2006), “An improved method of matching response spectra of recorded earthquake ground motion using wavelets,” Journal of Earthquake Engineering 10(1): 67-89.
ICC (2006), International Building Code, International Code Council, USA.
Iervolino I, Manfredi G and Cosenza E (2006), “Ground motion duration effects on nonlinear seismic response,” Earthquake Engineering and Structural Dynamics, 35(1): 21-38.
Iyama J and Kuwamura H (1999), “Application of wavelets to analysis and simulation of earthquake motions,” Earthquake Engineering and Structural Dynamics, 28(3): 255-272.
Jangid RS (2004), “Response of SDOF system to non-stationary earthquake excitation,” Earthquake Engineering and Structural Dynamics, 33(15): 1417-1428.
Kanai K (1957), “Semi-empirical formula for the seismic characteristics of the ground. University of Tokyo,” Bulletin of Earthquake Research Institute, University of Tokyo, 35: 309-325.
Karabalis DL, Cokkinides GJ, Rizos DC and Mulliken JS (2000), “Simulation of earthquake ground motions by a deterministic approach,” Advances in Engineering Software, 31(5): 329-338.
Kottke A and Rathje E (2008), “A semi-automated procedure fr selecting and scaling recorded earthquake motions for dynamic analysis,” Earthquake Spectra, 24(4): 911-932.
Lai SP (1982), “Statistical characterization of strong ground motions using power spectral density function,” Bulletin of the Seismological Society of America, 72(1): 259-274.
Lam N, Wilson J and Hutchinson G (2000), “Generation of synthetic earthquake accelerograms using seismological modeling: A review,” Journal of Earthquake Engineering, 4(3): 321-354.
Lin C-CJ and Ghaboussi J (2001), “Generating multiple spectrum compatible accelerograms using stochastic neural networks,” Earthquake Engineering and Structural Dynamics,30(7): 1021-1042.
Lutes LD and Lilhanand (1979), “Frequency content in earthquake simulation,” Journal of the Engineering Mechanics Division, ASCE, 105(EM1): 143-158.
Marano GC, Trentadue F, Morrone E and Amara L (2008), “Sensitivity Analysis of Optimum Stochastic Nonstationary Response Spectra under Uncertain Soil Parameters,” Soil Dynamics and Earthquake Engineering, 28(12): 1078-1093.
Mason AB and Iwan WD (1983), “An approach to the first passage problem in random vibration,” Journal of Applied Mechanics, ASME, 50(): 641-646.
Michaelov G, Lutes LD and Sarkani S (2001), “Extreme value of response to nonstationary excitation,” Journal of Engineering Mechanics, 127(4): 352-363.
Morikawa H and Zerva A (2008), “Approximate representation of the statistics for extreme responses of single degree-of-freedom system excited by non-stationary processes,” Probabilistic Engineering Mechanics, 23(3): 279-288.
Mukherjee S and Gupta VK (2002), “Wavelet-based generation of spectrum-compatible time-histories,” Soil Dynamics and Earthquake Engineering, 22(9-12): 799-804.
Naeim F, Alimoradi A and Pezeshk S (2004), “Selection and scaling of ground motion time histories for structural design using genetic algorithms,” Earthquake Spectra 20(2): 413-426.
Newland DE (1994), “Harmonic and musical wavelets,” Proceedings of the Royal Society of London. Series A, 444(1921): 605-620.
Newland DE (1998), “Time-frequency and time-scale signal analysis by harmonic wavelets,” in A. Procházka, J. Uhlír, P.J.W. Rayner and N.G. Kingsbury, editors, Signal analysis and prediction, Chapter 1, Birkhaüser, Boston.
Nocedal J and Wright SJ (1999), Numerical Optimization, Springer- Verlag, New York.
Ólafsson S, Remseth S and Sigbjornsson R (2001), “Stochastic models for simulation of strong ground motion in Iceland,” Earthquake Engineering and Structural Dynamics, 30(9): 1305-1331.