1
INTERPHASE OF A POLYMER AT A SOLID INTERFACE
H.J. Butt2, H. Duran2,5, W. Egger6, F. Faupel1, V. Harmandaris2,3, S. Harms1 , K. Johnston*2,4, K. Kremer2, F.Y. Lin2, L. Lue4, C. Ohrt1, K. Raetzke1, L. Ravelli6, W. Steffen*2, S.D.B. Vianna2 1
University of Kiel, Institute for Materials Science, Chair for Multicomponent Materials, Kaiserstr. 2, D-24143 Kiel, Germany
2
Max Planck Institute for Polymer Research, P.O. Box 3148, 55128 Mainz, Germany 3
University of Crete, Department of Applied Mathematics, Heraklion, Greece 4
University of Strathclyde, Department of Chemical and Process Engineering, 75 Montrose Street, Glasgow G1 1XJ, United Kingdom
5
TOBB University of Economics and Technology, Dept. of Mater. Sci & Nanotechnol. Eng. 06560, Ankara, Turkey
6
Institut für Angewandte Physik und Messtechnik LRT2, Fakultät für Luft- und Raumfahrttechnik, Universität der Bundeswehr München, Werner Heisenberg-Weg 39, 85577 Neubiberg, Germany
2
INTRODUCTION
Polymer–solid interfaces are at the center of intensive research due to their importance in polymer-coatings, hybrid materials, lubrication, adhesion, etc. The polymer properties close to this interface are of paramount importance for the performance of these composite systems. From the viewpoint of fundamental science, the confinement imposed by a solid substrate on the polymer should affect the polymer’s glass transition temperature, and this has led to a number of studies.
3 Enhanced Dynamic Light Scattering (REDLS), experiments on polybutadiene [11] showed a slowing-down in dynamics, and hence an increase in viscosity going to films below 25 nm in thickness. This is explained in terms of a three layer model of which one of the layers is a layer at the gold interface with strongly slowed down dynamics. These results are in concord with the computer simulations [6] on polybutadiene. In all cases the dynamics at the interface is found to be significantly slower than in the bulk. On the other hand for the case of polystyrene, there exists extensive work with dielectric spectroscopy [12] that finds no indication of a change from bulk behavior in the segmental dynamics. The smallest film thickness reported in these experiments was 5 nm. The dynamics of a single polymer chain was studied with dielectric spectroscopy [13] and only bulk behavior of the dynamics of the polymer segments was found. These results contradict the existence of a “dead layer” and leave the question why a method measuring directly the dynamics of polymer segments does not see what more indirect methods as depicted above see - a slowdown of dynamics in the proximity of the solid interface.
4
EXPERIMENTAL
Sample Preparation
All polystyrene (PS) specimens were produced at the Max Planck Institute for Polymer Research by anionic polymerization. The specimens have a polydispersity Mw/Mn better than 1.2 in all cases. For PALS we used oligomeric atactic polystyrene of Mw=400 g/mol (4mer) and 700 g/mol (7mer).
All samples were deposited on ultra-flat, polished N-LaSF9 glass substrates (Hellma) of thickness d = 1.5 mm. In a first step, after cleaning the substrates from residual dust, 1 nm of chromium as adhesion promoter followed by 100 nm of Au were deposited by thermal evaporation onto the substrates. To produce the polymer films we drop casted PS/Toluene solutions (10 %w/w) onto the Au on the substrates and annealed the films subsequently at 50K above Tg for at least 24h to remove residual solvent. We produced two sets of samples with thicknesses of d = 250 nm (400 g/mol) and d = 350 nm (700 g/mol). The film thickness was confirmed by confocal microscopy and by profilometer (Tencor P-10). All samples were further annealed at Tg+40 K for 36 h under vacuum. We established by profilometry that in the center of the glass slide an area bigger than the beam size for PALS had a constant thickness.
Samples measured with PALS:
5
Table 1: Sample names and sample characteristic for the PALS experiment. Glass is N-LaSF9,
the thickness of the CR layer is 1 nm and the thickness of the Au layer 100 nm in all relevant
cases.
Sample name layers Mw PS [g/mol] h [nm] PS film
"AU" Glass + Cr + Au -
-"PS700" Glass + PS 700 350
"AU PS700" Glass + Cr + Au + PS 700 350
"AU PS400" Glass + Cr + Au + PS 400 250
PALS
Positron annihilation lifetime spectroscopy is a well-accepted technique for determining free volume in polymers and composites [14,15,16,17,18,19]. This technique is based on probing the electron density distribution, which is related to the unoccupied regions (free volume) of the polymer. Thus, positrons injected into the polymer, thermalize and either annihilate directly with electrons from the sample ("free positron, lifetime
τ
2 ~400-600 ps") or form eventually a bound state with electrons (i.e. positronium) localized in free volume cavities or voids. The para state (spin of electron and positron antiparallel) decays immediately (τ
1=125 ps) whereas the ortho state (spin of electron and positron parallel,τ
3) cannot decay due to spin conservation. This ortho positronium can be used as probe for the cavity size: the larger the cavity the smaller the corresponding overlap of the square of the o-Ps wave function and cavity wall. The relative probabilities of these three decay modes are usually termed intensities and are related to the positronium formation probability.A well accepted quantum mechanical model makes this quantitative [20]
6 where λ0 is the spin averaged decay rate in the electron layer at the edge of the potential well, δR=0.166 nm is the thickness of the electron layer, which has been determined by using materials with a well-known pore size [21] and Rh is the average free volume hole radius. In summary, PALS is a suitable tool to determine the average hole size of free volume in polymeric materials. In previous works some of the present authors have shown that PALS results in bulk polymers qualitatively fit to simulations [22] and that these simulations can also be evaluated with respect to size distribution and shape of the free volume [23].
For the present investigation, it is sufficient to assume that the decrease in o-Ps lifetime
τ
3 is correlated with the decrease in average hole size.Conventional tracer-based positron sources emit positrons with very high energy, thus up to 1 mm of polymer is necessary for complete absorption. For depth resolved experiments with planar samples, an energy tunable positron lifetime beam is necessary - like the one available at the FRM II in Munich [24], which is now routinely used for thin film polymeric samples [17, 25]. Here the distribution of the positrons as function of distance to the surface for different energies has to be taken into account. In a homogeneous material, this probability distribution P(z,E), where z is the position and E is the implantation energy, is analytically solvable and follows the so-called Makhov profile. − − = − m i m m i E z z z E z mz E z P ) ( exp ) ( ) , ( 0 0 1 δ (2) with m E z E
7 where z1/2 is the median implantation depth, E is the energy of the incoming positrons, A is a constant factor, ρ is the density of the material and m and n are numerical factors. For practical applications, the shortened form with
n E A E z ρ = ) ( 2 / 1 (4) is used.
Unfortunately, the implantation profile widens with increasing implantation energy, and consequently the depth resolution decreases. Qualitatively, the uncertainty, ∆z, is given by
) ( * 5 . 0
~ z1/2 E z
∆ (5)
[26]. Although these Makhov profiles might only be approximate, they are frequently used [27], in particular for polymers, and have also been verified by computer simulations [28,29]. One of the most common computer programs for simulation of high energetic particles with solid matter is GEANT4 [30], originally developed for detectors in high-energy physics research.
GEANT4 has also been applied to layered metallic systems and has been shown to be very useful [28], as the back reflection on layers with higher density can be taken into account. Some of the present authors have already performed reference PALS beam measurements on layered polymer-solid systems, namely Teflon AF on a Si substrate, where no such problems with back reflection of positrons at the substrate occurs. In these studies it was shown that a clear interphase with a lower free volume exists for spin coated polymer films. However, for the present samples, problems due to backscattering are to be expected due to the higher density and atomic number Z of the Au layer underneath the polymer.
PALS beam conditions
8 implantation energies from 1 keV to 16 keV with counting times of 500 s per point at a typical peak to background ratio of 5x10³ to 1.
Positron lifetime spectra were treated as usual with the program LT 9.2 Kansy [31], which is particularly suited for results from polymers, as a distribution of lifetimes can be taken into account. Three and four lifetimes were determined, some of them fixed according to known rules (for details see below). The usual corrections [17,20,22] due to the background and the energy dependent resolution function have also been performed.
SIMULATION DETAILS
A thin polystyrene film of width 10 nm, sandwiched between two gold surfaces, was simulated at 1 atm and 503 K for 100 ns using NpT classical atomistic molecular dynamics as implemented in the GROMACS package version 4.6 [32,33,34]. The film contained 50 chains, each of length 10 monomers. The interaction between the polymer and the surface was obtained from quantum density functional theory calculations [4,35]. The simulations are described in more detail in a previous paper [4]. The current work further analyses the interface density and focuses on the structure and distribution of the free volume in the films near the interface, which can be used to understand the PALS observations.
9 the grid point spacing), from any other voxel in that cluster. Thus we name the free volume entities determined this way from simulations free volume clusters.
To obtain information about the structure of the film, the free volume cluster properties, such as size and shape, were analyzed. The shape of a free volume cluster was analyzed via the gyration tensor and its eigenvalues, denoted λ1, λ2 and λ3, where λ1 ≥ λ2 ≥ λ3. A measure of the shape of the free volume cluster is given by the asphericity, A, which is defined as
) ( 2 2 3 2 1 3 2 1 λ λ λ λ λ λ + + − − = A (6)
so that a sphere would have A=0, an infinitely thin planar free volume cluster would have A=0.25, and an infinitely thin cylinder would have A=1. The free volume analysis was performed over 10 ns with the configurations separated by 100 ps.
RESULTS AND DISCUSSION
1) PALS
10
Figure 1: O-Ps lifetime, (filled symbols, left hand scale) and o-Ps intensity (unfilled symbols,
right hand scale) as function of implantation energy for different molecular weights and film
thickness.
11 experiments an interphase width of approx. 10 nm. Thus the average o-Ps lifetime in a polymer layer close to the substrate is lower than in the bulk of the film. As the shape of the holes does not change throughout the film (see below), eq. 1 shows that the average hole size significantly decreases. Quantitative information - also on the corresponding length scale - is not straightforward to obtain, as the density profile is convoluted with the implantation profile and possible diffusional broadening. Qualitatively we can state that the lower limit of resolution of the length scale of the interphase is approximately 2 nm, as we have not seen the native SiO2 layer in previous investigations [25]. On the other hand, for implantation energies of 3-4 keV, corresponding to average depth of 175nm - 290nm (from eq. 4), bulk behavior is seen, therefore, the interphase width must be somewhat smaller than this. Thus, a more atomistic view with the help of simulations is necessary.
The advantage of simulation is that it can show details that are inaccessible to experiment. However, the simulations are only as accurate as the force fields they used and it is important to validate the simulations using experimental results.
2) Simulation results
The simulation has investigated several issues: a) the density profile dependence on resolution, b) the dependence of the free volume on the atomic radii and c) the shape of the free volume clusters.
a) Variation of density profile with resolution
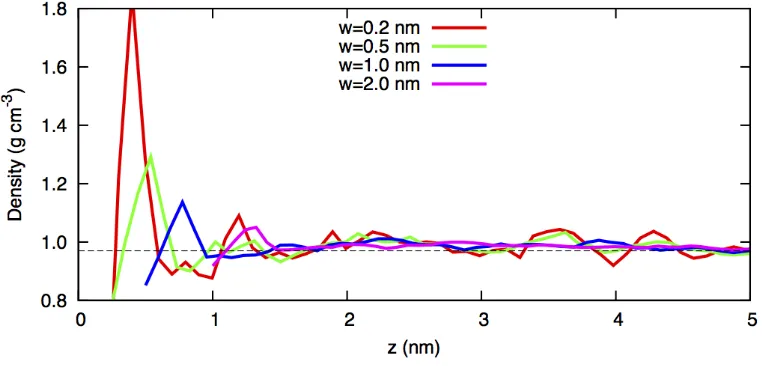
12 widths, w) were calculated. To obtain smoother curves, rolling bins were used. These density profiles are shown in Figure 2.
Figure 2: The density profile of the polystyrene film as a function of distance from the
surface, z. The different lines correspond to different bin widths, w, as indicated in the
legend. The horizontal black line corresponds to the density of bulk polystyrene.
As expected the high-density peak becomes smeared out as the resolution is decreased (w increased) and for w=1.0 nm, the peak is approximately 15% larger than the bulk value.
b) Size and shape dependence of the free volume on atomic radii
13
Figure 3: (a) Snapshot of the 10 nm film of polystyrene confined between gold surfaces. On
the right are the corresponding free volume voxels for (b) σ=0.20 nm and (c) σ=0.25 nm,
respectively.
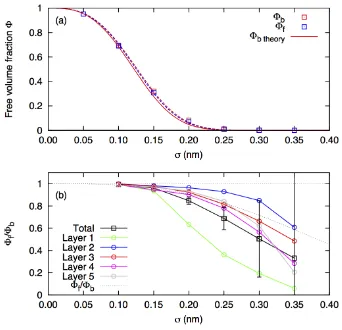
Obviously, the free volume voxel density depends on the value of the cut-off distance σ so that for large values of σ, the free volume voxel density is small, and for small σ, the density is large, as can be seen in Fig. 3. The average density can be compared to the average bulk density for each cut-off value. The free volume fraction was calculated by dividing the number of free volume voxels by the number of grid points in the total film volume. The volume fraction of the free volume voxels in the systems has been plotted in Figure 4(a) together with the theoretical prediction for the free volume fraction Φ of random penetrating spheres in a box given by [38]:
N
N
− = Φ
3 4 1
3 πσ
[image:13.595.149.470.78.348.2]14 where N is the number of particles and ρ=N/V is the number density where V is the volume of a sphere of radius σ. In the continuum limit this becomes
− = Φ = Φ ∞ → N N 3 4 exp lim 3 πσ ρ (8)
The simulation results for bulk polystyrene deviate slightly from the theory for cutoff radii of 0.1 nm to 0.25 nm. We believe that this is due to the correlation between the polymer atoms in the simulations (i.e. the atoms are not randomly arranged) since the hydrogen atoms are situated close to the carbon atoms and the carbon atoms in a chain have a preferred bond distance. This correlation hypothesis is supported by the fact that both bulk and film deviate from the curve by a similar amount and have a slightly higher volume fraction that the theoretical prediction.
To make a comparison with experiment we are interested in the ratio between the free volume fractions of the film and the bulk, which can be obtained using eq. 8 for bulk PS with average density ρb and for the PS film with average density ρf. The free volume fraction ratio is then given by
(
)
− − = Φ Φ 3 4 exp 3 πσ ρ ρf b bf
(9)
15 of the film free volumes for different snapshots and indicate that only the data from cutoffs up to about 0.20 nm is reliable. The standard deviation of the bulk sample is not included in the bars.
In addition to the average film data the data from layers parallel to the surface are shown. The data are averaged over both gold surfaces. Layers 1-4 are of width 1.0 nm, but Layer 5 is smaller, approximately 0.9 nm, being the central region, and its width varies with the box size. Layer 1 is closest to the gold surface and shows a smaller free volume than the film average, which is due to the presence of the gold surface and the high PS density. This decrease in free volume voxels can be seen in the snapshots of the free volume voxels in Fig. 3(b) and (c) and is consistent with the high density layer shown in Fig. 2. The second layer has a smaller free volume fraction ratio, which is due more free volume voxel particles in this layer compared to the film average. Similarly layers 3, 4 and 5 have a slightly higher free volume voxel particle density than the film average. Within error bars, layers 2-5 have a similar density to bulk but beyond σ = 0.20 nm the ratio between the layer free volume to bulk free volume is within the error bars.
c) Free volume voxel cluster size and shape
16
Figure 4: (a) Free volume fraction for bulk PS and the thin film of PS on Au (symbols). The
theoretically predicted volume fraction as a function of cut-off radius using the bulk density
is shown as a solid line. The dashed lines are fits of equation 8 to the bulk and film data
where the density is treated as a fitting parameter. (b) Ratio of the free volume fractions for
the thin film and bulk polystyrene. Total refers to the whole film and the layers are slices of
the film parallel to the interface, with Layer 1 being closest to the gold. The black dashed
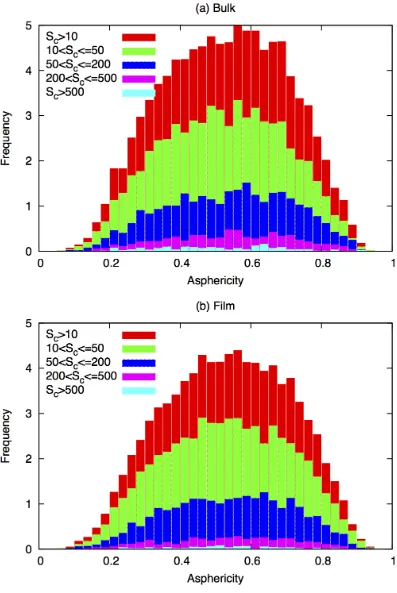
[image:16.595.137.479.75.405.2]17
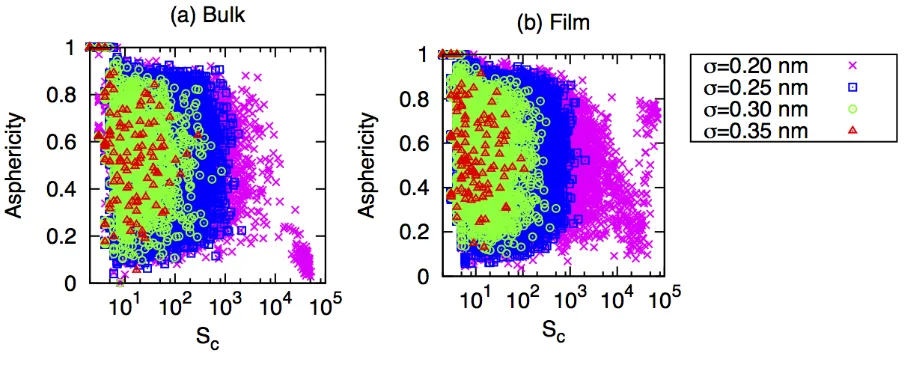
Figure 5: Cluster asphericity vs. cluster size for (a) bulk PS and (b) the PS film. For σ = 0.20
nm large clusters have an anomalous asphericity distribution due to the formation of
continuous networks.
For small free volume clusters of less than 10 voxels there is an issue with discretisation of the cluster shape due to the grid, and, hence, the average asphericity of these clusters is larger than for larger clusters. For example, all 2-voxel free volume clusters have an asphericity of 1. The average asphericity of free volume clusters of a particular size decreases up to a size of around 10, when the average becomes constant, as shown in Figure 6. For this reason, clusters with less than or equal to 10 free volume voxels have been omitted from the cluster analysis.
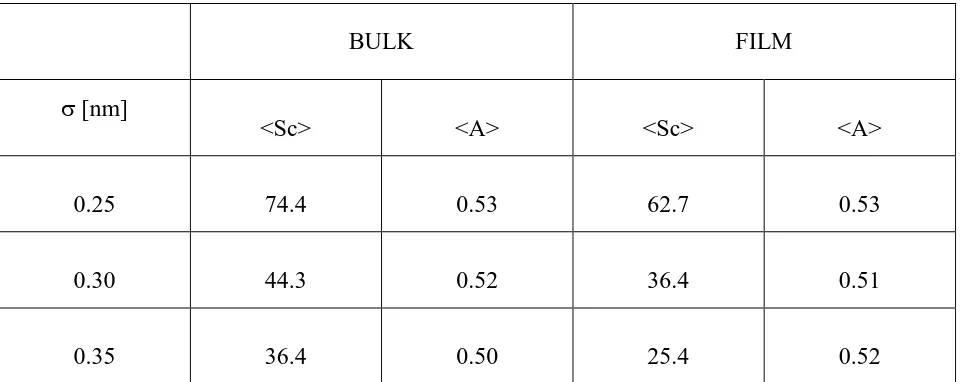
The mean free volume cluster size and mean asphericity (equ. 6) over all clusters of more than 10 voxels for bulk and film and different cutoff values is shown in Table 2. The mean asphericity of around 0.50-0.53 for bulk PS is in good agreement with a previous study of PS that found an average asphericity of 0.5 [39]. For cutoffs of greater than 0.20 nm, the average size of the free volume clusters is larger in the bulk than in the film, in agreement with the findings of the PALS measurements.
18
Figure 6: The dependence of mean asphericity on cluster size for (a) bulk and (b) film. The
dashed line corresponds to A=0.25, which is a planar cluster. A=1 corresponds to an
infinitely thin cylinder (line).
Table 2: Mean cluster size <Sc> and mean cluster asphericity<A> for different values of the
cutoff σ.
BULK FILM
σ [nm]
<Sc> <A> <Sc> <A>
0.25 74.4 0.53 62.7 0.53
0.30 44.3 0.52 36.4 0.51
0.35 36.4 0.50 25.4 0.52
[image:18.595.66.546.431.622.2]19
20
CONCLUSIONS
The structural properties of polystyrene close to a gold interface have been investigated using both atomistic molecular dynamics simulations and positron annihilation lifetime spectroscopy.
The results of simulations at high temperatures show that the density is affected only about 1 nm from the gold interface and the average density across a 10 nm film is only slightly higher than the bulk density. However, an analysis of the free volume fractions in bulk and film, shows that the ratio of free volume fractions can vary strongly with particle size, even for a small difference in density. An analysis of the free volume clusters shows that the shape distribution of the free volume clusters is similar in the bulk and the film and that the distribution of free volume cluster shapes is size-independent. In agreement with experiment, the size of the free volume clusters in bulk polystyrene was found to be larger than the average size of the free volume clusters in the film.
The results from the PALS experiments at low temperatures close to Tg show an increase of density towards the gold interface.
Qualitatively the two methods, simulation and PALS, come to the same conclusion of a more dense layer close to the gold interface via the monitoring of the free volume in both methods. It is not appropriate to make a quantitative statement since the two methods operate at different temperatures due to their own respective limitations.
ACKNOWLEDGEMENT
21
CORRESPONDING AUTHORS
*
(K.J.): Telephone: +44 (0)141 548 4084. Fax: +44 (0)141 548 2539. E- mail: [email protected], *(W.S.): Telephone: +49 (0)6131 379116. Fax: +49 (0)6131 379100. E- mail: [email protected].
Supporting Information Available: Description. This material is available free of charge via the Internet at http://pubs.acs.org.
REFERENCES
1
Lyulin, A. V.; Hudzinskyy, D.; Janiaud, E.; Chateauminois, A. Journal of Non-Crystalline Solids
2011, 357, (2), 567-574. 2
Baljon, A. R. C.; Williams, S.; Balabaev, N. K.; Paans, F.; Hudzinskyy, D.; Lyulin, A. V. Journal of Polymer Science Part B: Polymer Physics 2010, 48, (11), 1160-1167.
(3) Hudzinskyy, D.; Lyulin, A. V.; Baljon, A. R. C.; Balabaev, N. K.; Michels, M. A. J. Macromolecules 2011, 44, (7), 2299-2310.
(4) Johnston K., Harmandaris V., Soft Matter2012, 8, 6320-6332
(5) Johnston K., Harmandaris V., Macromolecules2013 , 46, 14, 5741-5750.
22 (7) Daoulas, K. Ch., Harmandaris V. and Mavrantzas V. G., Macromolecules2005, 38, 5780
-5795.
(8) Harmandaris V., Daoulas, K. Ch. and Mavrantzas V. G., Macromolecules2005, 38, 5796
-5809.
(9) Napolitano, S. and Wübbenhorst, M., Nature communications2011, 2, 260.
(10) Koga, T., Jiang N. et al. Physical Review Letters2011, 107, 22, 225901(5).
(11) Lin, F.-Y. and Steffen, W., J. Chem. Phys. 2014, 141, 104903
(12) M. Tress, M. Erber, E. U. Mapesa, H. Huth, J. Müller, A. Serghei, C. Schick, K.-J. Eichhorn, B. Voit, and F. Kremer, Macromolecules2010, 43, 9937-9944.
(13) M. Tress, E. U. Mapesa, W. Kossack, W. K. Kipnusu, M. Reiche, and F. Kremer, Science
2013,341, 1371-1374.
(14) Ed. O.E. Mogensen, Positron annihilation in chemistry, Springer series in chemical physics 58; Springer: Berlin, 1995.
(15) Jean, Y. C., Mallon, P. E., Schrader, D. M. Principles and applications of positron & positronium chemistry; Eds.;World Scientific: River Edge, NJ, 2003.
(16) Front Matter, in Materials Science of Membranes for Gas and Vapor Separation, Y.
Yampolskii, Pinnau, I. and Freeman, B. (eds.), Editor. 2006, John Wiley & Sons, Ltd: Chichester, UK.
(17) Harms S., Rätzke K., Faupel F., Chaukura N., Budd P. M., Egger W., Ravelli L., The Journal
of Adhesion2012, 88, 608-619.
(18) Harms S., Rätzke K., Faupel F., Schneider, G. J., Willner, L. and Richter, D. Macromolecules
23 (19) Matson, S. M., Rätzke, K; Shaikh, M. Q., Litvinova, E. G., Shishatskiy, S. M., Peinemann, K.-V.r; Khotimskiy, V. S., Polymer Science A 2012, 54, 8, 671–677.
(20) Principles and applications of positron & positronium chemistry; ed. Jean, Y. C., Mallon, P. E., Schrader, D. M., Eds.; World Scientific: River Edge, NJ, 2003.
(21) Nakanishi, H., Wang, S. J. and Jean, Y. C. in Positron Annihilation Studies of Fluids; Sharma S.C., Ed.; World Scientific, Singapore, 1988, 292.
(22) Kruse, J., Kanzow, J., Rätzke, K., Faupel, F., Heuchel, M., Frahn, J., Hofmann, D. Macromolecules2005, 38, 9638-9643.
(23) Schmidtke, E.; Günther-Schade, K.; Hofmann, D.; Faupel, F., Journal of Molecular Graphics & Modelling 2004, 22, 309-316.
(24) Sperr, P.; Egger, W., Kögel, G., Dollinger, G., Hugenschmidt, C., Repper, R. et al., Appl Surf Sci. 2008, 255, 35-38.
(25) Harms, S., Rätzke, K., Zaporojtchenko, V., Faupel F., Egger, W., Ravelli, L. Polymer2011, 52, 505-509.
(26) Algers, J., Sperr, P., Egger, W., Kögel, G., Maurer, F. Phys. Rev. B. 2003, 67, 125404(7).
(27) Coleman, P., Positron beams and their applications, World Scientific, Singapore 2000.
(28) Dryzek, J., Horodek, P., Nuclear Instruments and Methods in Physics Research B2008, 266, 4000-4009.
(29) Dryzek, J., Horodek, P., Nuclear Instruments and Methods in Physics Research B2009, 267, 3580-3589.
24 (31) Kansy, J. J. Nucl. Instrum. Meth. A. 1996, 374, 235-244.
(32) Hess, B., Kutzner, C., van der Spoel, D. and Lindahl, E. J. Chem. Theory Comput. 2008, 4,
435–447.
(33) Lindahl, E., Hess, B. and van der Spoel, D. J. Mol. Model. 2001, 7, 306-317.
(34) Berendsen, H., van der Spoel, D. and van Drunen, R., Comput. Phys. Commun. 1995, 91, 43-56.
(35) Johnston K., Harmandaris V., Journal of Physical Chemistry C2011,115, 30, 14707-14717.
(36 B. Löwe, private communication.
(37) Depth profiling of the free volume at a Teflon AF/SiN interface with a focused slow positron beam, Ohrt,C.; Koschine,T.; Rätzke,K.; Faupel, F.; Oshima,N; Kobayashi, Y.; Suzuki, R.;
Uedono, A (2014) In preparation.
(38) Elsner A., Wagner, A., Aste, T., Hermann, H. and Stoyan, D., Journal of Physical Chemistry B2009, 113, 7780-7784.
25
for Table of Contents use only
INTERPHASE OF A POLYMER AT A SOLID INTERFACE