Universities of Leeds, Sheffield and York
http://eprints.whiterose.ac.uk/
This is an author produced version of a paper published in Journal of Food Engineering
White Rose Research Online URL for this paper: http://eprints.whiterose.ac.uk/3379/
Published paper
DEVELOPMENT OF ENGINEERING DESIGN TOOLS TO HELP
REDUCE APPLE BRUISING
12
3
4
5
6
7
8
9
10
11
12
13
14
15
16
17
18
19
20
21
22
23
R. LEWIS*, A. YOXALL, L.A. CANTY, E. REINA ROMO
Department of Mechanical Engineering, The University of Sheffield, Mappin Street, Sheffield, S1 3JD
*Corresponding author, [email protected]
ABSTRACT
A large percentage of apples are wasted each year due to damage such as bruising. The apple journey from orchard to supermarket is very complex and apples are subjected to a variety of static and dynamic loads that could result in this damage occurring.
The main aim of this work was to carry out numerical modelling to develop a design tool that can be used to optimise the design of harvesting and sorting equipment and packaging media to reduce the likelihood of apple bruise formation resulting from impact loads. An experimental study, along with analytical calculations, varying apple drop heights and counterface material properties, were used to provide data to validate the numerical modelling.
Good correlation was seen between the models and experiments and this approach combined with previous work on static modelling should provide a comprehensive design tool for reducing the likelihood of apple bruising occurring.
1 INTRODUCTION
24
25
26
27
28
29
30
31
32
33
34
35
36
37
38
39
40
41
42
43
44
45
46
47
The journey of an apple from the orchard to the supermarket is extremely complex and includes a number of processes such as packaging, sorting, storage and transportation. During these processes the apples have to be treated carefully to maintain quality and avoid losses due to damage. The major contributing factor to such losses is bruising (Garcia et al., 1995; O’Loughlin, 1964). This is defined as damage to, and discolouration of apple flesh, usually with no breach of the skin (Labavitch et al., 1998). The discolouration occurs if damage to the apple causes membranes of the individual cells that make up apple flesh to be breached. This allows enzymes from different parts of the cells to mix initiating a reaction that produces the brown colouration, which is associated with bruising. Recent anecdotal evidence from apple distributors has shown that the wastage figure due to bruising could be 50% or higher. This represents a large cost, not only borne by various parties involved in the journey of the apple from orchard to supermarket, but also by the supermarket, as a significant number of apples are damaged while being put out on display.
During its journey to the supermarket an apple may experience a number of different types of loading that may lead to damage and bruising, the two main types being static and dynamic. The dynamic loads may be due to single impacts, which may occur during picking or sorting as the apples are dropped into storage bins, or vibration, which may occur during transportation.
In this work the focus was on dynamic loading due to single impacts as this appeared to be the most prevalent. The situations where this may occur are highlighted in Table 1, along with the drop heights and the materials the apples may impact against.
to propel an apple against a counterface (Pang et al., 1994; Ragni, 2001; Bollen et al., 2002; Holt, 1977). The data coming from this work, however, is relatively limited in nature and most is in a form that would not be useful to apple distributors or sellers. Pang et al. (1994) have produced the most useful contribution. Their work on dynamic impacts against a variety of counterface materials using a pendulum device produced a series of bruising thresholds. These, however, were based on apple accelerations, which would be harder to determine than drop height for example, which limits their application.
48
49
50
51
52
53
54
55
56
57
58
59
60
61
62
63
64
65
66
67
68
69
70
71
The main aim of this work was to develop a numerical design tool for assessing drops typically experienced by apples in harvesting and sorting equipment to reduce the likelihood of apple bruising occurring.
Apple drop testing was also carried out against a number of different materials typical of those used in packing, harvesting and storage media to provide easy to interpret results that can be compared with industry thresholds for apple bruises and to provide data to validate the numerical models. Analytical calculations were also used to provide further comparison.
2 BACKGROUND
2.1 Experimental Studies of Dynamic Apple Loading
A number of different testing methods have been used to study dynamic impacts of apples, as mentioned in the introduction. These include simple drop tests (Pang et al., 1994); pendulum tests, in which it is easier to control the impact point as the apple is held (Ragni, 2001; Bollen et al., 2002); tests where a mass is dropped onto a stationary apple (Garcia et al., 1995) and tests using a spring loaded device to propel an apple against a counterface (Holt, 1977).
susceptibility of different apple types and establish the effects of parameters such as irrigation, humidity and time of harvest.
72
73
74
75
76
77
78
79
80
81
82
83
84
85
86
87
88
89
90
91
92
93
94
95
Work carried out to study how impact energy affected bruise volume showed that volume was approximately proportional to energy (Holt, 1977). This was for one counterface material and there was no indication of how this may vary with different materials.
In general, while giving large amount of useful data on how particular types of apple react to different types of loading under a variety of environmental conditions, the results from these studies of bruising due to impact are very difficult to interpret and compare, and are more importantly do not help apple distributors or sellers in reducing losses due to bruising. Only a small amount of work has been carried out to study impacts against different materials and there has certainly been no attempt to model the impact behaviour to develop a tool for sorting equipment or packaging design.
2.2 Apple Finite Element Analysis
Numerical Finite Element (FE) techniques have been used previously to investigate modes of vibration in apples (Lu & Abbott, 1996)) and to study transient responses of apples to impulse excitations to determine factors influencing sonic measurements (Lu & Abbott, 1997). Both these analyses were used to ascertain apple firmness, which is a good indication of how ripe an apple is.
could probably be assumed that using different properties for different regions would be a more accurate approach. In both studies a simplified shape was assumed for an apple.
96
97
98
99
100
101
102
103
104
105
106
107
108
109
110
111
112
113
114
115
116
117
118
119
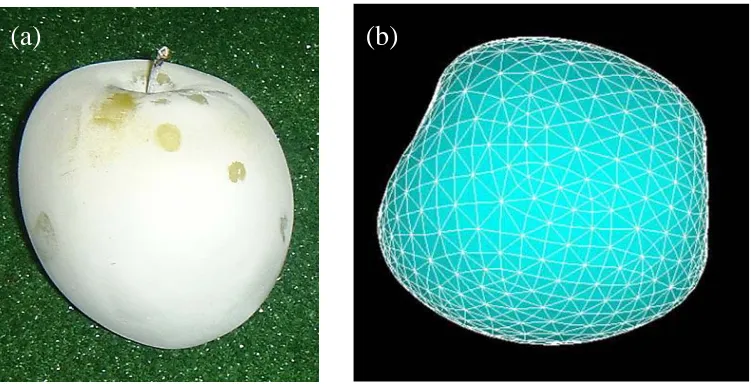
FE has also recently been used with some success to investigate contact areas and stresses in static apple contacts (Lewis et al., 2006). In this work, as well as the present study, an actual apple form was generated using laser scanning. This was thought to be important as area and stress will be extremely sensitive to contact geometry.
3 EXPERIMENTAL DROP TESTING
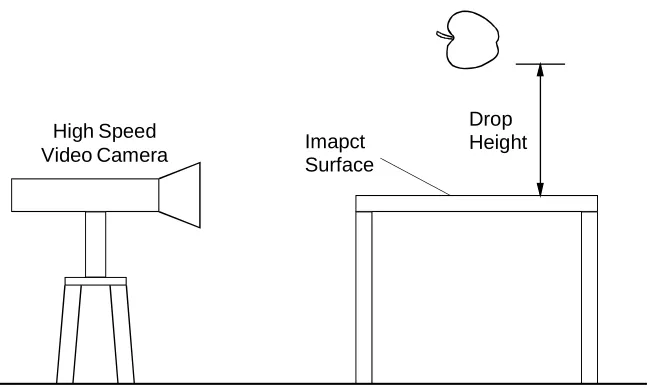
The aim of the experimental work was to gain an improved understanding of apple bruise formation due to impacts against a variety of counterface materials and to provide the results in a user friendly form. The results were also to be used to validate analytical and numerical calculations detailed in subsequent sections. A drop testing technique was used, as it was thought to be the most realistic simulation of what would actually happen to the apple, although it was difficult to control the impact point.
3.1 Test Apparatus
3.2 Specimens
120
121
122
123
124
125
126
127
128
129
130
131
132
133
134
135
136
137
138
139
140
141
142
143
144
‘Golden Delicious’ apples were used for the tests. This variety was chosen due to its pale skin, which means any discolouration from bruising is more evident. The apples used were on their way to the supermarket, having been in cold storage. Sugar content and firmness tests were carried out on the apples prior to testing to ensure that apples with consistent properties were used. A spherometer was used to measure the radii of curvature of the apples at the stem shoulder, cheek and calyx shoulder regions (see Figure 2a) to enable relationships between
bruising and location of impact on the apples to be determined and to provide input data for Hertz predictions of the contact area and stress to be calculated. The results of the measurements are shown in Figure 2b. As would be expected cheek radii were higher than those of the calyx and stem shoulders.
The properties shown in Table 2 for ‘Golden Delicious’ apples were used throughout this work. They were taken from tests carried out by Abbott & Lu (1996) and Mohsenin (1970). This work indicated that the elastic properties of the apple flesh varied according to load orientation and position in the apple (data in Table 2 has been averaged). Failure stresses were also determined for the flesh and these also varied with position in the apple. Typical values were around 0.40-0.51MPa, although, as with all properties, these varied with the relative ripeness of the apples. The greatest failure stresses were found for medium ripe apples (levels of relative ripeness were based on harvest time and appearance).
3.3 Procedure
145
146
147
148
149
150
151
152
153
154
155
156
157
158
Apples were dropped from heights ranging from 0.1 – 1.2m (to cover the range of possible heights identified in Table 1) onto perspex, steel, rubber (on steel), cardboard (on perspex) and wood as well as a half apple to simulate an apple-to-apple contact. Tests were repeated for each height at least three times to ascertain the spread of results.
The aim was to achieve apple impact in the cheek region, however, initial testing indicated that it was quite difficult to control the impact position. It was possible, though, using the measurements taken of each apple pre-test, to tie up bruise volumes with radius of the apple at the impact point. A number of tests were therefore carried out to assess how the bruise areas and volumes varied with radius at contact and region of contact (using a perspex counterface).
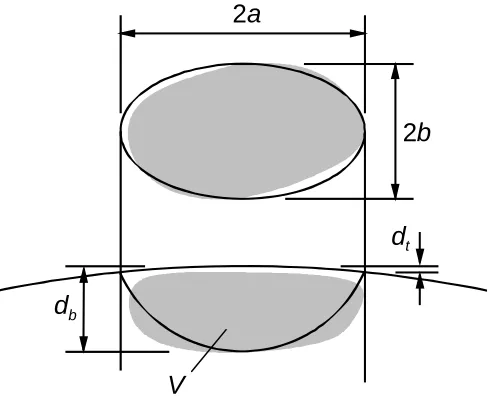
Apples were left for 24 hours after dropping for the bruises to develop fully. The areas, A, were then determined by measuring the widths (2a and 2b, as shown in Figure 4) and assuming they were elliptical:
ab
A=π (1)
159
160
161
162
Bruise volumes were calculated using the elliptical bruise thickness method (Mohsenin, 1970). This calculation method has been compared with a range of others and found to give the most accurate results (Bollen et al., 1999). Bruise volume, V is given by:
(
)
(
(
24 12
24 b t
t b
d d ab d
d
V =π − + −
)
)
(2)163
164
165
166
167
The parameters used are defined in Figure 4.
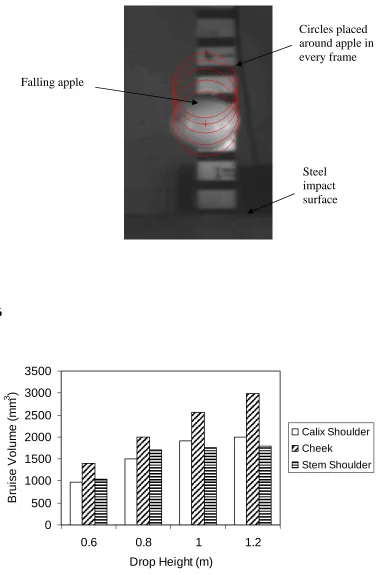
The captured film was processed and software was used to find the co-ordinates of the apples as they fell by placing circles around them in each frame, as illustrated in Figure 5.
168
169
170
171
172
Calculations could then be carried out to determine the impact energy, eimpact, which is equal
to the difference between the energy the apple has before and after the impact:
drop
before mgh
e =
before,
Energy (3)
2 2
1 after,
Energy eafter =mghafter + mvafter (4)
173
after before
impact e e
e = −
energy,
Impact (5)
174
175
176
177
178
179
180
181
182
183
184
185
186
187
188
189
where m is the apple mass, v is the apple velocity, hdrop is the drop height and hafter the height
after impact.
3.4 Results
Results of tests carried out to see how the location of the impact point on the apple would affect bruise volume are shown in Figure 6. Results have been selected so that the cheek, stem shoulder and calix shoulder radii were similar at each drop height to allow the results to be
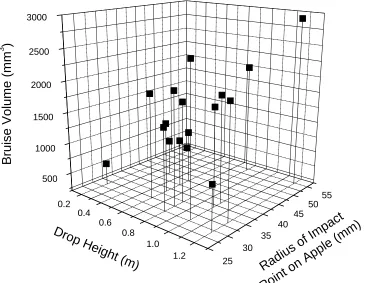
considered independent of the geometry (the radii for the cheek, stem shoulder and calix shoulder were: ~40mm, ~30mm and ~35mm respectively). As can be seen the largest bruises are seen on the cheeks. These typically have larger radii, so there is clearly a relationship between radii and bruise volume. A plot of radius against bruise area against bruise volume is shown in Figure 7. This shows that bruise area and volume clearly increase with increasing radius.
over the three specimens used at each test condition was a maximum of ±50mm2. The smallest bruises were seen when using cardboard and wood and the largest with steel and rubber on steel. In the apple-to-apple tests the stationary apples had larger bruises than the dropped apple.
190
191
192
193
194
195
196
197
198
199
200
201
202
203
204
205
206
207
208
209
210
211
212
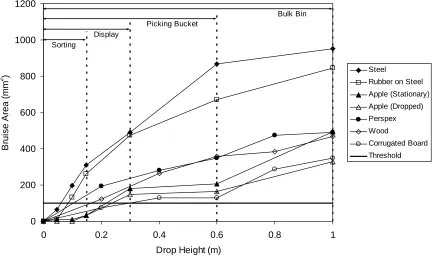
On Figure 8, showing bruise areas, the industry threshold for bruises (100mm2) is also plotted as well as possible regimes of damage at the various stages of the apple journey. It can be determined at what drop height this is exceeded for each of the counterface materials, which is very useful information when designing equipment for harvesting and sorting or packaging media.
Data in Figure 10 illustrates how bruise volume varies with impact energy. Values determined using the high speed video footage and Equations 3-5. There is an approximately linear relationship between the two, with different gradients for each counterface material. This ties in with observations made by Holt (1977) during tests with ‘Jonica’ apples, the results of which are also shown in Figure 10.
4 DYNAMIC FINITE ELEMENT MODELLING
4.1 Mesh Construction
sufficient to accurately represent the apple geometry and also allowed the model to be solved with the resources available.
213
214
215
216
217
218
219
220
221
222
223
224
225
226
227
228
229
To simplify the modelling, isotropic properties were assumed, as they have been in most previous FE studies of apples (see Section 2.2).
A Young’s modulus of 4MPa was used, as determined for ‘Golden Delicious’ flesh in the appropriate region of the apple by Abbot & Lu (1996). The data in Table 2 illustrates shows how the Young’s Modulus actually varies between the various parts of an apple. Abbott & Lu (1996) have also shown that the properties of apple flesh vary in different parts of the apple and are different if loading is applied from varying directions.
Linear elastic material properties were also assumed, and while this is probably not valid for apple flesh, it is compatible with previous work.
4.2 Modelling Procedure
Dynamic analysis was used to simulate a free fall of the meshed apple for drop heights of 0.2 to 1.2m onto the impact surface, as illustrated in Figure 12. Impact surfaces were given the properties shown in Table 3. Model runs were carried out for impacts on perspex, wood and cardboard. In order to reduce the calculation time, only the short time frame after impact was
analysed. Impact velocities were calculated from the drop heights (v= 2gh) and are shown in Table 5.
230
231
232
233
234
235
4.3 Results
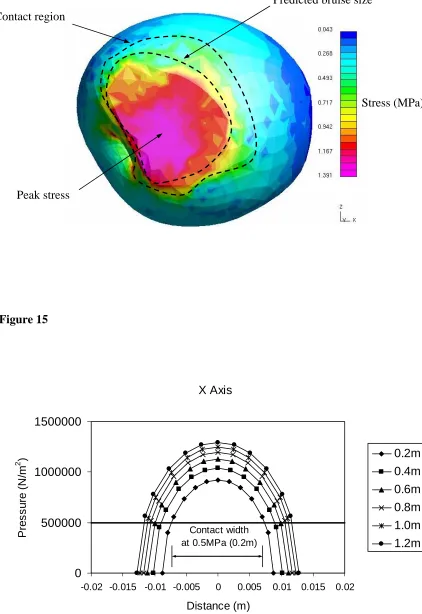
contact area and stresses increase. Figure 14 shows a snap shot of the point at which the stresses are at a maximum (at maximum deflection). In order to estimate a bruise area, the area of the contact in each case over 0.5MPa (approximate failure stress of ‘Golden Delicious’ apple flesh (Abbott & Lu, 1996)) was calculated. Full results are compared with the experimental and analytical results in the discussion.
236 237 238 239 240 241 242 243 244 245 246 247 248 249 250 251 252
5 ANALYTICAL ANALYSIS
Analytical calculations for the impacting apples were based on a scheme using Hertz equations for contacts (Hertz, 1881). This analysis, although both static and elastic in nature has been widely applied to impact situations where permanent deformations are produced, such as the apple contact. The use of the Hertz analysis beyond the limits of its validity has been justified on the basis that it appears to predict accurately most of the impact parameters that can be experimentally verified (Goldsmith, 1960).
Initially the impact force, Pmax, was calculated using analysis derived for an elastic sphere
impacting a rigid plate (Goldsmith, 1960):
5 . 1 max h max k δ
P = (6)
where δmax, is the maximum deflection given by:
4 . 0 2 0 max 4 5 ⎟ ⎟ ⎠ ⎞ ⎜ ⎜ ⎝ ⎛ = h k v m
δ (7)
253
where m is the mass of the sphere, v0 is the sphere velocity at impact (given by 2gh, where
h is the drop height) and k
254
255 h is a constant given by:
(
2)
5 . 0 h 1 4 3 ν −
= R E
k (8)
where R is the radius of the sphere (the average value of the cheek region of the apple was used) and E and v are Young’s modulus and Poisson’s Ratio of the sphere material respectively. Results of calculations for a range of drop heights are shown in Table 5 (values of E and v for apple flesh in Table 2 were used and an apple mass of 0.15kg).
257 258 259 260 261 262 263 264 265 266 267 268 269
Once the force has been calculated it can be used in the following Hertz equations to determine the elliptical contact area half widths a and b and the maximum contact pressure p0
(equations are outlined in Williams (1994)).
Results of these calculations for an apple impact on perspex are shown in Table 5. Properties for the apple flesh and counterface materials given in Table 5 were used in the calculations. Average values from the measurement of apple specimens in the drop testing were used to determine R1 (28.8mm) and R2 (37mm). The contact area does not represent the likely bruise
area. To determine area approximations for the bruises the pressure distributions were plotted (as shown in Figure 15 for perspex) using the equation given below:
2 / 1 2 2 0 1 ⎪⎭ ⎪ ⎬ ⎫ ⎪⎩ ⎪ ⎨ ⎧ ⎟ ⎠ ⎞ ⎜ ⎝ ⎛ − ⎟ ⎠ ⎞ ⎜ ⎝ ⎛ − = b y a x p
p (9)
270 271 272 273 274 275 276 277 278 279
A plot is shown for a perspex impact at a range of drop heights for sections along the x axis. The x and y axis plots were used to determine a and b can be determined from the plots at the point where the stress is over 0.5MPa, the failure stress of ‘Golden Delicious’ apple flesh. Comparison of the results of the calculations with the FE and experimental results are included in the discussion.
6 DISCUSSION
heights can be reduced to levels below those that could give a bruise over the industry threshold size (see Figure 8). Although bruise volumes have been calculated throughout the work, it is probably bruise areas that are more important as these are visible and used to define the threshold used. It is also usually how an apple looks that determines whether a consumer will purchase it (Cliff et al., 2002).
280
281
282
283
284
285
286
287
288
289
290
291
292
293
294
295
296
297
298
299
300
301
The work has shown that the radius at the point of impact heavily influences the bruise volume, with larger radii giving larger bruises. This means that if the point of impact is on the cheek of an apple, the bruise will be larger than those on the stem or calix shoulders, which
generally have smaller radii.
It was clear from the results that using counterface materials with a higher energy absorbing capacity led to smaller apple bruises. The rubber, however, because it was backed with steel still gave relatively large bruises. It was also interesting to see that large bruises occurred due to apple-to-apple contacts. This can occur when apples are tipped, for example, into display stands in supermarkets and if this is done from too high a height problems may occur and lead to apple wastage.
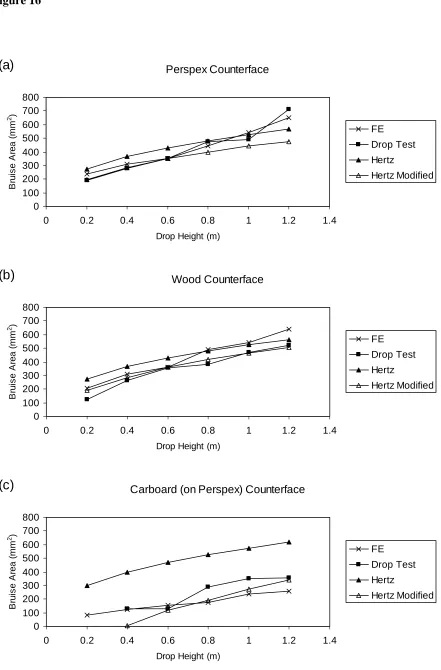
Figure 16 shows how the analytical and numerical bruise predictions for perspex, wood and cardboard compare with the experimental results. Good correlation is seen for all, even with the simplifications made in modelling the corrugated board.
302
303
304
305
306
307
308
309
310
311
312
313
314
315
316
317
318
319
320
321
322
323
324
325
The numerical and analytical modelling illustrates the fact that the bruise area is lower than the actual bruise area. When considering just the area at the failure stress of the apple flesh a better prediction of bruise size is achieved. The relationship between contact area and bruise area has been shown experimentally previously in work on apple-to-apple contacts (Pang et al., 1992; Studman et al., 1997) where bruise areas were up to 25% lower than the contact area. The analytical results in the present study illustrated in Figure 16 show a difference of a similar order of magnitude (where unmodified Hertz is the contact area and the modified Hertz is the bruise area).
The numerical model clearly shows great promise, and if developed further to improve the structure of the apple, and combined with the static approach detailed previously (Lewis et al., 2006), could create a comprehensive tool for assessing apple packaging. The results could also be used as part of educational tools for those working in the industries dealing with apples and other produce, to help reduce the likelihood of damage occurring.
7 CONCLUSIONS
Apple bruise areas and volumes resulting from dynamic impacts vary with surface radii of the apple at the point of impact. The larger the radii the larger the area and volume of the bruise formed. Therefore cheek impacts will give larger bruises than stem or calix shoulder impacts as this region tends to have a higher radius.
that bruise volume is approximately proportional to drop height. Rigid counterfaces gave higher bruise areas than softer more energy absorbing materials. Figure 17 shows the relationship between the Young’s Modulus of the counterface materials and the bruise volume at a drop height of 1m (from Figure 9). The trend is clearly for bruise volume to grow with increasing Young’s modulus. The only anomaly is rubber, but the value plotted is that for rubber alone and the rubber was actually mounted on a steel base plate which would increase the overall stiffness. The data has been compared with industry thresholds for bruise sizes and indicates maximum drops heights that should be allowed to give bruises below these.
326
327
328
329
330
331
332
333
334
335
336
337
338
339
340
341
342
343
344
345
346
347
348
349
Analytical and numerical tools have been developed to predict bruise sizes for a given drop height against a given counterface material. The numerical model particularly shows reasonable correlation with experimental results and if developed further and combined with previously developed static models will provide a comprehensive design tool for apple harvesting and transportation equipment and packaging media. Average differences ranged between 7% for Perspex to 18% for wood and 26 % for cardboard. It was in modelling the cardboards as a homogeneous material, however, that the largest simplification was made so this error is perhaps not surprising.
8 REFERENCES
Abbott, J.A. & Lu, R. (1996). Anisotropic mechanical properties of apples. Transactions of the ASAE, 39, 1451-1459.
Bollen A.F., Nguyen H.X. & Dela Rue B.T. (1999). Comparison of methods for estimating the bruise volume of apples. Journal of Agricultural Engineering Research, 74, 325-330.
350
351
352
353
354
355
356
357
358
359
360
361
362
363
364
365
366
367
368
369
370
371
372
373
374
375
376
377
378
379
Cliff M., Sanford K., Wismer W. & Hampson C. (2002). Use of digital images for evaluation of factors responsible for visual preference of apples by consumers. Hortscience, 37, 1127-1131.
Garcia, J.L., Ruiz-Altisent M. & Barreiro, P. (1995). Factors influencing mechanical properties and bruise susceptibility of apples and pears. Journal of Agricultural Engineering Research, 61, 11-18.
Goldsmith W. (1960). Impact: The theory and physical behaviour of colliding solids. Edward Arnold Ltd, London.
Hertz H. (1881). Über die Berührung fester elastischer Körper. Journal reine angew Mat., 92, 155.
Holt, J.E. & Schoorl, D. (1977). Bruising and energy dissipation in apples. Journal of Textures Studies, 7, 421-432.
Labavitch, J.M., Greve, L.C. & Mitcham, E. (1998). Fruit bruising: it's more than skin deep. Perishables Handling Quarterly, 95, 7-9.
Lewis, R., Yoxall, A., Marshall, M.B., Canty, L.A. (2006). Characterising pressure in apple contacts. submitted to Wear.
Lu, R. & Abbott, J.A. (1996). Finite element analysis of modes of vibration in apples. Journal of Texture Studies, 27, 265-286.
Lu, R. & Abbott, J.A. (1997). Finite element modelling of transient responses of apples to impulse excitation. Transactions of the ASAE, 40, 395-1409.
Lu, T.J. & Zhu, G. (2001). The elastic constants of corrugated board panels. Journal of Composite Materials, 35(20), 1868-1870.
Mohsenin, N.N. (1970). Physical Properties of Plant and Animal Materials. Vol. 1, Gordon and Breach Publishers, New York.
O'Loughlin, JB. (1964). The bruising of fruit during transport and storage. In Proceedings of the Fourth Australian Fruit and Vegetable Storage Conference, 1-13.
Ragni, L. & Berardinelli, A. (2001). Mechanical behaviour of apples and damage during sorting and packaging. Journal of Agricultural Engineering Research, 78, 273-279.
380
381
382
383
384
385
386
387
388
Williams, J.A., (1994). Engineering Tribology, Oxford University Press, Oxford.
Pang, W., Studman, C.J., Ward, G.T. (1992). Bruising damage in apple-to-apple impact. Journal of Agricultural Engineering Research, 52, 229-240.
Figure Captions 389 390 391 392 393 394 395 396 397 398 399 400 401 402 403 404 405 406 407 408 409 410 411 412 413 414 415 416 417 418 419 420 421 422 423 424
Figure 1 Drop Test Apparatus and Camera Set-up
Figure 2 (a) Regions where Radii of Curvature were Measured; (b) Values of Radii Figure 3 Corrugated Card used in Impact Testing
Figure 4 Elliptical Bruise Thickness Method for Bruise Determination (Mohsenin, 1970)
Figure 5 Circles Placed around Apples in Film Data Analysis
Figure 6 Bruise Volumes for Apples Dropped onto the Cheek (~40mm radius), Calix Shoulder (~35mm radius) and Stem Shoulder (~30mm radius) from various Heights on to Perspex (radii were similar for each apple impact point for each of the tests)
Figure 7 Bruise Area and Volume against Radius of Apple at Impact Point
Figure 8 Average Bruise Areas for Apple Impacts against Different Materials at Varying Drop Heights
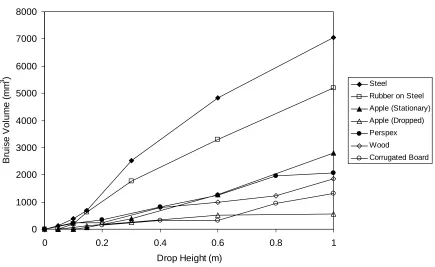
Figure 9 Bruise Volumes for Apple Impacts against Different Materials at varying Drop Heights
Figure 10 Bruise Volume against Impact Energy for Different Impact Surfaces Figure 11 The Apple (a) Before Laser Scanning and (b) Represented in Ansys Figure 12 Finite Element Model of Apple and Impact Surface
Figure 13 FE Apple Impact against Perspex from a Drop Height of 1.2m at Point of Maximum Deflection
Figure 14 Stresses in a Node at the Centre of the Contact in Figure 18
Figure 15 Stress Distributions for Drop Heights from 0.2m to 1.2m onto Perspex
Figure 16 Comparison of Experimental, Analytical and Numerical Bruise Areas for Apple Impacts against Perspex, Wood and Cardboard
Figure 17 Bruise Volume at a 1m Drop Height (from Figure 9) against Young’s Modulus of the Counterface Material
Table Captions
Table 1 Potential Dynamic Apple Loading Situations and Associated Drop Heights Table 2 Young’s Modulus, Poisson’s Ratio and Failure Stress for Different Parts of a
Golden Delicious Apple (Abbott & Lu, 1996; Mohsenin, 1970) Table 3 Impact Surface Material Properties
Table 4 Geometrical Characteristics and Bulk Density of Type 150B Corrugated Board
Figure 1
Drop Height Imapct
Surface High Speed
Video Camera
Figure 2
Stem Shoulder
Cheek
Calix Shoulder
0 10 20 30 40 50 60
Calix Shoulder
Cheek Stem
Shoulder
R
adi
us (
m
m
)
[image:20.595.138.463.132.326.2]Figure 3
z
y (Cross-machine direction (CD))
x (Machine direction (MD))
h
λ
t1
t3
t2 Outer Liner
Filler
Inner Liner
Figure 4
2a
2b
dt
db
[image:21.595.176.420.471.669.2]Figure 5
Circles placed around apple in every frame Falling apple
Steel impact surface
Figure 6
0 500 1000 1500 2000 2500 3000 3500
0.6 0.8 1 1.2
Drop Height (m)
Br
u
is
e
Vo
lu
m
e
(
m
m
3 )
Calix Shoulder Cheek
[image:22.595.135.487.131.370.2]Figure 7
0.2 0.4
0.6 0.8
1.0 1.2
25 30
35 40
45 50
55 500
1000 1500 2000 2500 3000
Bruis
e
Volume (m
m
3 )
Radiu s of Im
pact
Point on A
pple (mm)
Dro p He
Figure 8
0 200 400 600 800 1000 1200
0 0.2 0.4 0.6 0.8 1
Drop Height (m)
Br
u
is
e
Ar
e
a
(
m
m
2 )
Steel
Rubber on Steel
Apple (Stationary) Apple (Dropped) Perspex
Wood
Corrugated Board
Threshold Bulk Bin
Picking Bucket Display
Figure 9
0 1000 2000 3000 4000 5000 6000 7000 8000
0 0.2 0.4 0.6 0.8 1
Drop Height (m)
Br
u
is
e
V
o
lu
m
e
(
m
m
3 ) Steel
Rubber on Steel
Apple (Stationary) Apple (Dropped)
Perspex Wood
Figure 10
0 2000 4000 6000 8000 10000 12000 14000 16000 18000
0 0.5 1 1.5
Energy Absorbed at Impact (J)
Br
u
is
e
Vo
lu
m
e
(
m
m
3 )
2 Steel
Rubber on Steel
Apple (Dropped)
Jonica on steel (Holt, 1977)
Figure 11
[image:26.595.112.488.526.718.2]Figure 12
Figure 13
Figure 14
Predicted bruise size Contact region
Peak stress
Stress (MPa)
Figure 15
X Axis
0 500000 1000000 1500000
-0.02 -0.015 -0.01 -0.005 0 0.005 0.01 0.015 0.02
Distance (m)
P
re
ssu
re
(
N
/m
2 )
0.2m 0.4m 0.6m 0.8m 1.0m 1.2m
(a)
[image:28.595.73.495.120.734.2]Figure 16 Perspex Counterface 0 100 200 300 400 500 600 700 800
0 0.2 0.4 0.6 0.8 1 1.2 1.4
Drop Height (m)
B rui s e A rea ( m m 2 ) FE Drop Test Hertz Hertz Modified
(a)
Wood Counterface 0 100 200 300 400 500 600 700 8000 0.2 0.4 0.6 0.8 1 1.2 1.4
Drop Height (m)
B rui s e A rea ( m m 2 ) FE Drop Test Hertz Hertz Modified
(b)
Carboard (on Perspex) Counterface
0 100 200 300 400 500 600 700 800
0 0.2 0.4 0.6 0.8 1 1.2 1.4
Drop Height (m)
Figure 17
0 1000 2000 3000 4000 5000 6000 7000 8000
0.001 0.1 10 1000
E (GPa)
B
rui
s
e V
ol
um
e
at
1m
D
rop H
ei
g
ht
(
m
m
3 )
Rubber (on steel)
Steel
Wood Perspex
Table 1
Point in Journey
Process Stage Potential Drop Height Impact Material
Picking Bucket 0.6m Perspex
Wood Apple Orchard
Bulk Bin 0.6-1m
Packing House Repack 0.05-0.15m Perspex
Wood Cardboard Apple
Distributor Sorting (conveyors etc.) 0.05-0.15m Steel
Rubber on Steel
Retailer Putting on Display 0.05-0.3m Cardboard
[image:31.595.130.470.441.493.2]Apple
Table 2
Region of Apple Skin Flesh Core
Young’s Modulus (MPa) 20 4 8
Failure Stress (MPa) - 0.40-0.51 -
Poisson’s Ratio 0.3 0.3 0.3
Table 3
Material Thickness (mm) Elastic Modulus, E (GPa) Poisson’s Ratio, υ
Perspex 5 2.35 0.38
Steel 5 200 0.3
Rubber 3 0.1 0.5
Wood (Pine) 8 8.89 0.341
Table 4
Parameter Value
h (mm) 2.9
λ (mm) 6.5
t1 0.25
t2 0.25
t3 0.25
Bulk Density (kg/m3) 194.8
Table 5
Drop Height (m)
Velocity at Impact (m/s)
δmax (m)
Pmax
(N) R’ (mm)
k E E* (N/m2)
a (mm)
b (mm)
Area (mm2)
Mod. Area (mm2)
0.2 1.98 0.00416 169.9 16.2 0.882 1.46 4.39×10⁻⁶ 9.80 9.98 276.03 195.51
0.4 2.80 0.00548 257.6 16.2 0.882 1.46 4.39×10⁻⁶ 10.11 11.47 364.23 284.49
0.6 3.43 0.00645 328.5 16.2 0.882 1.46 4.39×10⁻⁶ 10.96 12.44 428.36 350.42
0.8 3.96 0.00724 390.4 16.2 0.882 1.46 4.39×10⁻⁶ 11.61 13.17 480.60 395.98
1 4.43 0.00791 446.3 16.2 0.882 1.46 4.39×10⁻⁶ 12.14 13.77 525.47 441.37
[image:32.595.79.515.374.468.2]