THE TRANSITION FROM SCHOOL TO WORK AND JOB-SEEKING BEHAVIOUR AMONG YOUTH
IN THREE CITIES OF JAVA
Makmuri Sukarno
A thesis submitted for the degree of Doctor of Philosophy Demography Program
Division of Demography and Sociology Research School of Social Sciences The Australian National University
Declaration
Except where otherwise indicated, this thesis is my own work undertaken as a scholar in the Demography Program, Division of Demography and Sociology, Research School of Social Sciences, The Australian National University, from July 1994 to May 1998.
Makmuri Sukarno
ACKNOWLEDGEMENTS
I would like to thank the members of my supervisory committee: Prof. Gavin W. Jones, supervisor and the head of the committee; Dr. Adrian C. Hayes and Prof. Geoffrey McNicoll, supervisors; and Dr. Mariah H. Evans, advisor. Prof. Jones deserves special thanks for his support and encouragement during my studies. His willingness to listen to the problems, to comment and assist with the revision of the thesis made the completion of this thesis possible.
ABSTRACT
This thesis is about the effects of social origin and education on young people’s transition from school to employment in a situation where unemployment among the educated is high. The study is mainly based on a survey of 3000 respondents, and in-depth interviews.
Social origin and education determine the pattern of transition of the young people: their search behaviour, job search methods, job search process and the outcome, occupational attainment. Children of parents with low education have longer unemployment periods, find jobs that are unmatched with their education and consequently, tend to continue searching for alternative jobs while employed. Continued searching for job while employed or unemployed appears to be a result of ‘coercion’ rather than ‘luxury’. This may relate to the fact that the socio-economic status of their parents, measured by education and occupation, provides occupations that were significantly low. The significant effect of the types of help given by parents on children’s occupations also suggests that the involvement of parents in job acquisition is important in paving the way for their children’s careers.
TABLE OF CONTENTS
Page
DECLARATION... ii
ACKNOWLEDGEMENTS... iii
ABSTRACT... iv
TABLE OF CONTENTS... v
LIST OF TABLES... ix
LIST OF FIGURES...xiii
CHAPTER 1: INTRODUCTION 1.1 The setting and problems... 1
1.2 Relationships of family background, education and occupation: theoretical perspectives... 4
1.3 The status attainment m odel... 7
1.4 Status attainment model: limitations and its extension... 9
1.5 Theories on job-seeking behaviour... 12
1.6 Aims of the study... 12
1.7 Hypotheses... 13
1.8 Contribution to the body of knowledge... 14
1.9 Relevance to policies...15
1.10 Sources of data... 16
1.11 Limitations of the d ata... 17
1.12 Qualitative data... 19
1.13 Methodology... 19
CHAPTER 2 : EDUCATION AND EMPLOYMENT TRENDS DURING 1980-1990 2.1 Introduction... 25
2.2 Educational policy: quantity first... 26
2.3 Young people in the labour force... 30
2.4 Labour supply with different levels of education... 35
2.7 Improvement of educational qualification of labour and
the push-down effect on occupation... 44
2.8 Trends in education and employment and the research question... 49
CHAPTER 3 : SOCIAL ORIGIN AND EDUCATIONAL ATTAINMENT 3.1 Literature review... 51
3.2 Educational attainment in Java and its setting... 55
3.3 Characteristics of respondents... 57
3.4 The relationship between individual characteristics, socio-environmental and parental background and educational attainment... 58
3.4.1 Effect of individual characteristics, parental and socio-environmental background on educational attainment: Regression results... 60
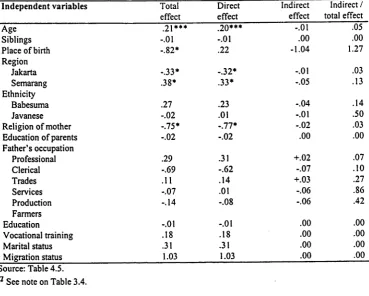
3.4.2 Direct effects... 61
3.4.3 Indirect effects... 66
3.5 Sex, education disciplines and non-formal education... 69
3.6 Summary of findings... 72
CHAPTER 4 : FAMILY BACKGROUND, EDUCATION AND PARTICIPATION IN THE LABOUR FORCE. 4.1 Introduction... 76
4.2 Labour force concept... 77
4.3 Social origin, sex, education and participation in the labour force: Theoretical perspectives... 78
4.4 Social origin, education and gender difference in labour -force participation: cross-tabulation results... 83
4.5 Effects of demographic, socio-environmental, parental and educational factors on participation in the labour force: Regression results... 91
4.6 Summary of findings... 104
5.2 Literature review... 108
5.3 Effect of individual characteristics, social origin and educational factors on search behaviour: Multinomial logit analysis... 120
5.3.1 Demographic characteristics and search behaviour... 128
5.3.2 Socio-environmental background and search behaviour.... 131
5.3.3 Parental background and search behaviour... 138
5.3.4 Education and search behaviour... 143
5.4 Summary of findings...145
CHAPTER 6 : JOB SEARCH METHODS 6.1 Introduction...149
6.2 Source, flow and the recipients of job information and influence: theoretical perspectives... 150
6.3 Social reproduction theory... 153
6.4 Source of job information, dependence on other people’s help and types of help... 154
6.5 The relationship of social origin, educational attainment to the length of unemployment... 173
6.6 Summary of findings... 183
CHAPTER 7 : JOB SEEKING BEHAVIOUR: THE PROCESS 7.1 Introduction, social reproduction theory and setting... 186
7.2 Leaving school and psychological distance to employment... 189
7.3 Social background, education, work ethos and resource consolidation... 194
7.4 Searching for a job for the first time and conversion of resource to that end... 200
7.5 Reaction and response to unemployment... 208
7.6 Restructuring the allocation of resource... 217
7.7 The emphasis and use of non-educational capital... 220
7.8 Acceptance o f ‘temporarily’ lower-status occupation... 225
CHAPTER 8 : FAMILY BACKGROUND, EDUCATION, JOB SEARCH METHODS AND OCCUPATIONAL ATTAINMENT
8.1 Introduction... 233
8.2 Correspondence between education and employment... 234
8.3 Non-educational factors and occupational attainment... 236
8.4 The approach of this study... 238
8.5. Measurement of occupational status... 239
8.6. Effect of social origin, education and matching process on occupational attainment: Regression results... 240
8.7. Effects of social origin, education and matching on occupation of employees who were helped by other people to find job... 256
8.8. Summary of findings... 263
CHAPTER 9 : CONCLUSION 9.1 Aims and approach of the study... 266
9.2 Summary of findings... 268
9.3 Limitations of the study... 286
9.4 Policy issues... 290
APPENDICES... 294
LIST OF TABLES
Table 2.1
Page Percentage distribution of highest educational attainment
of urban youth 15 to 29 years by province, 1980
and 1980... 28 Table 2.2 Numbers and growth of young people, young labour
force
and young job seekers 15 to 29 years
in urban areas by province and sex, 1980-1990... 32 Table 2.3 Percentage distribution of main activities during the
previous week of urban youth 15 to 29 years by
sex and province, 1980-1990... 34 Table 2.4 Percentage distribution of urban job seekers by age group
and province, 1980 and 1990... 35 Table 2. 5 Labour-force participation rates by educational attainment,
region and sex, 1980-1990 (%)... 36 Table 2.6 Percentage distribution of urban job seekers by highest
education attainment and provinces, 1980 and 1990... 37 Table 2.7 Percentage distribution of sectoral employment of population
10 years and over by highest educational attainment
and province, 1980 and 1990... 39 Table 2. 8 Percentage distribution of employment of urban youth
15-29 years by sectors and highest educational attainment,
Jakarta and Java, 1980 and 1990... 40 Table 2. 9 Percentage distribution and change in number of urban young
workers 15-29 years by highest educational attainment,
Jakarta and Java, 1980-1990... 41 Table 2.10 Employment status of urban youth 15-29 years by
highest educational attainment, Jakarta and Java, 1980
and 1990... 42 Table 2. 11 Unemployment rate by sex and highest educational attainment,
urban areas of Jakarta, East and Central Java,
1980 and 1990 (%)... 44 Table 2. 12 Percentage distribution of main occupation of urban youth
15-29 years by highest educational attainment, Jakarta and
Table 2.13 Real rates of return to investment in education by education
Attainment, Indonesia 1982-1989 (%)... 47 Table 2.14 Average annual income of male workers in urban areas of
Indonesia by levels of education and age group,
1986-1989 (Thousand Rupiahs, 1986 constant price)... 48 Table 2.15 Real rates of return on investment on education by education
attainment and region, 1982-1989 (%)... 49 Table 3.1 Means and standard deviation for selected variables, school
leavers 15 to 29 years in three cities of Java, 1994... 58 Table 3.2 Correlation among individual characteristics, parental
and socio-environmental background and educational attainment, school leavers 15 to 29 years in three cities
of Java, 1994 (both sexes)... 59 Table 3.3 Regression on the probability of educational attainment among
school leavers 15 to 29 years in three cities of Java, 1994... 65 Table 3.4 Total effect, direct effect and indirect effect of variables
on the educational attainment among youth 15 to 29 years
in three cities of Java, 1994... 67 Table 3.5 Educational disciplines of school leavers 15 to 29 years by
parents’ education and sex, in three cities of Java, 1994... 70 Table 3.6 The proportion of school leavers 15 to 29 years having
vocational training by educational levels and sex, three cities
of Java, 1994... 71 Table 3.7 Non-formal education of school leavers 15 to 29 years by
respondent’s education and socio-economic background,
three cities of Java, 1994... 72 Table 4.1 Percentage distribution of main activities of school leavers
15 to 29 years by sex in three cities of Java, 1994... 84 Table 4.2 The correlation of labour-force participation by some
explanatory variables, school leavers 15 to 29 years in three
cities of Java, 1994... 84 Table 4.3 Participation in the labour force by sex, individual
characteristics and environmental factors, school leavers
15 to 29 years, three cities of Java, 1994... 87 Table 4.4 Participation in the labour force by sex, parental background
and education, school leavers 15 to 29 years in three cities
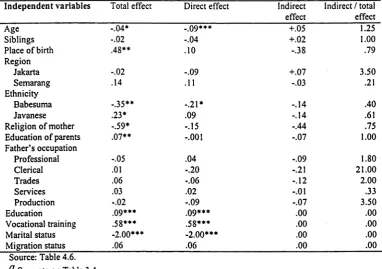
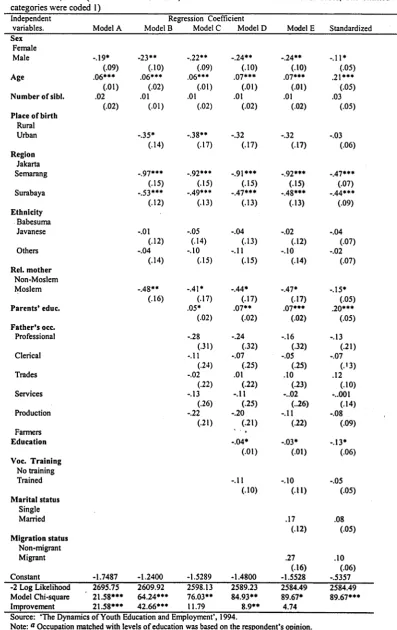
Table 4.5 Logistic regression of the probability of participation in the labour force among male school leavers 15 to 29
years in three cities of Java, 1994... 93 Table 4.6 Logistic regression of the probability of participation in the
labour force among female school leavers 15 to 29
years in three cities of Java, 1994... 98 Table 4.7 Total effect, direct effect and indirect effect of variables
on the participation in the labour force among males
15 to 29 years in three cities of Java, 1994... 101 Table 4.8 Total effect, direct effect and indirect effect of variables
on the participation in the labour force among females 15
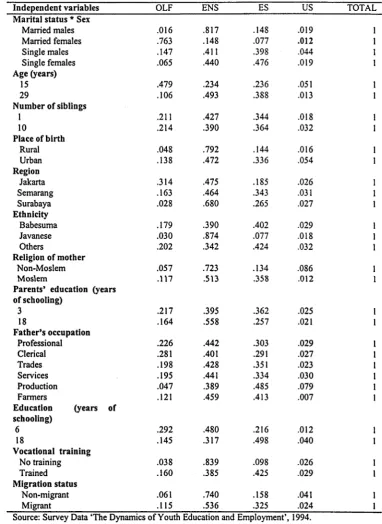
to 29 years in three cities of Java, 1994... 102 Table 5.1 Multinomial logit analysis of (the probabilities) of
Unemployed Search (US), Employed Search (ES), Employed Not Searching (ENS), and Out of the Labour Force (OLF) among school leavers 15 to 29
years in three cities of Java, 1994... 122 Table 5.2. Logistic regression of the probability of finding matched
jobs, school leavers 15 to 29 years in three cities of Java,
1994 ... 127 Table 6.1 Source of job information used by employees 15 to
29 years by education, three cities of Java, 1994... 156 Table 6.2 Job search methods of unemployed job seekers 15 to 29
years by education, three cities of Java, 1994... 156 Table 6.3 Logistic regression of the probability of employees 15 to
29 years being helped by other people in finding their
current jobs, three cities of Java, 1994 ... 158 Table 6.4 Total effect, direct effect and indirect effect of variables
on whether employees 15 to 29 years were helped by other people in finding a job, three cities of
Java, 1994... 161 Table 6.5 Social ties of people who helped employees 15 to
29 years in finding a job by parental background, three
cities of Java, 1994... 164 Table 6.6 Logistic regression of the probability of using connections,
employees 15 to 29 years, three cities of Java,
1994 (N=822)... 167 Table 6.7 Total effect, direct effect and indirect effect of variables
on the probability of using connections among youth
Table 6.8 Logistic regression of the length of unemployment among school leavers 15 to 29 years in three cities of Java,
1994 (N=414)... 177 Table 6.9 Total effect, direct effect and indirect effect of variables
on the length of unemployment period, youth 15 to 29 years,
three cities of Java, 1994... 180 Table 6.10 Respondents’ characteristics, parental background,
unemployment period, job satisfaction and search for alternative jobs, youth 15 to 29 years, three cities
of Java, 1994... 181 Table 6.11 Reasons for accepting unmatched jobs by levels of education,
employees 15 to 29 years, three cities of Java, 1994... 182 Table 8.1 Regression of the probability of occupational attainment
among male employees 15 to 29 years, three cities of
Java, 1994 (N=l 170)... 243 Table 8.2 Total effect, direct effect and indirect effect of variables
on occupational attainment of males 15 to 29 years in
three cities of Java, 1994... 244 Table 8.3 Regression of the probability of occupational attainment
among female employees 15 to 29 years, three cities
of Java, 1994 (N= 856)... 245 Table 8.4 Total effect, direct effect and indirect effect of variables
on occupational attainment of females 15 to 29 years in
three cities of Java, 1994... 246 Table 8.5 Regression of the probability of occupational attainment
among employees 15 to 29 years, who were helped by other people in finding jobs in three cities of Java, 1994
(N= 842)... 258 Table 8.6 Total effect, direct effect and indirect effect of variables
on occupational attainment among employees 15 to 29 years who were helped by other people in finding jobs in
LIST OF FIGURES
Figure 1.1 Status attainment model (Basic model)... 8 Figure 1.2 Status attainment model (Extended model)... 11 Figure 4.1 Probability of participation in labour force by age,
school leavers 15 to 29 years, three cities of Java, 1994 (%)... 94 Figure 4.2 Probability of participation in labour force by religion of mother,
male school leavers 15 to 29 years, three cities of Java, 1994 (%)... 94 Figure 4.3 Probability of participation in labour force by migration status, male
school leavers 15 to 29 years, three cities of Java,
1994 (%)... 94 Figure 4.4 Probability of participation in labour force by region, male school
leavers 15 to 29 years, three cities of Java, 1994 (%)... 94 Figure 4.5 Probability of participation in labour force by fathers’
occupation, male school leavers 15 to 29 years, three cities
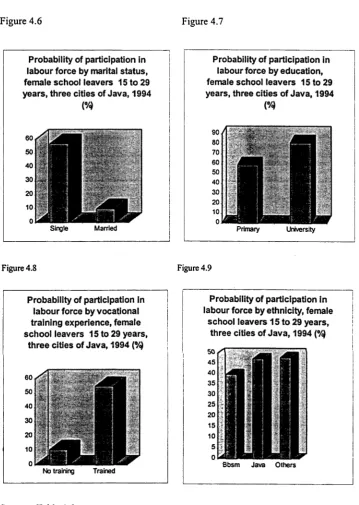
of Java, 1994 (%)... 94 Figure 4.6 Probability of participation in labour force by marital status,
female school leavers 15 to 29 years, three cities of Java,
1994 (% )... 99 Figure 4.7 Probability of participation in labour force by education,
female school leavers 15 to 29 years, three cities of Java,
1994 (%)... 99 Figure 4.8 Probability of participation in labour force by vocational
training experience, female school leavers 15 to 29 years,
three cities of Java, 1994 (%)... 99 Figure 4.9 Probability of participation in labour force by ethnicity,
female school leavers 15 to 29 years, three cities of Java,
1994 (%)... 99 Figure 5.1 Search probability by marital status and sex, school leavers
15 to 29 years, three cities of Java, 1994... 129 Figure 5.2 Probability o f finding matched job by sex, employees
15 to 29 years, three cities of Java, 1994(%)... 129 Figure 5.3 Search probability by age, school leavers 15 to 29 years,
three cities of Java, 1994... 130 Figure 5.4 Probability of finding matched job by age, employees
15 to 29 years, three cities of Java, 1994 (%)... 130 Figure 5.5 Search probability by number of siblings, school leavers 15
Figure 5.6 Search probability by place of birth, school leavers 15 to
29 years, three cities of Java, 1994... 131 Figure 5.7 Search probability by ethnicity, school leavers 15 to
29 years, three cities of Java, 1994... 134 Figure 5.8 Search probability by region, school leavers 15 to 29
Years, three cities of Java, 1994... 134 Figure 5.9 Probability of finding matched job by region, employees
15 to 29 years, three cities of Java, 1994 (%)... 134 Figure 5.10 Search probability by mother’s religion, school leavers 15
to 29 years, three cities of Java, 1994... 136 Figure 5.11 Probability of finding matched job by mother’s religion,
employees 15 to 29 years, three cities of Java, 1994 (%)... 136 Figure 5.12 Search probability by migration status, school leavers 15 to
29 years, three cities of Java, 1994... 137 Figure 5.13 Search probability by parents’ education, school leavers 15
to 29 years, three cities of Java, 1994... 139 Figure 5.14 Search probability by father’s occupation, school leavers
15 to 29 years, three cities of Java, 1994... 139 Figure 5.15 Probability of finding matched job by parents’ education,
employees 15 to 29 years, three cities of Java, 1994(%)... 139 Figure 5.16 Search probability by education, school leavers 15 to 29
years, three cities of Java, 1994... 145 Figure 5.17 Search probability by vocational training experience, school
leavers 15 to 29 years, three cities of Java, 1994... 145 Figure 5.18 Probability of finding matched job by education,
employees 15 to 29 years, three cities of Java, 1994 (%)... 145 Figure 6.1 Probability of employees 15 to 29 years being helped by other
people in finding jobs by religion of mother,
three cities of Java, 1994 (%)... 159 Figure 6.2 Probability of employees 15 to 29 years being helped by
other people in finding jobs by source of job information,
three cities of Java, 1994 (%)... 159 Figure 6.3 Probability of employees 15 to 29 years being helped by
other people in finding jobs by vocational training
Figure 6.4 Probability of employees 15 to 29 years being helped by other people in finding jobs by region, three cities of Java,
1994 (%)... 159 Figure 6.5 Probability of employees 15 to 29 years being helped by
other people in finding jobs by age, three cities of Java,
1994 (%)... 161 Figure 6.6 Probability of employees 15 to 29 years being helped by
other people in finding jobs by sex, three cities of Java,
1994 (%)... 161 Figure 6.7 Probability of using connections in finding a job by
source of job information, employees 15 to 29 years,
three cities of Java, 1994 (%)... 168 Figure 6.8 Probability of using connections in finding jobs by
region, employees 15 to 29 years, three cities of Java,
1994(%)... 168 Figure 6.9 Probability of using connections in finding jobs by
father’s occupation, employees 15 to 29 years, three cities
of Java, 1994 (%)... 168 Figure 6.10 Job information, social ties and help... 172 Figure 6.11 Probability of experiencing a longer unemployment period by
age, school leavers 15 to 29 years, three cities of Java,
1994 (% )... 178 Figure 6.12 Probability of experiencing a longer unemployment period by
sex, school leavers 15 to 29 years, three cities of Java,
1994 (%)... 178 Figure 6.13 Probability of experiencing a longer unemployment period by
education, school leavers 15 to 29 years, three cities
of Java, 1994 (%)... 178 Figure 6.14 Probability of experiencing a longer unemployment period
by vocational training experience, school leavers 15 to 29
years, three cities of Java, 1994 (%)... 178 Figure 6.15 Probability of experiencing a longer unemployment period
by father’s occupation, school leavers 15 to 29 years,
three cities of Java, 1994 (%)... 180 Figure 6.16 Probability of experiencing a longer unemployment period by
parents’ education, school leavers 15 to 29 years, three
cities of Java, 1994 (%)... 180 Figure 8.1 The influence (simplified path) of variables on the occupational
LIST OF APPENDICES
Appendix 3.1 Characteristics of school leavers 15 to 29 years by sex and socio-environmental background in three cities of Java,
1994... 294 Appendix 3.2 Characteristics of school leavers 15 to 29 years by sex
and parental background in three cities of Java, 1994... 294 Appendix 3.3 a Educational attainment of male school leavers 15-29 years by
some explanatory variables in three cities of
Java, 1994... 295 Appendix 3.3b Educational attainment of female 15-29 years by
some explanatory variables in three cities of Java, 1994... 296 Appendix 4.1 Logistic regression of the probability of participation in
the labour force among school leavers 15 to 29 years in three cities of Java, 1994 (The omitted categories are
coded 1)... 297 Appendix 5.1. Multinomial logit analysis of search activities (Parameter
estimates), school leavers 15 to 29 years in three cities of Java, 1994 (US was coded 0, and coded 1 if otherwise)... 298 Appendix 5.2 The procedure of obtaining the probability of searching for job
while unemployed (US) among married females (example)... 299 Appendix 6.1 Percentage distribution of employees 15 to 29 years
who were helped by other people in finding jobs, by some
explanatory variables, in three cities of Java, 1994... 300 Appendix 6.2 Types of help given to employees 15 to 29 years in finding
a job, by some explanatory variables in three cities of Java,
1994... 301 Appendix 7.1 Methodology, location and respondents... 302 Appendix 7.2 Connections and brokerage... 306 Appendix 8.1 Regression of the probability of occupational attainment,
employees 15 to 29 years, three cities of Java, 1994 (N=2096). (Helped by other people was coded 1 and with out other
people’s help was coded 0)... 307 Appendix 9.1 Supply of and placement for labour by educational
CHAPTER 1 INTRODUCTION
1.1. The setting and problems
The New Order government of Indonesia has been trying to develop the country through the Trilogy of development: national stability, economic growth, and income distribution. The educational policy, has its main objectives to equalize educational opportunity, to improve the quality and the relevance of education to the need of development, and improve the efficiency of its management (Djojonegoro, 1994: 3-19); thus education is a means to achieve the national goals. Education, as one of Eight Channels of Distribution (Delapan Jalur
Pemerataan), is also meant to reduce social inequality. Nevertheless, whether
public subsidization of education reduces inequality has not been fully understood. Some evidence from a number of developing countries indicates, however, that the subsidies often favour the rich (Psacharopoulos and Woodhall
1990:272).
In Indonesian, questions regarding the effectiveness of education as a means to reduce inequality are increasingly important for a number of reasons: first, the enrollment rate of pupils aged 14 and above in 1995 has declined relative to the 1980s (Jones et al., forthcoming); second, unemployment among young educated people has rapidly increase in the last decade 1; third, education, in Javanese society in particular, gives less stress to character building on equity, and more emphasis on reproduction of the social order (Mulder, 1985: 39); fourth, educational policy which emphasis efficiency and provides a chance for private sector to create elite schools will be likely to exacerbate class and ethnic
segregation in schooling. Fifth, job acquisition is marked by competition which tends to exacerbate and widen class and ethnic inequalities in occupation.
Given this setting, this study takes young people’s transition from school to work as the entry point for exploring the stratification of young people: the relationships between social origin, education, job-seeking behaviour and occupational attainment.
Three cities, Jakarta, Semarang and Surabaya, were chosen for the study for a number of reasons. The three cities are among the largest cities of Indonesia, -Jakarta and Surabaya are the first and the second largest cities respectively- all this opens a wide range of educational and occupational opportunities and makes these cities migration destinations of people with different characteristics and origin throughout Indonesia. Secondly, as in other cities of Indonesia, the unemployment rate in the three cities has increased during the 1980-1990 period, mainly because of the increase in young job-seekers, with high educational qualification in particular (Ministry of Manpower, 1993:150; Godfrey, 1993:10).
Jones (1993:230) wrote:
The 1990s will be the last decade in which the rapid overall growth o f the labour-force will constitute a major problem, but the problem will be exacerbated in its labour market impact by the additional problem o f absorbing rapidly growing numbers o f educated workers.
Based on these facts, therefore, those three cities are assumed to provide data that could reflect tight competition on schooling and school-to-work transition among young people from different social and economic background. The survey data available from the three cities also provides some variables to study the issue of transition and stratification, including its regional differential.
school-leavers who are taking vocational courses supports the assumption that formal schooling is simply not enough to find suitable jobs. Apprenticeship as part of the ‘link and match’ ideas launched by the Ministry of Education (Kompas,
19 March 1994) is also a symptom of the ineffectiveness of the school system in preparing students to enter the world of employment.
Transition problems will also arise if the education system sets artificial limits to both occupational aspirations and the range of employment opportunities (Blackman, 1987: 29) which do not match the occupational opportunities in the labour market. Occupational aspiration as a key factor in determining people’s self identification as well as social identities is becoming more important but is also critical since their occupational choice is limited in the labour market. How do young job seekers react to the limited demand for labour? How do school- leavers with different social background, sex and education compete in finding an acceptable job? Do they have different strategies and different responses?
In the situation where unemployment rates, the transition period (post school training activities) and difficulties in obtaining ‘stable’ employment are rising, it is likely that this situation will change: first, the timing of the ‘traditional’ life-course of schooling-employment-marriage-independence from parents (housing). Second, traditional social role expectations - males as breadwinners, females as homemakers - will be readjusted into new aspirations.
which in tum encourages the increase of ascribed factors in occupational attainment.
These contrasts, rapidly growing education on the one hand and limited occupational opportunity and the growing role of ascribed factors on the acquisition of jobs on the other hand, may result in the demise of the role of education as a means to achieve equality.
With the growing disparities between educational enrollments and occupational opportunities, it is clear that benefits derived from a given level o f education have declined and may, in fact, have declined differentially for various social, cultural and ethnic groups. Because o f this differential decline, there may be increased differences in the demand o f these various groups for further education, and in the patterns o f selection underlying their access to educational institutions. If it is true, formal schooling will no longer facilitate upward mobility and mediate a redistribution o f wealth, but confirm the advantages o f the most modernized groups, as well as the privileges o f emerging middle and upper classes. In this sense, schools perpetuate existing inequalities (Clignet,
1980: 76).
Under these circumstances, equal opportunity in education for equal opportunity in employment as a political goal is difficult to achieve.
To change this tendency, it is important to understand how social background affects education, and how these factors affect job-seeking behaviour and occupational status attainment, in order to set relevant and effective policies to achieve those political goals.
1.2. Relationships of family background, education and occupation: theoretical perspectives
capable labour in the light of efficiency rather than of kinship. In this traditional functionalist theory, therefore, the role of education in the relationship between social origin, educational and occupational attainment changes when technology changes (de Graaf, 1986). On the other hand, social reproduction theory suggests that the school’s function is unchanged: that it is to legitimate persistent inequality where the education system serves as a socialization process, of inequality in school, for children before commencing socio-economic inequality out of school (Bourdieu and Passeron, 1977).
1.2.1. Human capital theory and modernization theory
Human capital theory assumes that higher expected life time income than the current opportunity cost determines investment in human capital through efforts such as education, on-the-job training, medical care, migration and searching for information (Becker, 1975: 9; Woodhall, 1987: 1-2). Since younger rather than older people and males rather than females are likely to have a longer time to participate in the labour-force to obtain a higher return on the investment, therefore younger and male people are preferable for human capital investment such as in education and seeking jobs (Becker, 1975:64-75). The total amount of investment in human capital also differs among persons because of differences on the demand side, such as purchasing power of parents, and the supply side such as distribution of educational institutions (Becker, 1975:106-107). Human capital theory also predicts that those who have better education will have better skills and are more likely to participate in the labour-force and obtain a better occupation (Hinchliffe, 1987:142). Nevertheless, this theory ignores the role of educational institutions in social and power relations in society.
social and structural factors and the nature of jobs as sources of income differentials are ignored. Human capital theory also lacked an explanation for the role of social and class background in determining the future occupational attainment of individuals.
Although it emphasizes individual characteristics, human capital theory is important, because it not only explains the consequence of investment (future earning or occupation) but also explains the cause. Those who have a better chance to get funds, and are expected to have longer participation in the labour-force and consequently longer time to return the investment, have a better incentive to invest in human capital (Becker, 1975:106-107; Hinchliffe, 1987:142). Human capital implies differentials in the social demand for investment in human capital.
As in human capital theory, functionalist-oriented modernization theorists such as Blau and Duncan (1967) and Treiman (1970), suggest that organizational and technological complexity in modem society increasingly demand an educated workforce. Achieved attributes, such as education, are becoming a ‘universal criterion’ that replaces ascribed values such as race, family background and connections for social selection. Functionalist-oriented modernization theorists emphasize organizational and technological complexity in modem society which determines the demand for an educated workforce (Treiman, 1970) and schools are seen as the most important agency of socialization for creating adult workers for modem institutions (Levin, 1987:151). The industrialization process, therefore, provides a chance for social mobility in which education is seen as the most important vehicle of social mobility.
1.2.2 Social reproduction theories
screening instrument for allocating the workforce in the labour market and to legitimate inequality. Education is seen as an instrument for matching an individual to social and occupational strata. Neo-Marxist sociologists such as Bourdieu and Passeron (1977) view the process of educational differentiation among pupils, as a sorting mechanism ensuring pupils from different class backgrounds reach the educational and occupational levels appropriate to their own class origin (in Brown, 1987:9). According to Blossfeld and Shavit (1993:8-9), reproduction theory emphasizes ‘...education as an instrument by which dominant social elite exclude other classes from attaining desirable occupation’. This could happen because as Okano (1992:15) asserted, schooling plays three roles: dividing people into different levels of education, transmitting dominant values, and legitimating the hierarchy on a meritocratic basis, where ‘merit’ is determined by the dominant culture.
The transition-related problem is seen as a structural problem. That is why radical Marxist sociologists view intervention {ad hoc) programs such as vocational training schemes introduced by the elite as ‘additional means to social control’ which cannot solve the transition problem. Resistance theory by Neo- Marxist sociologists such as Apple (1979) however, argues that the school’s function in reproducing values determined by dominant classes or economic forces is never complete, because schools have relative autonomy and pupils from different classes also have a resistant culture. Resistance theory implies that the root of the transition problem may be found in a broader perspective that is in the interaction of youth in the family, the school and the community.
1.3. The status attainment model
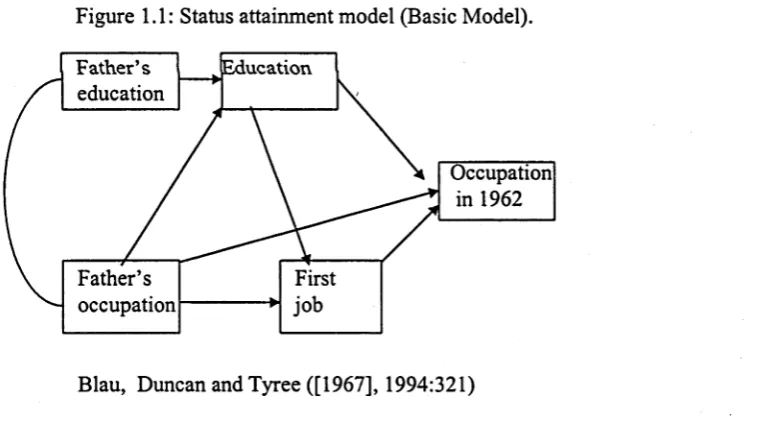
incorporating several contradictory theories on the mechanisms governing the stratification process, and to estimate the relative importance of social origin and education and their interrelationships in a particular population (Duncan, 1968, in Bielby, 1981:5). In this sense, the status attainment model is a corridor which some theories could enter and explain the mechanism of the transmission of socio economic status from one generation to another. The status attainment model, according to Sewell and Hauser (1975:50), postulates that
socioeconom ic background affects mental ability, that background and ability affect educational attainment, that background, ability and education affect occupational achievement, and that all o f the preceding variables affect earnings...[The status attainment model]...exhausts the influence o f fundamental conditions o f ascription and achievement...., factors o f luck or chance are implicated in the process o f achievem ent... (Sewell and Hauser, 1975:184).
In the work of Blau, Duncan and Tyree ([1967] 1994), as shown in Figure 1.1, the status attainment model puts education as an intermediate variable which links background and occupation.
Figure 1.1: Status attainment model (Basic Model). Education
Father’s education
Occupation in 1962
Father’s occupation
Blau, Duncan and Tyree ([1967], 1994:321)
[image:24.511.73.453.387.599.2]1.4. Status attainment model: limitations and its extension
The status attainment model is criticized as ‘theory-laden’ and linked to a functionalist theoretical framework (Horan, 1978:536), because, as with the human capital theory, the status attainment model emphasizes individual factors and ignores the influence of structural factors on achievement or attainment. Nevertheless, there are arguments defending the status attainment model as an approach which indirectly incorporates the structural factors in the model. Attainment studies are designed to measure the magnitude of organizational influences of family and education, factors which are clearly ‘structural’ in the sociological sense and occupation as the dependent variable is not divorced from the influence of organization since detailed occupations circumscribe the organizational promotion ladder (Baron, 1994:388). Another argument is that, in a situation where the free market and deregulation of markets have been attempted to boost efficiency, contest mobility and meritocratic values seem likely to homogenize, rather than to heterogenize— the organizational behaviour of school and labour markets, which in turn, result in a decrease in the significance of organizational issues in this study.
Another criticism of human capital theory and the status attainment model is made by Granovetter:
The two traditions that dominate current research in sociology and economics - status attainment research and human capital theory, respectively - are curiously similar in their nearly exclusive attention to characteristics and decision o f individuals and their neglect o f the nature o f jobs and matching process....how such ‘resources’ are ‘converted’ to income is here merely begged, and we are left with the assertion that individual characteristics generate income^ (1994:372).
Indeed, the vacancy competition model (Thurow, 1975) emphasizes the matching process and the role of educational qualification in the matching process. Nevertheless, vacancy competition model seems to neglect non-educational factors,
2 Criticism toward human capital theory is also made by the Vacancy competition model
parental background in particular, in the job allocation of children. The role of parents in job acquisition for their children, especially where unemployment is high among educated people, is very important. As Bourdieu (1986:147) pointed out, as a result of mass education and high unemployment among educated people, a struggle involving strategies of parents, of high occupational status in particular, to help their offspring to inherit their social class, is one of the most important factors in the transformation of social structures.
The specific contradiction o f the scholastic o f reproduction lies in the opposition between the interests o f the class which the educational system serves statistically and the interests o f those class members whom it sacrifices, that is the ‘failures’ who are threatened with ‘de-classem enf for lack o f the qualifications formally required o f rightful members... The individual substitution strategies which one group may employ to try to escape down-classing and to return to their class trajectory and those which another group employs to rebuild the interrupted path o f hoped -for trajectories, are now one o f the most important factors in the transformation o f social structure.
Unlike human capital theory (Becker, 1975) which only indirectly relates the parental background to the rate of return on education through the amount invested for searching for job information, reproduction theory (Bourdieu, 1986:134) asserts that... ‘the rate of return on education capital is a function of the economic and social capital that can be devoted to exploiting it’ (italics added).
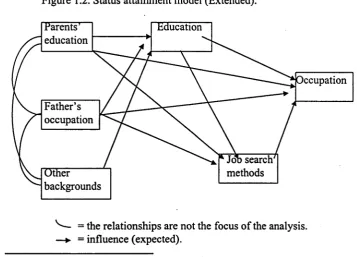
Based on the above explanation, therefore, there is a theoretical reason to include the ‘matching process’, job search methods in particular, in the status attainment model to answer how individual characteristic (educational resource) is converted to job or income: a question that, according to Granovetter (1994:372), is merely taken for granted by human capital theory and early status attainment model (Figure 1.1). Through this ‘extended model’ (see Figure 1.2) we can examine how parental background and education determine the job-search methods and their relative importance in occupational attainment.
The job search methods and labour-force participation are explored in this study, because both job-seeking behaviour and labour-force participation are regarded as factors in the stratification.
The inclusion in the study of the issues of job-seeking behaviour and labour-force participation among young people in particular is important for other reasons: first, different participation in the labour-force between males and females results in inequality between them (Semyonov, 1980:542 ). Second, job-seeking behaviour, in the younger ages in particular, was regarded as behaviour which results in high mobility and rapid income growth (Parsons, 1991:597). Third, job seeking behaviour has rarely been studied in developing countries.
According to Banerjee and Bucci (1995:565) no one in a developing country has studied and tested the theory of search behaviour. Banerjee and Bucci (1995) examined determinants of job search among employed migrants in India, and Fergus (1992) studied the issue in Indonesia, but in contrast to this study, they did not include parental background in the analysis^.
Figure 1.2. Status attainment model (Extended). Parents’
education
'ccupation Father’s
occupation
Job search methods Education
Other backgrounds
Vv— = the relationships are not the focus of the analysis. —► = influence (expected).
[image:27.511.68.426.471.728.2]Other background includes place of birth, religion, and ethnicity.
Job search methods = source of job information, the availability of help given by other people, types of help, social ties of helpers.
1.5. Theories on job-seeking behaviour.
From Bourdieu’s formula that practice = (habitus x resource) + field, Okano derived a specific theory of job-search practice. According to Okano (1992:206) a student's decision making and the acquisition of job result from the interaction between the student's habitus (way of thinking, values and pattern of interpretation) and available resources (in school, the family and the employment market). Habitus is an acquired system of generative schema, which generate perceptions, including perceptions toward occupation, thoughts, expressions and actions (Bourdieu and Passeron, 1977:72-95).
Their capital or resources consist of four types: cultural capital, including linguistic or ethnic identity and educational capital; social capital, such as social network or family background and the family network of the job-seekers; symbolic capital, such as involvement of job-seekers in school or out-of-school organizations; and economic capital, financial support for job search) (Okano, 1992:206). Some aspects in which the interaction between the job-seeker's habitus and the available resources are manifest, are labour mobility: entering or moving out of the labour-force; method used in job acquisition; occupational and spatial mobility; and the length of the job-search period.
1.6. Aims of the study
labour-force, job search behaviour and occupational attainment. The aims of the study are:
1. to identify the determinants of educational attainment, labour-force participation, job-seeking behaviour and occupational attainment among youth aged 15 to 29
years in three cities of Java;
2. To identify the job search process among young employees (qualitative research in Semarang).
The application of the status attainment model (Bielby (1981:5) to the first aim of this study will reveal the stratification process of the people in the sample.
1.7. Hypotheses.
1) Young people with parents who have higher levels of education and occupation are more likely to attain higher education qualification and occupation and to have smoother school-to-work transition than those whose parents have lower levels of education and occupation. One of the reasons is that the former are likely to have better social and cultural resources and economic supports from their parents than the latter.
2) In a condition of high unemployment among educated people, many educated people are entering jobs that are mismatched with their aspiration. Therefore, employed youth who have high educational qualifications are more likely to search for alternative jobs while employed. One of the reasons is that they have wider job dispersions and higher present value of expected returns than youth with lower educational qualifications or older workers.
competitiveness in finding jobs while those with parents of high socio-economic status can receive help from them in finding a job.
4) Youth with high educational qualifications are more likely to find jobs through weak social ties, such as friends, and impersonal networks, such as advertisement, while those with low educational qualifications are more likely to seek a job through strong social ties, such as families. One of the reasons is that young people with high educational qualifications can search for a job more intensively; they have wider social contacts and access to impersonal networks.
From the survey data, it was only possible to describe the correspondence of several variables, if any, to the transition and job-seeking behaviour among youth. However, it is still not known how school, family background and other factors considered in the study actually reproduce or produce social inequality in the stratification of educational attainment, job acquisition and employment attainment. It is in the interest of the study to explain how those variables, especially family background and education, reproduce inequality in their aspirations, and ways of seeking and attaining jobs. Therefore, ethnographic study is necessary to achieve this purpose.
1.8. Contribution to the body of knowledge
developing countries. Unlike in Japan where the three parties, parents, school, and employers, sit together for coping with the transition problem, this policy does not exist in developing countries. Major factors which create the transition problem - combined factors of the high speed of educational expansion and labour-force growth with lack of the three parties network - do exist in many developing countries, including Indonesia. A study on the transition from school to work and job-seeking behaviour in a developing country, therefore, is expected to contribute
a different picture.
Second, besides describing the correspondence between family background, educational attainment and employment attainment, this study also focuses on job-seeking behaviour. This study contributes a picture of the matching process, which is ignored in many of the studies using the status attainment and human-capital model.
1.9. Relevance to policies
opportunity’ cannot be achieved merely through mass education. The relevant policy initiatives need to consider demographic and parental socio-economic factors.
1.10. Sources of data
The main source of data available for the study is the data survey ‘The Dynamics of Youth Education and Employment: Education and Employment among Youth (15-29 years) in Urban Areas’ (Pendidikan dan Ketenagakerjaan
Penduduk Usia Muda (15-29 Tahun) di Daerah Perkotaan) conducted by PPT-LIPI
in 1994. The survey was conducted in three cities of Java: Jakarta (1750 respondents), Semarang (500 respondents) and Surabaya (750 respondents). The
1980 and 1990 census data are supplementary sources of information.
Census data analysis identified that the ‘youth problem’ is concentrated in Java, so the three big cities in Java were chosen purposively because in geographical terms those three cities are assumed to represent the socio demographic picture of urban youth of Java in particular and Indonesia as a whole. From 10 municipalities available in the three cities, 10 sub-municipalities were chosen in the first stage and 10 sub-sub-district levels were chosen in the second stage based on the density of the population. Systematic random sampling technique was used to choose 104 units of sub-sub-sub district (Rukun Wilayah), 1001 units of Rukun Tetangga (the smallest administrative unit), and 5252 eligible respondents. Systematic random sampling technique is also employed to obtain 3000 respondents out of 5252 eligible respondents (Tirtosudarmo, Noveria and Rusman, 1995:13-14).
siblings, marital status, religion and ethnicity. Family background consists of parents’ education and father’s occupation. Parents’ education was obtained through transforming the categorical data of father’s and mother’s education into continuous data as years of schooling, summing both parents’ years of schooling and then dividing by two. Parents’ education was chosen rather than only father’s education or mother’s education because both father’s and mother’s education are considered to have important impacts on both educational attainment and the transition from school to work of the children.
Educational attainment is measured by number of years in school. Job search behaviour is obtained from data on labour-force status and search modes, while search methods cover information on source of job information, length of unemployment, whether the employees were helped in finding a job, the characteristics of helpers, and types of help.
Occupational attainment data are in continuous form, is measured by Standard International Socio-Economic Index of Occupational Status (Ganzeboom, de Graaf, Treiman and de Leeuw, 1992). Further details of this Index will be explained in Chapter 8. This study includes a qualitative survey to collect data on the process of seeking jobs among respondents with different levels of education and parental occupations.
1.11. Limitations of the data
There are at least five limitations to the data. First, the survey data lack information on the structural aspects which provide the magnitude and type of job available that certainly have affected the aspirations, behaviour and attainment of young people.
most of the respondents are likely to have the sequence of schooling, getting a job and marriage, any deviation or variation in the sequence is likely to have different effects on the correspondence between family background, educational attainment, and employment attainment. However, since the focus of this study is not the order of events or the variation in the sequence of transition from school to work, but the correspondence between family background, educational attainment, job-seeking behaviour and employment attainment, the absence of such data will not be a major problem.
The third limitation is that there is no information on public and private sectors. Usually there are clear differences in recruitment procedures between the private sector and the public sector, and people behave in different ways for different targets of their job searches. Information on these differences is not in a form that enables us to examine this behaviour. However, since the data on occupation were coded in a Socio-Economic Index of Occupational Status, in which data are treated in continuous and hierarchical order(Ganzeboom et al., 1992), the problem of formal-informal sectors and dual labour market will be solved within the occupational order, assuming that formal sector and modem- sector occupations tend to be in the higher order.
The fourth limitation is that each respondent is restricted to choosing only one, the most important, method in searching for jobs. Besides the fact that this single option may not be realistic because many of those who seek or have found jobs have used multiple methods, there is no information to examine the types of combined methods used by different groups and which one is the most effective method.
education is assumed to affect children’s occupational attainment, through the provision of the 'old-boys network’ of parents’ as well as children’s education.
1.12. Qualitative data
Qualitative data were collected in two months in Semarang in 1996. The purpose of the in-depth interview with 30 respondents is to explain the process of job search among youth with different typologies. Beside youth in the survey, key informants, such as job brokers, parents and personnel managers, in public as well as private sectors, were also interviewed.
The case study population was drawn from respondents in the survey and stratified on the basis of the key differentials identified in the macro analysis. Individual samples were selected at random from each stratum. Random sampling is used merely to eliminate unnecessary bias in the selection procedures and it does not imply statistical representativeness.
The in-depth interview is directed towards the following problems or questions: (1) the process of searching for jobs among youth since leaving school.
(2) Is there any effect of different sex, family background and educational background on the patterns of job-seeking behaviour? (3) In what ways do the patterns of job-seeking behaviour of males differs from the pattern of females, high family backgrounds differ from the lower ones, and the more educated from less educated background?(4) What are the reasons?
1.13. Methodology
As in the work of Sewell and Hauser (1975:11, 49-53^), regression methods are also used for analyzing direct and indirect effects of independent variables in causal models or path models of the status attainment process. To analyze search behaviour multinomial logit technique is used.
Cross-tabulation is used to analyze the trends in education and employment among youth (Chapter 2). Multiple regression is applied to analyze the effect of variables on educational attainment (Chapter 3) and occupational attainment (Chapter 8). Logistic regression is applied to analyze the effect of variables on labour-force participation and job-search method (Chapter 4 and 6) and multinomial logit is used to analyze job-search behaviour (Chapter 5). The process of searching for jobs (Chapter 7) is based on life history data, therefore ethnographic methods are used.
1.13.1. Multiple Regression
Y i =bo + b \* X \j + 62*X2j + ...bkXk + ei
where Y i = dependent variable (continuous variable) bo = intercept.
bi = the average change in Y caused by a unit change in XI, controlling for all variable X2 to Xk
Multiple regression is, according to Soeradji and Hatmadji (1982:15), part of multiple classification analysis, making it possible to use non-continuous variables as independent variables and to know the effect of each of the independent variables on the dependent variable. Multiple regression can show the total effect and direct effect of each independent variable, after it was controlled by other variables. Therefore the technique of path model can be used (see Sewell and Hauser, 1975:49-53).
Employing the null hypothesis, the change in R squared indicates the magnitude of the additional fraction explained by the inclusion of variables in the model. In this ‘additive model’, the significance of the additional fraction explained by additional regressors included in the model (A R squared) was tested by partial F-test.
A R squared/ q
A F = ...
(1 -R squared) / (N- p - 1)’ where :
A R squared = the change in R squared across models
A R squared/' q = the average increase in R squared of regressors
(1-R squared) = the unexplained proportion of variation after the addition of q regressor in the model.
(N - p - 1) = the degrees of freedom in the unexplained variation, where N = the number of cases in the equation
p = the number of independent variables in the equation q = the number of additional variables put in the more
complex model.
This ‘hierarchical strategy’, in this study, where the causally prior variables are put in advance, as in Soeradji and Hatmadji (1982-.15), assumes that the order of events should be reflected in the order of variables in the model. So sex, age, and number of siblings were basic variables of the respondents where the influence on the educational attainment comes before the influence of socio- environmental factors, such as place of birth, region, ethnicity, and religion and where these later variables also influence parental background variables. Migration and marriage tend to be experienced by the respondent in the later ages, so these variables were put in the last order.
1.13.2Logistic regression.
normal distribution, logistic regression technique is used. Independent variables predict the odds of an event occurring, for example participating in the labour- force. The maximum likelihood method is used to estimate the model parameters.
The logistic regression employed in this study is multivariate logistic regression (see Gray, 1994: 163-169). In this method, an ordinal variable is treated as a categorical variable. The last sub-category of either the ordinal or categorical variable was treated as the reference category. Nevertheless, the estimate parameter of the omitted sub-category can be obtained. The value of the estimate parameter of the omitted sub-category is minus the total of the parameter estimates of the sub-categories of the respective variable (Gray, 1994:165; Norusis, 1992:13). Logistic equations are of the form:
In (p/ (l-p))= b o + b 1*X. (equation (1)).
where p is the probability that - in this case the individual will participate in the labour-force.
b o is the intercept term, bl is the change in the log odds for a unit change in variable X, controlling for other variables.
Based on the log odds of a particular variable obtained by equation (1), we could obtain the probability by entering the log odds into the following equation.
exp. (log odds) Probability =
---1 + exp. (log odds) (Gray, ---1994:---169)
To assess the magnitude of the fraction explained by the independent variable included in the model, we could subtract the likelihood ratio chi-square ( or -2 log likelihood) of the initial model by the likelihood ratio chi-square in which the independent variable under study was included in the model. Later, this value, called ‘improvement’, informs us about the worthiness of the change caused by the effect of independent variable under study.
1.13.3. Multinomial logit
Job-seeking behaviour shows that an individual has a chance to be employed and not searching for a job (ENS), employed but searching for job (ES), unemployed searching for job (US) and out of the labour-force (OLF). In this regard, the dependent variable, job-seeking behaviour, is neither continuous (when multiple regression is usually employed) nor dummy (when logistic regression is usually employed). The appropriate technique to analyze job-seeking behaviour is the multinomial logit method (Amemiya, 1985; Judge, Griffiths, Hill and Lee, 1980: section 14.4; Fergus, 1992: 82-85).
The individual’s chance of being in the ES, ENS, or OLF categories is estimated as follows;
lo g e i ^ e s ^ ~ ^ es ^ e s‘ (1)
en s ^ — ^ en s ^ e ens' (2)
( P o l f / P J ~ ^ o I f^ **" ^o l f (3)
In those equations ‘unemployed search (US) ’ is used as the reference category. In equation (1) the dependent variable is equal 1 if the person was ES, equal 0 if the person was US.
In equation (2) the dependent variable is equal 1 if she or he was ENS, equal 0 if she or he was US.
Xi = independent variables included in the equations, consists of individual characteristics, parental and socio-environmental background, and educational attainment.
The probability of an individual of being ENS, ES, US and OLF, is obtained by applying the estimated parameters in the equation (1), (2) and (3) into the following equations (Fergus, 1992:85).
1
P (US) = --- (4) 1 gXi cc es ^Xi cc ens _j_ ^Xi a olf
gX i cc es
P (ES) = --- (5) 1 -j_ ^Xi a es ^Xi a ens ^Xi cc olf
£,Xi cc ens
P (ENS) = ... (6) ^Xi a es ^Xi cc ens ^Xi a olf
e X\ a olf
P (OLF) = ... (7) gXi a es gXi ccens ^X\ cc olf
The parameter estimates of a es , a ens , and a 0/y (see Appendix 5.1) were based on equations (1), (2) and (3).
As in the case of logistic regression, the equations, however, could only produce the probabilities of those that were coded (1), that were categories that were not included in the reference category. To obtain the probability of each category of the reference category (that was coded 0), the category needs to be switched to 1,
CHAPTER 2
EDUCATION AND EMPLOYMENT TRENDS DURING 1980-1990
2.1. Introduction
This chapter aims to explore the background of the transition problem, which mainly consists of the interrelation of demographic, educational and socio economic factors.
Those three aspects are manifested in the growing number of new entrants in the labour force, the rapid increase in educational level of the labour force and the increase in the non-agricultural sectors. These demographic, educational and economic developments are interrelated in complex and not fully understood ways (Cobbe and Boediono, 1993:2).
difficult to achieve because of unbalanced growth between educated job seekers and suitable job opportunities for them.
The problem of the transition from school to work, therefore, can be seen as a symptom of three kinds of structural problems which are interrelated. The transition from school to work is becoming more difficult because the problem lies, not only at an individual level, but also at a structural level. The more difficult the transition from school to work, the greater is likely to be the involvement of social and class relations in establishing job-seekers in work. Therefore it is not surprising if in developing countries, as mentioned by Simmons (1980:37), political and familial criteria are often used to screen job seekers; this creates difficulties in the market mechanism to reduce unemployment.
2.2 Educational policy: quantity first
Similar assumptions have also been adopted in Indonesia. Under the Sukarno government, however, the education system was the locus of fierce competition between religious education and secular education and between general and vocational education. Under the New Order government since 1966, which is more pragmatic in its approach, the ideological issues have been relatively dormant for some time, but the issue then shifted to another front: whether the education system’s main function is to serve industry. Not only did the issue originate from one of the main policies of the New Order government to give priority to economic growth, but the issue has increased in importance since the Pelita II (The Second Five Year Development Plan, 1973-78) owing to the increase in urbanization. While this educational policy debate continues, nevertheless, there was an agreement that children needed more access to all levels of education. Supported by the government’s success in economic development, resulting from the ‘oil boom’ in the 1970s in particular, this need has been realized in the rapid growth of educational institutions at all levels, but without substantial change in the character of the curriculum, which continued to emphasize humanities and arts. The educational policy seems to be one of ‘quantity first’. In recent years the issue of the ‘quality’ or the relevance of education to development needs has been given more emphasis, mainly because of the growing number of unemployed among educated people (Santoso^, 1993; Drost, 1993; andBuchory, 1993).
has been seen as profitable for individuals and on the other hand, the government had assumed that economic growth could not be achieved without a sufficient high-level manpower. Private institutions of higher education have also multiplied because this has been seen as a lucrative business. However, in the current situation, the rapid growth of higher education institutions seems to be caused by a new situation in which the increasing number of job seekers with more education is inducing employers to increase the level of education qualification as part of the entry criteria, thus forcing parents and children to attain a higher educational qualification to effectively realize their high occupational expectations.
One of the results has been the rapid increase in the number of school pupils at all levels of education. In Jakarta, Central and East Java provinces, the education attainment of the urban youth has also increased markedly. Table 2.1 shows that in the 1980-1990 period, there has been a decrease in the proportion of young people with primary educational qualifications and below, and on the other hand a sharp increase in the proportion of young people with secondary and higher education qualifications.
Table 2.1.
Percentage distribution o f highest educational attainment o f urban youth 15 to 29 years by province, 1980 and 1990.
Educational Attainment
P r o v in c e Below
Prima ry
Pri mary
Junior second ary
Senior second ary
Acad emy
Uni versity
T otal %
N ( 0 0 0 )
J a k a r t a
1 9 8 0 2 6 .8 3 1 .7 2 0 .7 1 9 .2 1.1 0 .4 100 2 0 5 5
1 9 9 0 1 0 .7 2 7 .1 2 7 .2 3 0 .8 2 .2 1.9 100 2 9 7 1
C e n t r a l J a v a
1 9 8 0 3 1 .0 3 1 .7 2 1 .8 1 4 .5 0 .6 0 .3 100 1 4 1 5
1 9 9 0 1 4 .7 3 1 .1 2 6 .8 2 4 .5 1.7 1.3 100 2 2 7 3
E a s t J a v a
1 9 8 0 2 9 .4 3 2 .9 2 1 .8 15.1 0 . 6 0 .3 100 1 7 6 8
1 9 9 0 1 2 .2 2 7 .9 2 7 .7 2 8 .8 1.4 2.1 100 2 8 8 3
I n d o n e s ia
1 9 8 0 2 7 .4 3 2 .5 2 2 .4 1 6 .5 0 .8 0 .4 100 1 0 4 2 4
1 9 9 0 1 2 .2 2 7 .3 2 8 .0 2 8 .9 1.7 1.6 100 1 8 1 8 4