This is a repository copy of Does the School Fruit and Vegetable Scheme improve children’s diet? A non-randomised controlled trial.
White Rose Research Online URL for this paper: http://eprints.whiterose.ac.uk/79618/
Version: Accepted Version
Article:
Ransley, J, Greenwood, DC, Cade, JE et al. (6 more authors) (2007) Does the School Fruit and Vegetable Scheme improve children’s diet? A non-randomised controlled trial. Journal of Epidemiology and Community Health, 61 (8). 699 - 703. ISSN 0143-005X
https://doi.org/10.1136/jech.2006.052696
Reuse
Unless indicated otherwise, fulltext items are protected by copyright with all rights reserved. The copyright exception in section 29 of the Copyright, Designs and Patents Act 1988 allows the making of a single copy solely for the purpose of non-commercial research or private study within the limits of fair dealing. The publisher or other rights-holder may allow further reproduction and re-use of this version - refer to the White Rose Research Online record for this item. Where records identify the publisher as the copyright holder, users can verify any specific terms of use on the publisher’s website.
Takedown
If you consider content in White Rose Research Online to be in breach of UK law, please notify us by
Does the School Fruit and Vegetable S
cheme improve children’s diet?
A
non randomised controlled trial
JK RANSLEY,Lecturer in Nutritional Epidemiology1, DC GREENWOOD, Lecturer in Medical Statistics2, JE CADE, Professor of Nutritional Epidemiology and Public Health1, S BLENKINSOP, Senior Research Officer3, I SCHAGEN, Head of Statistics Research and Analysis Group3, D TEEMAN, Senior Research Officer3, E SCOTT, Statistician3 , G WHITE, Research Officer3 AND S SCHAGEN, Principal Research Officer3
1
Nutritional Epidemiology Group, Centre for Epidemiology and Biostatistics, University of Leeds, 30-32 Hyde Terrace, Leeds LS2 9LN, United Kingdom
2
Biostatistics Unit, Centre for Epidemiology and Biostatistics, University of Leeds, 30-32 Hyde Terrace, Leeds LS2 9LN, United Kingdom
3
National Foundation for Educational Research, The Mere, Upton Park, Slough, Berks SL1 2DQ, United Kingdom
Correspondence to: JK Ransley, Nutritional Epidemiology Group, Centre for Epidemiology and Biostatistics, University of Leeds, 30-32 Hyde Terrace, Leeds LS2 9LN, United Kingdom; Tel. + 44 113 34 36990; Fax. + 44 113 34 34877: E-mail:
Keywords: School; children; diet; fruit; vegetables
ABSTRACT
Objective: Evaluation of the impact on diet of the school fruit and vegetable scheme (SFVS).
Design: Non-randomised controlled trial.
Setting: Infant and primary schools in the north of England.
Participants: 3703 children aged four to six years (reception, year 1, and year 2).
Intervention: One portion of fruit or vegetable provided per child on each school day
between February and December 2004.
Main outcome measures: Fruit and vegetables consumed and intake of nutrients.
Results: The SFVS was associated with an increase in fruit intake across reception and
year 1 pupils of 0.4 portions (95% confidence interval, 0.2 to 0.5) and 0.6 portions (0.4 to 0.9), respectively, at three months, which fell to 0.2 (0.1 to 0.4) and 0.3 (0.1 to 0.6) at seven months. In year 2 it was associated with an increase of 0.5 portions (0.2 to 0.7) of fruit at three months, which fell to baseline values at seven months when these children were no longer eligible for the scheme. Overall, at seven months there were no changes in vegetable
consumption, no associations between the SFVS and energy, fat, or salt intake, and small changes in carotene and vitamin C intake.
Conclusions: The SFVS promoted an increase in fruit intake after three months. At seven
INTRODUCTION
Research suggests that young people do not consume enough fruit and vegetables to benefit their health. The National Diet and Nutrition Survey of 4 to 18 year olds revealed that most young people consume less than the recommended daily amount of fruit and vegetables. Overall, one in five children ate no fruit, and three of five ate no green
leafy vegetables during a usual week.[1]
There is convincing evidence that a low intake of fruit and vegetables is a risk factor for cancer and cardiovascular disease in later life.[2–5] Tackling these diseases is a government priority, as they account for 60% of all early deaths in England.[6 7]
The NHS Plan focuses on strategies for preventing cardiovascular
disease and cancer. A key component of the plan is to improve diet and nutrition. It states that, ‘‘eating at least five portions of fruit and vegetables a day could lead to estimated reductions of up to 20 per cent in overall deaths from chronic diseases’’. Apart from a reduction in smoking, an increase in fruit and vegetable consumption is considered the most effective strategy for reducing the risk of cardiovascular disease
and cancer.[8]
Despite convincing evidence of the preventive health effects of a diet rich in fruit and vegetables, the average UK consumption is only three portions per day.[9] It has been noted that consumption of fruit and vegetables is lower in low compared with high socioeconomic groups, and is particularly low in children.[1 9]
The SFVS is the largest scale intervention in English children’s diet since the introduction of free school milk in 1946. Since November 2004 a free piece of fruit or vegetable has been provided to children aged four to six years on each school day. The scheme aims to distribute 440 million pieces of fruit and vegetables each year to over two million children in 18 000 schools. It has cost £42 million to set up and has received a further £77 million from the Department of Health to run until 2006.[10]
The SFVS presents the hypothesis that providing free fruit and vegetables for schoolchildren aged four to six will improve their overall consumption of fruit and vegetables by up to one portion a day, with subsequent associated improvement in nutrient intake. Two key aims of this research were therefore to evaluate the impact of this intervention on children’s consumption of fruit and vegetables, and to assess their intake of nutrients.
A randomised controlled trial was not possible because the roll out of the SFVS across English schools was at an advanced stage by the time the evaluation study was commissioned. This left too few regions from which to randomise a control and intervention group. For logistical reasons every school in a region had to start the scheme at the same time, so we could not randomise at the school level either. A non-randomised design was therefore used.
METHODS
Study Design
Sampling method
The intervention schools were randomly sampled from a list of all primary schools in the North East Region, stratified on the following background criteria to ensure the sample was representative of English schools: local education authority (LEA) type (rural/metropolitan); school type (infant, primary); key stage 1 attainment (based on an examination of the number of pupils achieving level 2 at key stage 1); percentage of pupils with free school meals (FSME); percentage of pupils defined as having special educational needs (SEN); and percentage of pupils with English as an additional language (EAL).
A control sample was drawn and frequency matched on the same criteria. The required total sample size of 1800 children was calculated to provide a power of 95% to detect a difference of 0.5 portions of fruit or vegetables consumed between the two groups. The data used to calculate the sample size were derived from a previous study where the fruit and vegetable intake of children aged four to seven years was recorded.[11] The following parameters were used to estimate the sample size: standard deviation of outcome (portions of fruit and vegetables)=2.04, intra-class correlation=0.15, pupils per class=8, giving a design effect of 2.05.
Two hundred and five schools were contacted at the beginning of the spring term 2004, and invited to take part in the evaluation. Only pupils for whom a signed consent form was received from a parent or guardian were eligible to take part in the evaluation. Three phases of data collection were scheduled for the evaluation. The CADET was administered to each cohort of children on three separate occasions—that is, longitudinally. They were March (phase 1), June (phase 2), and November (phase 3) of 2004. Shortly after the baseline dietary assessment (phase 1), the SFVS was rolled out to all schools in the intervention group but not the control group.
Intervention
The intervention comprised a daily piece of fruit or vegetable offered to pupils in reception, year 1 classes, and year 2 classes. A rota was devised of fruit and vegetables, pre-tested for their suitability in terms of their acceptability to children, any health and safety issues relating to risk of choking and anaphylaxis, and ease of preparation and storage within the school. The rota of items included apples, pears, easy to peel citrus fruit, bananas, and occasional seasonal items such as strawberries in the summer months. Carrot sticks and small tomatoes were also included in the rota from time to time. Vegetables are more difficult to provide as a break time snack as they tend to require more preparation and are not so acceptable as a snack food as a piece of fruit.
In addition, educational materials and activities relating to the benefits of eating fruit and vegetables developed as part of the SFVS were promoted to schools taking part in the intervention. These included an introductory training video for teachers, wall charts, cooking activities, and games for children. Information relating to the benefits of eating fruit and vegetables was also made available to parents as part of the wider 5 A DAY scheme.[10]
Dietary assessment
assessment tool and records a child’s dietary intake over 24 hours. It is based on a tick box design, completed by adults on behalf of children. It has been validated for use with young children between the ages of four and seven years. The validation study compared the CADET with a 24 hour semiweighed food diary obtained from the same children for the same day and shows a close association with usual diet. Correlation coefficients comparing CADET with diary ranged from 0.44 to 0.89 for foods and from 0.41 to 0.68 for nutrients.[11] Repeatability and reliability of the CADET were also determined in a subgroup of the same validation study, giving an intraclass correlation between CADET and diary for change in fruit and vegetable consumption of 0.72 (95% confidence interval (CI), 0.54 to 0.89).
Statistical analysis
Multilevel modelling was used to assess the impact of the SFVS, allowing for the structure of the data by taking account of five levels in our model: local education authority, school, class, pupil, and time point. Adjustment was made, where necessary, for the following pupil level and school level variables:
Pupil level: sex (boy or girl); year group (reception, year 1 or year 2); ethnicity (white UK or minority ethnic); time point (phases 1, 2, or 3); lunch arrangement (whether they usually have a packed lunch, go home for lunch, or have a school dinner); percentage of people in the post code area aged 16 to 74 years with no qualifications (census data); percentage of people in the post code area not in good health (census data); overall deprivation index (census data).
School level: intervention or comparison group; school type (infant or primary); percentage of pupils with SEN; percentage of pupils with EAL; percentage of pupils eligible for free school meals; key stage 1 average attainment (banded).
RESULTS
Ninety eight schools (53 intervention and 45 control) participated in the study at baseline; 49 and 43 schools in the intervention and control groups, respectively, completed all three phases of the study, thus meeting the achieved sample targets (fig 1).
At phase 2, 2045 (78%) of the 2622 CADETs dispatched to the intervention group were returned. In the control group, 1648 (78%) of the 2113 CADETs dispatched were returned. Both the response rate and the return rate of CADET were within the range allowed in the power calculation.
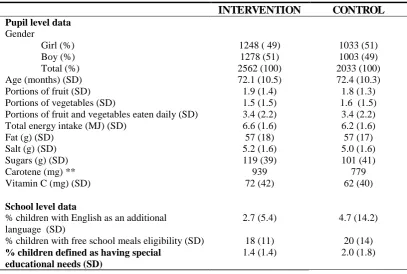
At baseline the intervention group was similar to the control group in terms of sex, age, and intake of fruit, vegetables, fat, and salt (table 1). The intervention group had significantly
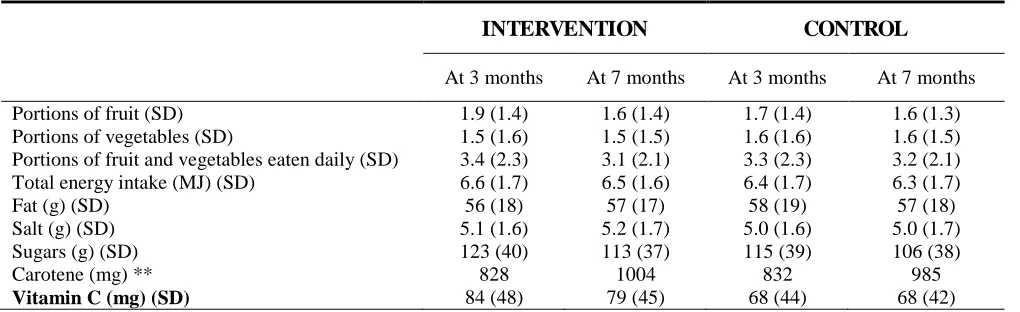
higher intakes of total energy, sugars, carotene, and vitamin C, indicating the importance of adjustment for baseline intakes in the multilevel models. Unadjusted results are shown in table 2.
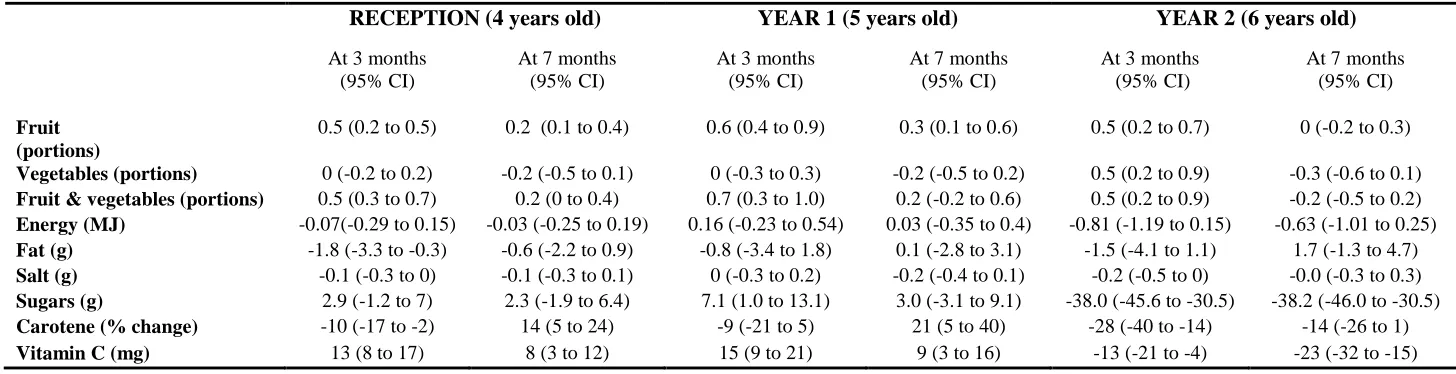
Table 3 shows the estimated changes in fruit, vegetable, and nutrient intake associated with the SFVS at three and seven months post-intervention by year group. The SFVS was associated with an increased fruit and vegetable intake across reception and year 1 of 0.5 portions (95% CI, 0.3 to 0.7) and 0.7 portions (0.3 to 1.0) at three months, which fell to 0.2 (0 to 0.4) at seven months in reception and to 0.2 (20.2 to 0.6) in year 1. The impact of the SFVS on year 2 pupils was associated with an increased fruit and vegetable intake of 0.5 portions (95% CI, 0.2 to 0.9) three months after the introduction of the SFVS. This fell to 20.2 (20.5 to 0.2) at seven months. By this time year 2 pupils were no longer eligible to receive free fruit and vegetables.
There were no associations between the SFVS and change in energy, fat, or salt intake across the year groups. Carotene intake at seven months increased in reception and year 1 by 14% (95% CI, 5% to 24%) and 21% (5% to 40%), respectively, but declined in year 2 by 14% (21% to 26%); similarly, vitamin C intake at seven months increased in reception and year 1 by 8 mg (95% CI, 3 to 30 mg) and 9 mg (3 to 16 mg), and decreased in year 2 by 23 mg (15 to 32 mg). There was a non-significant increase in sugar intake in reception and year 1. In contrast, year 2 had a decrease in sugar intake associated with the intervention, by 38.2 g (46.0 to 30.5 g) at seven months.
In the model for fruit and vegetable intake, local education authority accounted for 1% of the variation, school 8%, class 3%, pupil 84%, and occasion 5%.
DISCUSSION
This school based dietary intervention showed positive changes associated with fruit intake in young children who remained in the scheme but this effect waned over time. At three months children were eating half a portion of fruit more than they were at baseline, but this was reduced by seven months and disappeared completely in year 2 pupils, who are no longer eligible for the SFVS.
The waning effect could also be influenced by the narrow range of produce on offer. Throughout the school year a menu cycle of daily fruit and vegetables is devised. The most common items are apples, pears, easy peel citrus fruit, and bananas. Health and safety considerations have restricted items which may add variety to the scheme and stimulate a continuing interest in fruit and vegetable consumption—for example, fruit with stones are not allowed because of the risk of choking. It must also be borne in mind that, although large in scale, the SFVS only constitutes a small intervention in a child’s total diet. To have a greater impact on fruit and vegetable intake we hypothesise that the intervention would need to be more structured and target other meal events such as school dinners, packed lunches, and meals eaten at home. It would also need to be sustained throughout a child’s education.
Systematic reviews of interventions to increase fruit and vegetable intake in young children have identified the importance of a range of factors which effect children’s eating behaviour. These factors include peer and parental modelling of fruit and vegetable eating; message reinforcement to sustain the children’s interest in the intervention; the use of a supportive environment including involvement from the whole school, which includes teachers, parents, the local community, and canteen staff.[14–16] In addition, there is evidence that rebranding fruit and vegetables as ‘‘fun’’ rather than healthy has a positive effect on intake.[14]
not randomise at the school level because, for logistical reasons, each school in a reGion had to start the intervention at the same time.
We thank the children, parents and schools who were involved in this study and James Thomas for processing the nutritional data.
Competing interests: All authors declare that the answer to the questions on your competing interest form bmj.com/cgi/content/full/317/7154/291/DC1 are all No and therefore have nothing to declare.
Funding: Big Lottery Fund (BLF) What does this study add?
National interventions can lead to increases in fruit intake in young children.
Increases in fruit intake reduce over time in those who remain in the scheme and return to baseline in those who do not.
Policy Implications
REFERENCES
1. Gregory J, Lowe S, Bates C. National Diet and Nutrition Survey: Young People Aged 4 to 18 Years. Volume 1: Report of the Diet and Nutrition Survey. London: Office of National Statistics 2001.
2. Steinmetz KA, Potter JD. Vegetables, fruit, and cancer prevention: a review J Am Dietetic Assoc 1996; 96:1027-1037.
3. Key TJ, Schatzkin A, Willett WC, et al. Diet nutrition and the prevention of cancer. Public Health Nutrition 2004;7(1A) Supplement 1:187-200.
4. Potter JD. Food nutrition and the prevention of cancer: a global perspective. London: World Cancer Research Fund 1997
5. Ness AR, Powles JW. Fruit and vegetables, and cardiovascular disease: a review. Int J Epidemiol 1997;6:1-13.
6. Department of Health. The NHS Cancer Plan: A plan for investment, a plan for reform. London: Department of Health 2000.
7. Department of Health. Coronary heart disease: national service framework for coronary heart disease. London: Department of Health 2000.
8. Department of Health. The NHS Plan: a plan for investment, a plan for reform. London: Department of Health 2001.
9. Henderson L, Gregory J, Swan G. The National Diet and Nutrition Survey: Adults Aged 19 to 64 Years. London: The Stationery Office 2002.
10.http://www.dh.gov.uk/PolicyAndGuidance/HealthAndSocialCareTopics/FiveADa y/FiveADayGeneralInformation/FiveADayGeneralArticle/fs/en?CONTENT_ID= 4002149&chk=DeYbs5 [Accessed 31st August 2006]
11.Cade JE, Frear L, Greenwood DC. Assessment of diet in young children with an emphasis on fruit and vegetable intake: using CADET – Child and Diet Evaluation Tool. Public Health Nutrition 2006;9:501-508.
12.Schagen S, Ransley J, Blenkinsop S, et al. Evaluation of the school fruit and vegetable pilot scheme. Final Report. Published by Evaluation and Research Team, Big Lottery Fund 1 Plough Place London EC4A 1DE. Big Lottery Fund 2004 http://www.biglotteryfund.org.uk/er_eval_schoolfruits_final_report_uk.pdf
[Accessed 31st August 2006]
14.British Nutrition Foundation. A critical review of the psychosocial basis of food choice and identification of tools to effect positive food choice: a summary. London: British Nutrition Foundation 2004.
15.Thomas J, Sutcliffe K, Harden A, et al. Children and Healthy Eating: A systematic review of barriers and facilitators. London: EPPI-Centre, Social Science Research Unit, Institute of Education, University of London 2003.
16.Contendo I, Balch GI, Bronner YL, et al. (1995) The effectiveness of nutrition education and implications for nutrition education policy, programs, and research: a review of research. Nutrition Education 27: 277-418.
17.Wells L, Nelson M. The National School Fruit Scheme produces short term but not long term increases in fruit consumption in primary school children. British Journal of Nutrition 2005; 93: 537 - 542.
18.Knai C, Pomerleau J, Lock K, McKee M. Getting children to eat more fruit and vegetables: A systematic review. Prev Med 2006;42:85-95.
Contributors: JKR initiated the research, contributed to writing reports and the interpretation of data; DCG and JEC contributed to the study design and report writing. DCG also contributed to statistical analysis and interpretation of nutritional data. SS secured funding, andled the design of the study. IS led the analysisof data and contributed to the study design and writing the report. DT coordinated the evaluation study and led the report writing. SB and GW developed survey material and assisted with managing the evaluation. ES conducted statistical analysis. All authors contributed to subsequent drafts and approved the final version of this paper. JEC and SS are guarantors for this study.
Ethical approval was not required for this evaluation.
Copyright. The Corresponding Author has the right to grant on behalf of all authors and does grant on behalf of all authors, an exclusive licence (or non exclusive for government employees) on a worldwide basis to the BMJ Publishing Group Ltd to permit this article (if accepted) to be published in BMJ editions and any other BMJPGL products and exploit all subsidiary rights, as set out in our licence at http://bmj.com/advice/copyright.shtml.
Figure 1: Flow diagram of schools and children recruited, and number of CADETs returned.
Table 1: Baseline characteristics of the sample*
INTERVENTION CONTROL Pupil level data
Gender
Girl (%) Boy (%) Total (%)
1248 ( 49) 1278 (51) 2562 (100)
1033 (51) 1003 (49) 2033 (100)
Age (months) (SD) 72.1 (10.5) 72.4 (10.3)
Portions of fruit (SD) 1.9 (1.4) 1.8 (1.3)
Portions of vegetables (SD) 1.5 (1.5) 1.6 (1.5)
Portions of fruit and vegetables eaten daily (SD) 3.4 (2.2) 3.4 (2.2)
Total energy intake (MJ) (SD) 6.6 (1.6) 6.2 (1.6)
Fat (g) (SD) 57 (18) 57 (17)
Salt (g) (SD) 5.2 (1.6) 5.0 (1.6)
Sugars (g) (SD) 119 (39) 101 (41)
Carotene (mg) ** 939 779
Vitamin C (mg) (SD) 72 (42) 62 (40)
School level data
% children with English as an additional language (SD)
2.7 (5.4) 4.7 (14.2)
% children with free school meals eligibility (SD) 18 (11) 20 (14)
% children defined as having special educational needs (SD)
1.4 (1.4) 2.0 (1.8)
*Figures quoted are means (standard deviations). For food and nutrient intakes this is mean intake per day.
Table 2: Intake of fruit vegetables and key nutrients 7 months after the introduction of the SFVS*
INTERVENTION CONTROL
At 3 months At 7 months At 3 months At 7 months
Portions of fruit (SD) 1.9 (1.4) 1.6 (1.4) 1.7 (1.4) 1.6 (1.3)
Portions of vegetables (SD) 1.5 (1.6) 1.5 (1.5) 1.6 (1.6) 1.6 (1.5)
Portions of fruit and vegetables eaten daily (SD) 3.4 (2.3) 3.1 (2.1) 3.3 (2.3) 3.2 (2.1)
Total energy intake (MJ) (SD) 6.6 (1.7) 6.5 (1.6) 6.4 (1.7) 6.3 (1.7)
Fat (g) (SD) 56 (18) 57 (17) 58 (19) 57 (18)
Salt (g) (SD) 5.1 (1.6) 5.2 (1.7) 5.0 (1.6) 5.0 (1.7)
Sugars (g) (SD) 123 (40) 113 (37) 115 (39) 106 (38)
Carotene (mg) ** 828 1004 832 985
Vitamin C (mg) (SD) 84 (48) 79 (45) 68 (44) 68 (42)
Table 3: Adjusted change in food and nutrient intakes* associated with the SFVS intervention compared to controls, by year group**
* Adjusted for significant confounders
**At 7 months, 92 schools returned data from 3,703 pupils; 3,405 food diaries were included in the analysis
*** Where numbers do not add up this is because of small amounts of missing data
RECEPTION (4 years old) YEAR 1 (5 years old) YEAR 2 (6 years old)
At 3 months (95% CI)
At 7 months (95% CI)
At 3 months (95% CI)
At 7 months (95% CI)
At 3 months (95% CI)
At 7 months (95% CI)
Fruit (portions)
0.5 (0.2 to 0.5) 0.2 (0.1 to 0.4) 0.6 (0.4 to 0.9) 0.3 (0.1 to 0.6) 0.5 (0.2 to 0.7) 0 (-0.2 to 0.3)