promoting access to White Rose research papers
White Rose Research Online
Universities of Leeds, Sheffield and York
http://eprints.whiterose.ac.uk/
This is an author produced version of a paper published in
Journal of
Aerosol Science.
White Rose Research Online URL for this paper:
http://eprints.whiterose.ac.uk/7792/
Published paper
Beggs, C.B., Noakes, C.J., Sleigh, P.A., Fletcher, L.A. and Kerr, K.G. (2006)
Methodology for determining the susceptibility of airborne microorganisms to
irradiation by an upper-room UVGI system. Journal of Aerosol Science, 37 (7).
pp. 885-902.
http://dx.doi.org/10.1016/j.jaerosci.2005.08.002
Methodology for determining the susceptibility of airborne microorganisms to
irradiation by an upper-room UVGI system
C.B. Beggs
1, C.J. Noakes
2, P.A. Sleigh
2*, L.A. Fletcher
2, K.G. Kerr
31
Medical Engineering Group, School of Engineering, Design and Technology, University of Bradford, Bradford BD7 1DP, UK
2
Aerobiological Research Group, School of Civil Engineering, University of Leeds, Leeds LS2 9JT, UK
3
Dept of Microbiology, Harrogate Health Care Trust, Harrogate District Hospital, Lancaster Park Road, Harrogate HG2 7SX, UK
*Corresponding author: Dr P Andrew Sleigh, email [email protected] phone +44(0)113 343 2398,
Abstract
Whilst a number of researchers have demonstrated the disinfection effectiveness of upper-room UV irradiation devices against a range of airborne microorganisms, it is technically difficult to determine the performance of such systems because the biological and physical processes involved can be complex. In particular, most of the quantitative data on the susceptibility of airborne microorganisms to UV irradiation is obtained from single-pass experiments which are not representative of the fragmented UV exposure experienced by airborne microorganisms in real rooms. This paper presents complete and partial mixing models for predicting an effective UV susceptibility constant, Zeff, that is appropriate for quantifying the
behaviour of airborne microorganisms when irradiated using an upper-room system. The use of both decay and continuous contamination experimental techniques are discussed and related to the models presented. Experimental results are presented which indicate that Zefffor Serratia marcescens is up to an
order of magnitude lower than the susceptibility constants derived from single-pass experiments, suggesting that using these data to design upper-room UV systems may lead to a lower than expected performance.
Keywords
1. Introduction
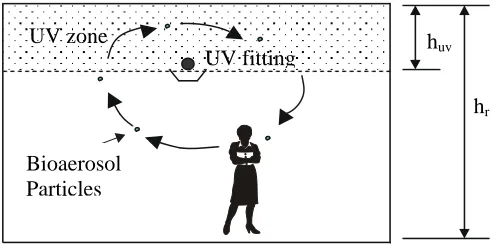
[image:4.612.183.432.245.370.2]Airborne microorganisms are particularly vulnerable to damage from ultraviolet (UV) light at 254 nm. At this wavelength, photons of light are absorbed by deoxyribonucleic acid (DNA) to form pyrimidine dimers and other lethal photoproducts (Beggs, 2002). UV light can therefore be used to inactivate airborne pathogens such as Mycobacterium tuberculosis, the causative agent of tuberculosis (TB). However, UV-C irradiation is hazardous to humans, causing skin and eye irritation under conditions of direct exposure, and therefore must be used with caution. One effective way to disinfect air is to use wall or pendant mounted fittings to create an open UV field in an upper-room zone (see Figure 1). By shielding the fittings and mounting them above head height, it is possible to irradiate a large area of the room whilst protecting any occupants from exposure. Such systems rely on the convection currents which occur naturally in a room, rather than fans, to transport airborne microorganisms through the UV field. By using the convection currents in rooms it is possible to disinfect very large volumes of air relatively quickly (Miller et al., 1999).
Figure 1. An upper-room UV installation
While a number of researchers (Miller et al., 1999, Riley et al., 1976, Miller and Macher, 2000) have demonstrated that upper-room UV fields might be effective in controlling the spread of TB and other airborne infections in enclosed spaces, no firm guidelines exist for the design of such systems. The absence of guidelines is largely due to the complexity of the biological and physical processes involved in the air disinfection process, and a lack of good quality microbiological data. It is thus difficult to predict how upper-room UV systems will perform, let alone determine how they should be optimised. Indeed, such is the shortage of good microbiological data that designers have little idea of how medically important microorganisms behave when exposed to UV light at 254 nm. In particular, little is known about the effect of sub-lethal doses of UV irradiation on many significant microorganisms (Beggs, 2002).
The susceptibility of airborne microorganisms to UV light is generally determined using a single pass airflow apparatus (Ko et al., 2000, Fletcher et al., 2003), in which microorganisms suspended in an air stream pass once through an accurately calibrated UV field. However, in a real room the airborne microorganisms may pass in and out of the upper-room UV field several times and may therefore experience DNA repair processes such as photoreactivation (Beggs and Sleigh, 2002, Peccia and Hernandez, 2001) as well as multiple exposures to the UV field. As a result the microorganism susceptibility characteristics measured in a single pass apparatus may not be representative of the behaviour in a real situation. This paper addresses this issue by presenting several analytical models, of varying degrees of complexity, which may be used in conjunction with experimental data to determine the susceptibility of airborne microorganisms irradiated by upper-room UV systems. The study demonstrates how the models can be used to calculate the value of an effective susceptibility constant, Zeff. This value is
comparable to the microorganism susceptibility data obtained from single pass apparatus, but it also allows for the additional decay and repair mechanisms that may occur in a real situation. The relative merits of the models are examined using both theoretical analysis and actual experimental data from an aerobiological test chamber.
Bioaerosol Particles
UV zone
UV fitting
hr
2. UV Susceptibility
The susceptibility of airborne microorganisms to damage from UV light depends on both the microorganism species and the climatic conditions. If a microbial population is exposed to UV light at 254 nm, the DNA will suffer damage: the greater the UV dose received, the greater the damage and ultimately the greater the number of microorganisms killed. While UV light at 254 nm damages most microorganisms, the injury caused varies between microbial genera and species. The UV susceptibility of any given microorganism to UV damage is quantified by a UV susceptibility constant, Z (m2/J), and calculated from experimental measurements using equation (1):
(
)
eff t
H C C Z = −ln / 0
(1)
where: Ct = Bioaerosol concentration at time t (cfu/m3)
Co = Initial bioaerosol concentration at (i.e. at time t = 0) (cfu/m3)
Heff = Effective UV dose received by microorganisms (J/m2)
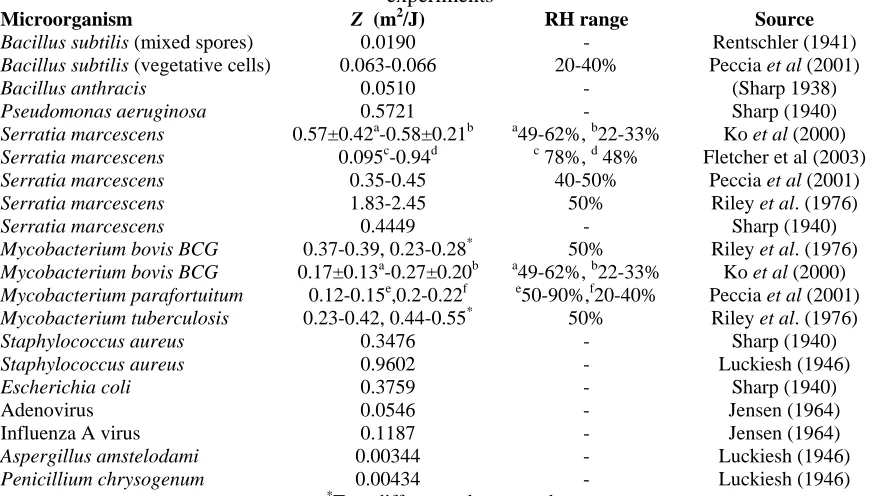
[image:5.612.86.524.455.703.2]UV susceptibility constants have been determined experimentally by a number of researchers over many years using a single pass airflow apparatus, similar to those described by Ko et al., 2000 or Fletcher et al., 2003. Aerosolised microorganisms are passed once through known UV fields under controlled climatic conditions and sampled using a suitable aerobiological sampler. The surviving microorganisms are incubated and enumerated, and the subsequent reduction in microorganism concentration is determined for each UV field. By plotting the natural log of the reduction against UV dose and fitting a linear regression line to the data, the value of Z can be found by calculating the gradient of the line, as shown by equation (1). This experimental procedure is, in practice, quite difficult to undertake and achieve a good consistency of measurements (Fletcher et al., 2003). This is indicated by the data in Table 1, which presents published Z values for a range of microorganisms in the aerosolised state.
Table 1 UV susceptibility constants for various aerosolised microorganisms calculated from single-pass experiments
Microorganism Z (m2/J) RH range Source
Bacillus subtilis (mixed spores) 0.0190 - Rentschler (1941)
Bacillus subtilis (vegetative cells) 0.063-0.066 20-40% Peccia et al (2001)
Bacillus anthracis 0.0510 - (Sharp 1938)
Pseudomonas aeruginosa 0.5721 - Sharp (1940)
Serratia marcescens 0.57±0.42a-0.58±0.21b a49-62%, b22-33% Ko et al (2000)
Serratia marcescens 0.095c-0.94d c 78%, d 48% Fletcher et al (2003)
Serratia marcescens 0.35-0.45 40-50% Peccia et al (2001)
Serratia marcescens 1.83-2.45 50% Riley et al. (1976)
Serratia marcescens 0.4449 - Sharp (1940)
Mycobacterium bovis BCG 0.37-0.39, 0.23-0.28* 50% Riley et al. (1976)
Mycobacterium bovis BCG 0.17±0.13a-0.27±0.20b a49-62%, b22-33% Ko et al (2000)
Mycobacterium parafortuitum 0.12-0.15e,0.2-0.22f e50-90%,f20-40% Peccia et al (2001)
Mycobacterium tuberculosis 0.23-0.42, 0.44-0.55* 50% Riley et al. (1976)
Staphylococcus aureus 0.3476 - Sharp (1940)
Staphylococcus aureus 0.9602 - Luckiesh (1946)
Escherichia coli 0.3759 - Sharp (1940)
Adenovirus 0.0546 - Jensen (1964)
Influenza A virus 0.1187 - Jensen (1964)
Aspergillus amstelodami 0.00344 - Luckiesh (1946)
Penicillium chrysogenum 0.00434 - Luckiesh (1946) *
The data in Table 1 reveal a wide range of Z values for the various microorganisms. Escherichia coli for example, is approximately a hundred times more susceptible to UV irradiation than Aspergillus amstelodami. In addition, the data show considerable variation between the values obtained by different researchers for the same microorganism; for example, for Serratia marcescens values range from 0.095 – 2.14 m2/J. While this variance may, in part, be attributable to the use of different strains by various researchers, it may also be attributable to variations in experimental technique. In particular differences in relative humidity between different experiments is likely to result in significant variations in the measured susceptibility constant. Several authors have noted that there is a species dependent relationship between UV susceptibility and relative humidity with most reporting a decrease in susceptibility to UV irradiation at high relative humidities (Riley and Kaufman 1972, Peccia et al 2001, Fletcher et al 2003). However it is only the more recent studies (Ko et al 2000, Peccia et al 2001, Fletcher et al 2003) that fully report both the relative humidity data and the respective UV susceptibility constants.
3. Complete air mixing models
The complete air mixing model is developed by considering a ventilated room in which the air is assumed to be fully mixed. If there is no recirculation of ventilation air and the ventilation supply air is clean the only source of microorganisms is from within the room, for example disseminated into the air by one of the room occupants. Assuming that ventilation is the only contaminant removal mechanism the theoretical rate of change of microbial contamination is given by
CNV
q
dt
dC
V
=
−
(2)where:
C = Bioaerosol contamination level at time t (cfu/m3) V = Room volume (m3)
N = Steady state air change rate (s-1) = Number of air changes per hour/3600 q = Constant bioaerosol contamination rate in the room space (cfu/s)
With an initial concentration in the room of C0, the general solution to equation (2) yields the
contamination in the room at time t, as given by equation (3).
Nt
e NV
q C NV
q
C ⎟⎟ −
⎠ ⎞ ⎜⎜
⎝ ⎛
− +
= 0 (3)
Although this equation describes the general build up or decay of the contaminant in the room, it is not particularly useful for analysing experimental data in its current form. Therefore two specific cases are considered which are relevant to experiments characterising contamination removal by ventilation and upper room UV devices
The first case considers the calculation of how long it takes for the contamination level to fall in enclosed spaces. Should the contamination source cease (or leave the room) then with q = 0 equation (3) reduces to the decay model.
Nt
e
C
C
=
0 − (4)microbial contamination level can be predicted by using equation (5). This indicates that the steady-state concentration is inversely proportional to the air change rate N.
NV
q
C
=
(5)The above equations only consider the removal by the ventilation system and do not take into account bioaerosol ‘removal’ by upper room UV systems. To include this, a further constant inactivation rate term, φuv, is required. This is added to N, to give the total inactivation rate N + φuv. Beggs and Sleigh (2002)
have shown that under conditions of complete air mixing φuv is given by:
r uv eff uv
h
h
E
Z
=
φ
(6)where; huv = Height of UV zone (m) (see Figure 1)
hr = Height of room (m) (see Figure 1)
Zeff = Effective UV susceptibility constant (m
2
/J) E = Average UV irradiance (W/m2)
Including this inactivation term in equation (2) yields the following expression for the rate of change of contaminant concentration in the presence of both UV irradiation and ventilation removal, Cuv
)
(
uvuv
uv
q
C
V
N
dt
dC
V
=
−
+
φ
(7)Integrating this results in the following general solution for the contamination in the room:
t N
uv uv
uv e uv
V N q C V N q
C 0 ( )
) ( ) ( φ
φ
φ
⎟⎟⎠ − +⎞ ⎜⎜ ⎝ ⎛ + + +
= (8)
As previously this expression can be simplified for the particular case where the contamination ceases at time zero to give a new decay model as
t N
uv
C
e
uvC
=
0 −( +φ ) (9)Similarly the following continuous contamination model now represents the contaminant concentration in the steady state case
V
N
q
C
uv uv)
(
+
φ
=
(10)Xu et al’s (2003) experimental evaluations of upper room UV systems inactivating Mycobacterium parafortuitum showed that equivalent UV inactivation rates of between 1.2 and 17 AC/h could be achieved with a room ventilation rate of 3 AC/h, depending on the UV lamp power. This indicates that φuv is usually of a similar order of magnitude as N and consequently it is very important to quantify both
In reality the rate at which airborne microorganisms are inactivated or removed from a room space depends on more than the physical actions of the ventilation system or UV lamps. Viable bioaerosol particles are also ‘removed’ from the air by natural biological and physical processes including inactivation of microorganisms resulting from environmental stress due to factors such as oxygen toxicity, nutrient starvation and desiccation (Cox 1995) and by physical deposition on room surfaces. It is possible to include these effects in the above models by replacing N with
d n
=
N
+
k
φ
(11)where
kd = Bioaerosol inactivation rate arising from natural decay processes and deposition
or impaction on room surfaces (s-1)
The term φn combines the actions of the ventilation system, natural biological decay and deposition of
particles on room surfaces. The value of φn is generally greater than N, however, as shown below, it is
only possible to evaluate the magnitude of kd in some of the experiments described in this paper.
4. Application of Theory to the Experimental Determination of Zeff
Although the value of Zeff is a characteristic of the microbial behaviour, it also has some dependence on
the room characteristics and UV field, as this determines how many times the microorganisms are passed through the field and hence the level of DNA repair that is experienced. In theory Zeff should be evaluated
for the actual room where the upper room UV system is implemented. However in practice it is not possible to perform experiments in every location, therefore typical values of Zeff for different organisms
and room characteristics can be determined from experiments. These may be conducted in a ventilated test chamber with an upper-room UV field using either the decay model (equations (4) and (9)) or the continuous contamination model (equations (5) and (10)). A typical test chamber used for such experiments may be similar to the bioaerosol test chamber described in section 6.
4.1 Calculating Zeff using the Decay Model
The experimental procedure needed to evaluate Zeff depends on the model selected for analysis. If the
0 200 400 600 800 1000 1200 1400 1600
0 500 1000 1500
Time (s)
Colony Count (cfu/m
3 )
UV off
UV on
10%
[image:9.612.122.469.86.337.2]tnuv90 tn90
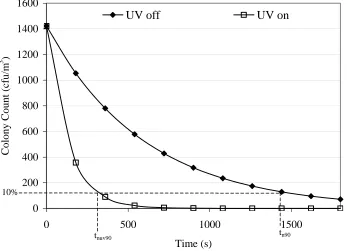
Figure 2. Decay curves typical of an experiment with and without UV irradiation, with nebulization ceasing at time t = 0 s
From simple rearrangement of equation (4) and (11) the value of φn may be determined by choosing a
suitably high value of biological ‘inactivation’ and reading the time taken to achieve this from the decay curve. Choosing a 90% inactivation results in C/C0= 0.1 in equation (4) and φnis given by equation (12),
where the time taken to achieve 90% bioaerosol ‘inactivation’ with the UV lights off is tn90.
1
.
0
ln
1
90 n n
t
−
=
φ
(12)A similar equation to give φuv may be obtained by rearranging equation (9). With a 90% inactivation φuv is
given by equation (13). In this equation tnuv90 is the time taken to achieve 90% bioaerosol ‘inactivation’
with both the ventilation system running and the UV lamps on.
n nuv
uv
t
φ
φ
=
−
1
ln
0
.
1
−
90
(13)
Having determined the value of φuv, it is then possible determine the value of Zeff by rearranging equation
(6) as follows:
uv r uv eff
h
E
h
In addition to calculating the UV susceptibility, it is also possible to use this decay method to evaluate the contribution of the additional decay processes, kd. If the ventilation rate has been measured by another
method, such as using a capture hood or tracer gas, then the value of N will be known. Therefore equation (11) can be rearranged to easily calculate the value of kd. This calculation also does not depend on the
measurement of the microorganism decay in the presence of the UV lamps and the method could therefore be used to carry out general experiments to evaluate the natural decay of airborne microorganisms in ventilated rooms.
4.2 Calculating Zeff using the Continuous Contamination Model
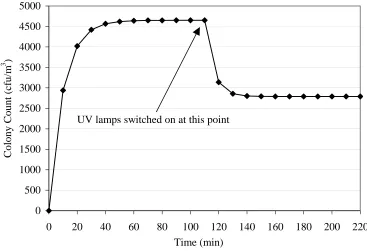
An alternative to the decay model is to use the continuous contamination model. As with the decay model, when the continuous contamination model is used to evaluate experimental data, it is necessary to nebulise microorganisms into a ventilated chamber until a relatively high steady-state condition is reached. Once steady-state has been reached and sampled over a period of time, the UV lamps should then be switched on, while still maintaining a constant bioaerosol production. The air should then be sampled again at regular intervals over a period of time to record the contamination levels when the new steady-state condition is achieved. Theoretical example data for such a procedure is shown in Figure 3.
0 500 1000 1500 2000 2500 3000 3500 4000 4500 5000
0 20 40 60 80 100 120 140 160 180 200 220 Time (min)
Colony Count (cfu/m
3 )
[image:10.612.122.489.312.563.2]UV lamps switched on at this point
Figure 3. Typical bioaerosol concentration curve, before and after UV irradiation, with continuous nebulization.
When using the continuous contamination model the measured data can be evaluated using equations (5) and (10). As the contamination rate is constant throughout the experiment, the term q in equations (5) and (10) can be equated to yield
)
1
(
−
=
uv uv
C
C
N
As with the decay model, equation (14) can then be used to determine the value of Zeff. In this case it is
always necessary to find the ventilation rate N by additional measurements to be able to use the above equation. To be able to evaluate the natural decay mechanisms in this case it is also necessary to know the value of q, whereupon equations (5) and (11) can be rearranged to evaluate φn and hence kd. In theory it is
possible to find q by evaluating the bacteria concentration in the nebulizer broth and the rate at which this is transferred into the room during the experiment. However in practice this tends to give unrealistic results as the difference between the sampled value and the input rate also includes additional decay due to the stress in the nebulization process.
Because both the decay and continuous contamination methods are based on models which assume complete air mixing, experimental procedures ideally should ensure good air mixing at all times.
4.3 Experimental Pros and Cons
By using either the decay method or the continuous contamination method, it is theoretically possible to determine realistic values for Zeff, which reflect both the irradiation damage and DNA repair
characteristics of microorganisms subjected to real upper-room UV systems. However, each experimental method has its drawbacks and advantages. Because the continuous contamination method only uses steady-state values to calculate Zeff, it is not necessary to collect data during the non-steady-state ‘build-up’
and ‘decay’ stages. Consequently, the amount of air sampling and microbiological culturing required can be greatly reduced. This, of course, pre-supposes that the duration of the ‘build-up’ and ‘decay’ stages is known; a ‘scoping’ test run may therefore be necessary to discover the duration of these periods. One drawback of the continuous contamination method is that it can be difficult to accurately determine steady-state levels; variability in the air sampling and culturing process, and incomplete room air mixing can cause colony counts to fluctuate, particularly at higher contamination levels. It is therefore recommended that several samples be taken during each steady-state period to obtain the mean airborne microorganism concentrations and the standard deviation.
This problem of variability is not shared by the decay method, as in our experience it generally produces curves in which the fluctuations are smoothed out. However, the decay method has two major disadvantages. Firstly, to accurately measure a decay curve, it is often necessary to take a large number samples in quick succession. For example, if a multi-stage Anderson impactor is used it may be difficult to dissemble and reassemble the sampler in the time available, particularly under high ventilation rate conditions. Using several samplers would overcome this issue, however in many cases this is prohibitively expensive. The second and possibly more important difficulty is due to the lamp warm up time. Because UV lamps take several minutes to reach full power when first switched on, recorded values for UV decay curves may well be inaccurate, especially if the decay is very rapid. In theory this problem can be overcome by constructing some form of shield, which can be removed once the lamps have warmed up. However, in practice this is a difficult and complex procedure as it is not possible to enter the chamber during experiments. The continuous contamination method does not suffer from the ‘warming up’ problem, because the UV lamps warm-up before a steady-state condition is reached. For this reason (more than any other) the continuous contamination method appears to be the superior of the two methods.
From equation (14) it is evident that the value of Zeff is strongly influenced by the average irradiance E, of
the UV field. Accurate prediction of E is therefore essential when determining the value of Zeff. The value
5. Incomplete air mixing models
While the complete mixing models described in section 3 may yield a good approximation of Zeff for
rooms in which the air is well mixed, they may be of limited value when applied to rooms in which the air is poorly mixed. Given that many spaces are far from fully mixed, it is important to consider how upper-room UV systems might behave under such conditions. Theoretical models to evaluate the effectiveness of upper-room UV under conditions of incomplete mixing are generally based on zone-mixing models (Skåret, 1986, Brouns and Waters, 1991). These models enable contaminant concentrations to be estimated in different regions of a room by dividing the space into two or more zones. The air is assumed to be fully mixed within each zone, but not between zones, leading to ‘short-circuiting’ of the air and different contaminant concentrations in each zone. When applied to a UVGI installation, one or more upper-room zones are specified which contain the UV field. Such zonal models have previously been developed by several authors to analyse specific cases. Riley and Permutt (1971) developed a two-zone decay model which they used to evaluate their experimental data. Nicas and Miller (1999) considered a three-zone model with upper and lower room zones and a near field zone around an infectious patient. This was also formulated as a decay model and applied to experimental data.
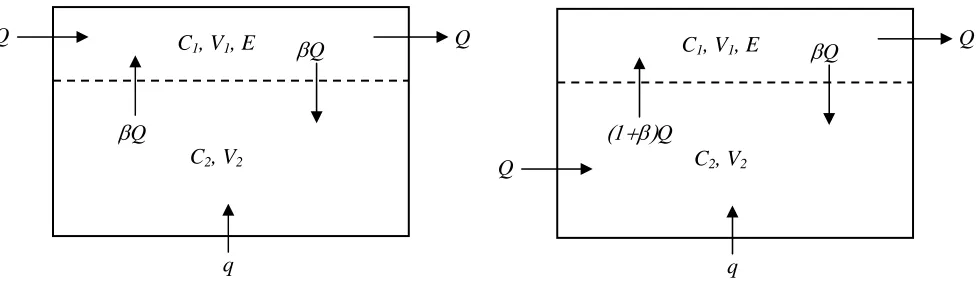
A continuous contamination (steady-state) model for a room with incomplete air mixing, can be developed by modifying a two-zone ventilation model (Brouns and Waters, 1991) to incorporate the UV inactivation of airborne microflora (Riley and Permutt, 1971). In addition to estimating the concentration differences between zones due to UV inactivation, zonal models also include the type of ventilation system in a room. This allows the effectiveness of both the UV lamps and the ventilation system at removing airborne microorganisms to be assessed. A general steady-state model, suitable for assessing UV systems for a wide range of ventilation regimes was presented in Noakes et al. (2004a). Two specific cases from this model are used below to illustrate how such models may also be used to find the effective inactivation rate, Zeff of a microorganism from experimental data. Schematics of these cases are shown in Figure 4.
[image:12.612.71.561.435.588.2](a) Ventilation in high-out high (b) Ventilation in low-out high
Figure 4. Schematics of two-zone ventilation model with an upper room UV field for two ventilation regimes
In each case the room is divided into upper and lower zones, volume V1 and V2 (m
3
), and the room ventilation flow rate is designated as Q (m3/s) which is given by
Q
=
φ
n(
V
1+
V
2)
. Case (a) has a ventilation system where the supply and extract points are both in the upper zone, while case (b) is a piston ventilation system with the supply air in the lower zone and the extract in the upper zone. It is assumed that the supply air is uncontaminated, a UV field with average irradiance E is present in the upperQ
q Q
βQ
βQ
C1, V1, E
C2, V2
q Q
(1+β)Q
βQ
C1, V1, E
C2, V2
zone only, and bioaerosol contaminants are injected uniformly and continuously into the lower zone only, at a rate of q colony forming units per second (cfu/s).
In case (a) the inter-zonal airflow rate is represented as βQ, where β is a dimensionless mixing factor, which describes the inter-zonal air change rate relative to the room ventilation rate. The higher the value of β, the more times the air is exchanged between the zones and the better the room mixing. In the piston type regime of case (b), the zone transfer rate in the overall ventilation direction is (1+β)Q, to reflect both the main ventilation flow and the effect of short circuiting. Beggs and Sleigh (2002) suggested that the value of β may be estimated for a particular room from the equation:
2
int
Av Q=
β
(16)where A (m2) is the area of the interface between the two zones and vint (m/s) is the average velocity of air
crossing this interface.
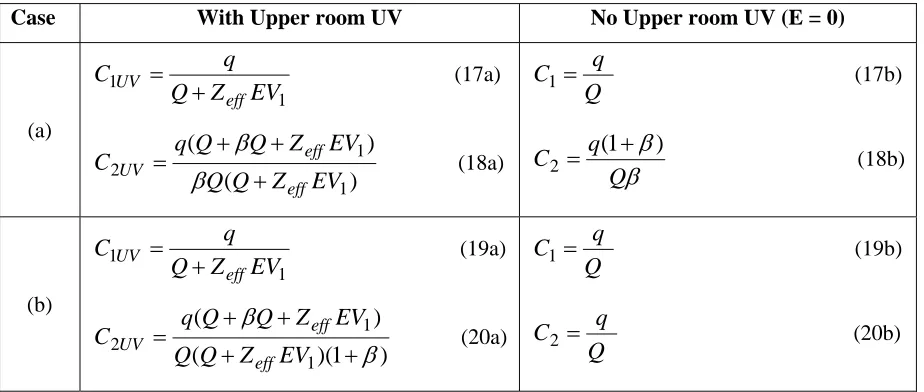
These inputs and outputs to and from the room result in overall steady-state microorganism concentrations C1UV and C2UV (cfu/m
3
) in the upper and lower zones respectively, given by the expressions in Table 2. Details of the derivation of these expressions are given in Noakes et al. (2004a). With no UV irradiation (E = 0) the upper and lower zone concentrations C1 and C2 in Table 2 are those given by Brouns and
[image:13.612.77.539.375.571.2]Waters (1991).
Table 2 Upper and lower zone steady-state contaminant concentrations for two ventilation regimes
Case With Upper room UV No Upper room UV (E = 0)
(a) 1 1
EV
Z
Q
q
C
effUV
=
+
(17a)) ( ) ( 1 1 2 EV Z Q Q EV Z Q Q q C eff eff UV + + + =
β
β
(18a)Q
q
C
1=
(17b)β
β
Q
q
C
2=
(
1
+
)
(18b)(b) 1 1
EV
Z
Q
q
C
effUV
=
+
(19a)) 1 )( ( ) ( 1 1 2
β
β
+ + + + = EV Z Q Q EV Z Q Q q C eff effUV (20a)
Q
q
C
1=
(19b)Q
q
C
2=
(20b)If a continuous contamination experiment is carried out to evaluate either the effectiveness of a UV lamp or to determine Zeff for a particular microorganism, the rate at with microorganisms enter the chamber (q)
should remain constant throughout the entire experiment (i.e. without UV and with UV), to allow the two cases to be successfully compared. As in the fully mixed case this fact allows the equations in Table 2 to be manipulated to find the value of Zeff in terms of either the upper zone or lower zone reduction. By
equating q in each pair of equations, Zeff can be expressed as
or
⎟⎟ ⎠ ⎞ ⎜⎜
⎝ ⎛
− +
⎟⎟ ⎠ ⎞ ⎜⎜
⎝ ⎛
− +
=
UV UV eff
C C C
C
EV Q Z
2 2 2
2
1
) 1 (
1 )
1 (
β
β
(22)
Despite the zone concentration equations being different for cases (a) and (b) in Table 2, the expressions for Zeff turn out to be the same for both cases. The usage of equations (21) and (22) depends on the
experimental data that is collected. If air samples are taken in the upper zone of the room, then C1 and
C1UV will be known and equation (20) is appropriate. Likewise, samples taken in the lower part of the
room require equation (21) to analyse the data, although in this case the analysis is complicated by the need to determine a suitable mixing factor, β. This can be calculated using Equation (16), with the average interfacial velocity, vint determined by carrying out measurements of the vertical velocity at a number of
points in the room at the height of the specified zone interface. As the value of β is used as an indicator of room mixing, measurements made with a hand held anemometer of sufficient sensitivity should be adequate.
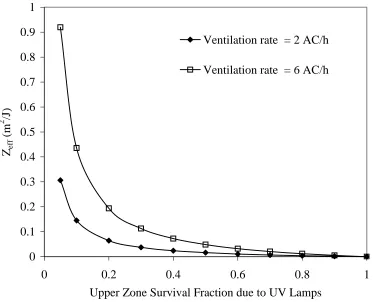
The generic relationship for both zones Ci/CiUV that appears in equations (21) and (22)is the reciprocal of
the fraction of microorganisms that survive following UV irradiation in zone i (i = 1 or 2). Figure 5 shows graphically the relationship between this survival fraction for the upper zone and the effective susceptibility constant Zeff. It should be noted that Figure 5 does not include the reduction achieved by the
ventilation system and displays only the survival fractions achieved through the action of the UV lamps. It can be seen, as expected that a survival fraction of 1 (no reduction due to UV) results in a zero value of Zeff, while Zeff tends to infinity as the survival fraction approaches 0 (total ‘kill’). The figure also
0
0.1
0.2
0.3
0.4
0.5
0.6
0.7
0.8
0.9
1
0
0.2
0.4
0.6
0.8
1
Upper Zone Survival Fraction due to UV Lamps
Z
eff(m
2
/J)
Ventilation rate = 2 AC/h
[image:15.612.112.486.70.372.2]Ventilation rate = 6 AC/h
Figure 5. Variation in Zeff with upper zone survival fraction at two ventilation rates
6. Experimental Results
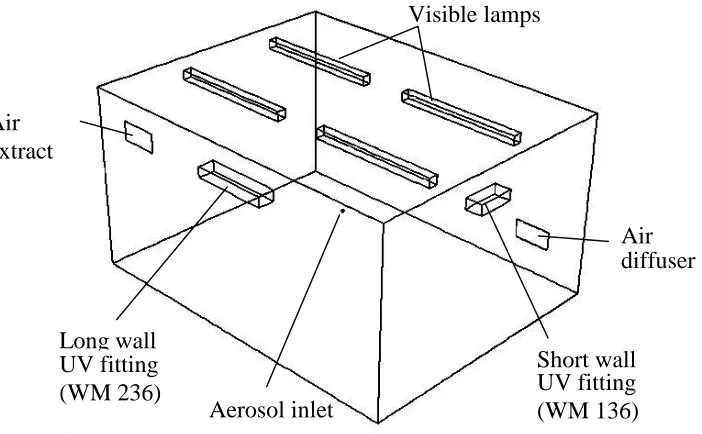
In order to test the validity of steady-state models described in sections 3 and 5 a continuous contamination UV irradiation experiment was carried out in the bioaerosol test chamber shown in Figure 6. This facility is a climatically controlled 32.25 m3 chamber with room ventilation that can be varied between 1 and 12 AC/h and may be supplied and extracted through either ceiling or wall mounted vents. Bioaerosols generated by a nebulizer can be introduced to the centre of the room via a tube and diffuser, to simulate continuous or variable contamination.
The experiment involved nebulizing a liquid culture of Serratia marcescens (NCTC 1377) into the centre of the chamber at a constant rate over a period of 6.5 hours – 3 hours without UV irradiation followed by 3.5 hours with UV irradiation. The culture was grown in nutrient broth (Oxoid) in a shaker at 37°C after which it was centrifuged and resuspended in sterile phosphate buffered saline. Appropriate dilutions of the concentrated microbial suspension was then prepared in sterile distilled water to give a concentration of approximately 106 cfu/ml. The bioaerosols were generated using a six-jet Collision nebulizer (CN 25, BGI Inc, USA) which was operated at a constant pressure of 20psi and flow rate of 12l/m, monitored by a flow meter.
Air
diffuser
Short wall
UV fitting
(WM 136)
Visible lamps
Aerosol inlet
Long wall
UV fitting
(WM 236)
Air
[image:16.612.129.480.105.322.2]extract
Figure 6. Aerobiology test room geometry
During the experiment clean, HEPA filtered air entered the chamber at the low level wall diffuser and exited via the high level vent on the opposite wall (see Figure 2 and case (b) in Figure 4). The ventilation rates in the chamber were determined by measuring the air flow into and out of the inlet and exhaust grills using a capture hood and thermal anemometers (Air Flow, ProHood) and was adjusted such that a slight negative pressure was maintained (0.12 in.wg) in the chamber. In the experiments carried out in this study the ventilation rate was set at 6 or 9 AC/h and the temperature and relative humidity were maintained close to ambient, as indicated in table 3. Throughout both steady-state periods of the experiment, the microbial concentration in the test chamber air was sampled at regular intervals via a sampling tube located directly in front of the exhaust grill. This was connected to the inlet of a six-stage Andersen sampler (Andersen Instruments, USA), loaded with two sterile dry nutrient agar plates on stages 5 and 6 only, operated at a flow rate of 28.3 l/min. The decision to use only stages 5 and 6 was based on initial investigations that revealed that the 95 % of the particles in the test chamber were collected on these plates. Following sampling the agar plates were incubated in the dark at 37°C for 24 hours, and the number of colonies on each of the plates was counted. These values were corrected to account for multiple impaction (Macher 1989) and then used to calculate the microbial concentration in the room.
Table 3 Results of the two steady-state UV irradiation experiments, showing values as means and standard deviations in each case
Ventilation Rate AC/h Temperature (C) Relative Humidity (%)
Survival Fraction following UV irradiation (CUV/C)
6 21.52 (SD 0.77) 48.70 (SD 2.34) 0.5724 (SD 0.20) 9 20.99 (SD 0.34) 48.16 (SD 1.63) 0.6851 (SD 0.06)
The value of Zeffwas calculated using both the complete mixing and two zone steady-state continuous
contamination models. In the case of the complete mixing model Zeff was calculated using equations (14)
and (15), with the height of the UV zone taken as 0.5m and the survival fractions calculated from the experiments taken as the whole room averages. The calculation using the two-zone model assumed the survival fractions calculated from the experiments to be the upper zone survival, C1UV/C1, as the
experimental samples were taken close to the extract vent, in the upper zone of the room. Therefore equation (21) was used to evaluate Zeff in terms of the two-zone model. As only the upper-zone was
considered it was not necessary to define the mixing factor, β,in this calculation. The results from both models are presented in Table 4, together with experimental values from the literature for single pass systems (as shown in Table 1).
Table 4 Comparison of Zeff calculatedfrom test room experiments and values from single pass
experiments
Model Value of Zeff (m
2
/J)
6 AC/h 9 AC/h
Test room (complete mixing model) 0.0469 (* 0.018-0.106) 0.0433 (* 0.032-0.057) Test room (two zone model) 0.0469 (* 0.018-0.106) 0.0433 (* 0.032-0.057) Single pass experiment (Riley 1976) 1.83-2.45a
Single pass experiment (Peccia et al 2001) 0.35-0.45b Single pass experiment (Ko et al 2000) 0.57c-0.58d Single pass experiment (Fletcher et al 2003) 0.095e-0.94f
a
50% RH, b 40-50% RH, c 49-62% RH, d 22-33% RH, e 78% RH, f 48% RH *
Calculated from experimental survival fraction +/- 1 standard deviation
From the results presented in Table 4 it is clear that both the models yield identical values of Zeff, which
initially seems to be a surprising result. However examination of equation (14), (15) and (21) shows that both models are written in the same form with C1/C1UV replaced by the room average values Ce/Cnuv for the
fully mixed models. The reason that both models yield the same result is due to how the available experimental data is used. In the fully mixed model, the experimentally determined survival fraction is treated as an average value for the whole room, whereas in the two-zone model this is assumed to be for the upper-zone only. Providing that the sampled value is representative of the upper zone concentration, this shows that either model can be used to determine a suitable value for Zeff. However, it does indicate
that the fully mixed model may be overestimating the effectiveness of the UV irradiation. If equation (22) is rearranged, the ratio of the lower zone concentration without and with UV irradiation is given by
Using the calculated values of Zeff in Table 4 and a mixing factor β = 3.6 the lower zone survival fractions,
C2uv/C2, can be estimated as 0.665 at 6 AC/h and 0.754 at 9 AC/h. These values are clearly dependent on
the mixing factor, but as previous studies (Noakes et al., 2004b) have shown that typically 3<β<10, it is likely to be a reasonable estimate and indicates the underestimation of the fully mixed model.
It is also notable that the calculated values of Zeff shown in Table 4 are lower than the susceptibility
constants presented in the literature for Serratia marcescens determined from single pass experiments, including those determined in our own study under similar climatic conditions. This suggests that in the test room experiments Serratia marcescens is harder to inactivate than in the single pass experiments under similar conditions. This may be due to the potential for repair between passes and the effects of repeated exposure upon the bacterium.
7. Discussion
The models presented here represent an alternative method to the single pass irradiation technique for calculating the UV susceptibility of airborne microorganisms. However, the value determined is an effective value which represents the summation of all the various DNA damage and repair mechanisms which occur during the room residence time of bioaerosol particles. Given that with upper-room UV systems, for any given aerosol particle there may be many minutes between successive irradiation doses, it would appear that it is the Zeff value and not the single-pass Z value which most accurately reflects the
behaviour of the air disinfection process.
The discussion in section 6 highlights the importance of ensuring that the appropriate zone mixing equation is applied to the data collected. For example, in Table 4 the complete mixing and two-zone models give the same value for Zeff, only because the air sampling point is located in the upper-room zone,
with the result equations (14,15) and (21) are essentially the same. If the sampling point had been located in the lower zone, then unless the room air is very well mixed, it is likely that the two models would have yielded different values. This raises important questions about the nature and validity of sampling points used during experimentation. If the sampling point is located in the lower-zone, it becomes necessary to use equation (22) and know the value β in order to accurately determine the value of Zeff. If however, the
sampling point is in the upper-zone, then both equations (14,15) and (21) can be used, and if air is sampled from several points in the upper and lower zones simultaneously, then equations (14,15) should be used with the average sample value.
The complete mixing model has an inherent weakness that, with some experimental data, it predicts the survival fraction in the upper-room zone, and thus overestimates the microbial reduction achieved in the lower-zone. However, despite being inferior to the two-zone model it is much easier to use since it does not require the value of β to be known. Indeed, if the value β is greater than 20 (Noakes et al., 2004a), the room air is likely to be well mixed and so equations (14,15) will yield a good approximation of the survival fraction in the lower-room zone.
The results from experiments carried out in an aerobiology test chamber indicate that the calculated value of Zeff is similar at different ventilation rates, but is up to an order of magnitude lower than values obtained
in single pass experiments. This would suggest that the repeated exposure and subsequent potential for DNA repair seen in real room situations may result in a need for increased UV irradiation intensity to achieve the levels of inactivation suggested by the experiments carried out in the single pass test apparatus. Although in some situations expressing the impact of the UV irradiation as an equivalent air change rate (i.e. φuv) this is only useful once a UV system is in place. In terms of designing a system in a
ventilated room to achieve an equivalent air change rate against a specific pathogen, it is necessary to use UV susceptibility data in the calculations. Work is currently ongoing to examine the relationship between Zeff calculated from room studies and the single pass data for other microorganism species and climatic
from single pass experiments to predict the performance of upper room devices in real situations may result in a significant under prediction of the efficacy of such systems.
8. Conclusions
The following conclusions can be drawn from this study:
• It is possible to determine an effective UV susceptibility constant Zeff, of an airborne
microorganism by using an upper-room UV field in a ventilated test chamber.
• The continuous contamination method appears to be superior to the decay method as an experimental method for evaluating the air disinfection performance of UV lamps.
• While the complete mixing model accurately predicts the microbial survival fraction in the upper-room zone, if the upper-room air is not well mixed it will significantly underestimate the survival fraction in the lower room. Therefore, where possible the two-zone model should be used.
• The lower susceptibility constants for Serratia marcescens calculated from experiments in a test chamber compared to single pass experiments suggest that using single pass data to size upper-room UV installations may underestimate the required UV power.
Acknowledgements
The authors would like to acknowledge the support of the Engineering and Physical Sciences Research Council (EPSRC) for funding this work
References
Beggs, C.B., Kerr, K.G., Donnelly, J.K., Sleigh, P.A., Mara, D.D., Cairns, G. (2000) An engineering approach to the control of Mycobacterium tuberculosis and other airborne pathogens: a UK hospital based pilot study. T. Roy. Soc. Trop. Med. H.94, 141-146
Beggs, C.B. (2002) A quantitative method for evaluating the photoreactivation of ultraviolet damaged microorganisms. Photochem. Photobiol. Sci.1, 1-8
Beggs, C.B. and Sleigh, P.A. (2002) A quantitative method for evaluating the germicidal effect of upper room UV fields. J. Aerosol Sci. 33, 1681-1699
Brouns, C. and Waters, B. (1991) A guide to contaminant removal effectiveness. AIVC technical note 28.2.
Cox, C.S. (1995) Stability of airborne microbes and allergens. In C.S. Cox and C.M.Wathes (Eds) , Bioaerosols Handbook (p. 77). New York: Lewis Publishers
Dumyahn, T. and First, M. (1999) Characterization of ultraviolet upper room air disinfection devices. Am. Ind. Hyg. Assoc. J.60, 219-227
Fletcher, L.A., Noakes, C.J., Beggs, C.B., Sleigh, P.A. and Kerr, K.G. (2003) The ultraviolet susceptibility of aerosolised microorganisms and the role of photoreactivation. 2nd International Congress of the IUVA, Vienna, 9 – 11th July
Jensen, M.M. (1964). Inactivation of airborne viruses by ultraviolet irradiation. Applied Microbiology. 52, 418 – 420
Kowalski, W.J., Bahnfleth, W.P., Witham, D.L., Severin, B.F. and Whittam, T.S. (2000) Mathematical modelling of ultraviolet germicidal irradiation for air disinfection. Quant. Microbiol. 2, 249-270
Luckiesh, M. (1946). Applications of germicidal, erythemal and infrared energy. New York: D. Van Nostrand Company Inc.
Macher, J.M. (1989) Positive hole correction of multiple jet impactors for collecting viable organisms. Am. Ind. Hyg. Assoc. J. 50, 561-568
Miller, S.L., Xu, P., Peccia, J.L., Fabian, P. and Hernandez, M. (1999). Effects of ultraviolet germicidal irradiation of room air on airborne bacteria and mycobacteria, Proc. of 8th International Conference on Indoor Air Quality and Climate, Edinburgh, 2, 665 – 670
Miller, S.L. and Macher, J.M. (2000) Evaluation of a methodology for quantifying the effect of room air ultraviolet germicidal irradiation on airborne bacteria. Aerosol Sci. Tech.33, 274-295
Nicas, M. and Miller, S.L. (1999) A multi-zone model evaluation of the efficacy of upper-room air ultraviolet germicidal irradiation. Appl. Occup. Environ. Hyg.14, 317 – 328
Noakes, C.J., Beggs, C.B. and Sleigh, P.A. (2004a) Effect of Room Mixing and Ventilation Strategy on the Performance of Upper Room Ultraviolet Germicidal Irradiation Systems. ASHRAE IAQ Conference, Tampa, Florida, 15-17th March.
Noakes, C.J., Beggs, C.B. and Sleigh, P.A. (2004b) Modelling the Performance of Upper Room Ultraviolet Germicidal Irradiation Devices in Ventilated Rooms: Comparison of Analytical and CFD Methods. Indoor Built Enviro. 13, 477-488
Peccia, J., Worth, H.M., Miller, S. and Hernandez, M. (2001) Effects of Relative Humidity on the Ultraviolet Induced Inactivation of Airborne Bacteria. Aerosol Sci. Tech. 35, 728-740
Peccia, J. and Hernandez, M.T. (2001) Photoreactivation in airborne Mycobacterium parafortuitum. Appl. Environ. Microbiol.67, 4225-4232
Rentschler, H.C. (1941). Bactericidal effect of ultraviolet radiation. J. Bacteriol. 42, 745 – 774
Riley, R.L., Knight, M. and Middlebrook, G. (1976) Ultraviolet susceptibility of BCG and virulent tubercle bacilli. Am. Rev. Respir. Dis. 113, 413-418
Riley, R.L. and Permutt, S. (1971) Room air disinfection by ultraviolet irradiation of upper air, Arch. Environ. Health.22, 208-219
Riley, R.L. and Kaufman, J.E. (1972) Effect of relative humidity on the inactivation of airborne Serratia marcescens by ultraviolet radiation. Appl. Microbiol. 23, 1113-1120
Rudnick, S.N. (2001) Predicting the ultraviolet radiation distribution in a room with multilouvered germicidal fixtures. Am. Ind. Hyg. Assoc. J.62, 434-445
Sharp, D.G. (1938). A quantitative method of determining the lethal effect of ultraviolet light on bacteria suspended in air. J. Bacteriol. 35, 589 – 599
Sharp, G. (1940) The effects of ultraviolet light on bacteria suspended in air. J. Bacteriol.38, 535-547 Skåret, E. 1986. Ventilation by displacement – characterization and design implications. Ventilation ’85 Edited by H.D. Goodfellow, Amsterdam: Elsevier Science Publishers