RESEARCH ARTICLE
Identification of valid reference genes
for microRNA expression studies in a hepatitis B
virus replicating liver cell line
Kari Stougaard Jacobsen
1,2, Kirstine Overgaard Nielsen
1,2, Thilde Nordmann Winther
1, Dieter Glebe
3,
Flemming Pociot
2and Birthe Hogh
1*Abstract
Background: MicroRNAs are regulatory molecules and suggested as non-invasive biomarkers for molecular diagnos-tics and prognosdiagnos-tics. Altered expression levels of specific microRNAs are associated with hepatitis B virus infection and hepatocellular carcinoma. We previously identified differentially expressed microRNAs with liver-specific target genes in plasma from children with chronic hepatitis B. To further understand the biological role of these microRNAs in the pathogenesis of chronic hepatitis B, we have used the human liver cell line HepG2, with and without HBV replication, after transfection of hepatitis B virus expression vectors. RT-qPCR is the preferred method for microRNA studies, and a careful normalisation strategy, verifying the optimal set of reference genes, is decisive for correctly evaluating micro-RNA expression levels. The aim of this study was to provide valid reference genes for the human HCC-derived cell line HepG2.
Results: A panel of 739 microRNAs was screened to identify the most stably expressed microRNAs, followed by a PubMed search identifying microRNAs previously used as reference genes. Sixteen candidate reference genes were validated by RT-qPCR. Reference gene stabilities were calculated first by standard deviations of ΔCt values and then by geNorm and NormFinder analyses, taking into account the amplification efficiency of each microRNA primer set. The optimal set of reference genes was verified by a target analysis using RT-qPCR on miR-215-5p.
Conclusion: We identified miR-24-3p, miR-151a-5p, and miR-425-5p as the most valid combination of reference genes for microRNA RT-qPCR studies in our hepatitis B virus replicating HepG2 cell model.
Keywords: Reference genes, Normalisation, microRNA, Hepatitis B virus, RT-qPCR
© 2016 Jacobsen et al. This article is distributed under the terms of the Creative Commons Attribution 4.0 International License (http://creativecommons.org/licenses/by/4.0/), which permits unrestricted use, distribution, and reproduction in any medium, provided you give appropriate credit to the original author(s) and the source, provide a link to the Creative Commons license, and indicate if changes were made. The Creative Commons Public Domain Dedication waiver (http://creativecommons.org/ publicdomain/zero/1.0/) applies to the data made available in this article, unless otherwise stated.
Background
MicroRNAs are suggested as non-invasive biomarkers for molecular diagnostics and prognostics, and some microRNAs show promising results as therapeutic tar-gets in human trials [1–3]. A single microRNA can have multiple downstream targets and affect a number of dif-ferent networks and pathways [4, 5]. Even small changes in microRNA expression may therefore have implications for gene regulation in various physiological and patho-physiological states [1, 6].
Hepatitis B virus (HBV) infection is a world-wide prob-lem and approximately 240 million people live with a chronic HBV infection. HBV is one of the leading causes of hepatocellular carcinoma (HCC) and is responsible for the death of around 780,000 people each year [7].
MicroRNAs are thought to play an important role in early HBV infection, chronic HBV infection, and HBV-related cirrhosis and HCC [8–10]. Chronic hepati-tis B (CHB) in children is associated with a high risk of developing HCC over time [11, 12]. Current knowledge on the pathogenesis at the molecular level is, however, limited [13]. We previously identified a panel of differ-entially expressed microRNAs in plasma from children with CHB [14] and furthermore showed that a number of
Open Access
*Correspondence: [email protected]
1 Department of Paediatrics, Hvidovre Hospital, University
of Copenhagen, Copenhagen, Denmark
the identified microRNAs had liver-specific target genes [15]. Liver tissue samples are unavailable as the majority of children with CHB are asymptomatic. Instead we use an in vitro HBV-replicating liver cell model to investigate the biological role of microRNAs with a possible influ-ence on the pathogenesis of CHB in children.
RT-qPCR is often the preferred method for microRNA expression studies because of its sensitivity, flexibility, wide dynamic range, accuracy, and high throughput [16,
17]. Correct normalisation of microRNA RT-qPCR data is important to avoid erroneous conclusions [18]. Cur-rently, there is no standardised normalisation strategy for microRNA RT-qPCR expression studies [19]. The small nuclear RNA U6 is frequently used as a reference gene (RG) in such studies [20]. Another strategy that has achieved general acceptance in RT-qPCR studies is identification of valid RGs by computer software such as geNorm and NormFinder [21, 22].
The present study was conducted to identify suitable RGs for microRNA expression studies in a human HCC-derived cell line (HepG2 tet-on), with and without HBV replication, after transfection of HBV expression vectors. We performed a systematic evaluation and identified miR-24-3p, miR-151a-5p, and miR-425-5p as the most valid combination of RGs in our model system. Results were verified by assessment of miR-215-5p, which is known to have a role in the pathogenesis of HBV infec-tion [23, 24].
Results and discussion
Identification of candidate reference genes
Experiments were performed in the human HCC-derived cell line HepG2 tet-on. HBV replication was introduced by a doxycycline-inducible vector containing the 3091 HBV genome [25].
We applied a human microRNA PCR panel (Exiqon, Vedbaek, Denmark) to identify a number of stably expressed microRNAs. The microRNA panel included 739 microRNAs, and according to the manufacturer it included microRNAs that are either (1) generally more highly expressed, (2) more likely to be differen-tially expressed in disease, or (3) more often cited in the literature. We investigated the overall expression at two different time points (48 and 72 h) in the con-trol HepG2 tet-on cell line and the HBV-replicating cell line (DOXY) (See Additional file 1 Figure S1 for heat-map, and Additional file 2 Table S1 for raw CT values).
We identified the presence of 137 microRNAs, using an exclusion value of CT ≥ 32. We then evaluated the
overall stability of each microRNA by calculating the standard deviation (SD) for all samples. MicroRNAs with SD values below 0.2 (35 microRNAs in total) were further investigated in a PubMed search to identify
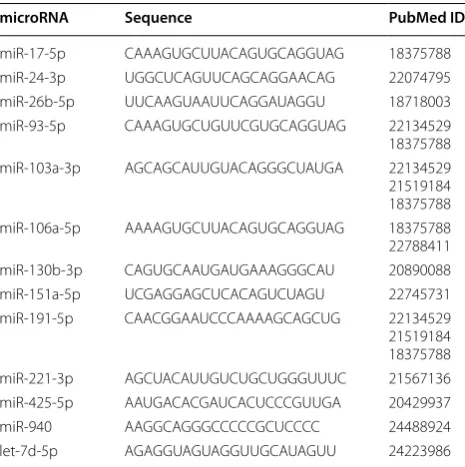
the microRNAs previously used as RGs. On this basis, 13 microRNAs (miR-17-5p, -24-3p, -26b-5p, -93-5p, -103a-3p, -106a-5p, -130b-3p, -151a-5p, -191-5p, -221-3p, -425-5p, -940 and let-7d-5p) were selected as can-didate RGs (Table 1). Three small nuclear non-coding RNAs (U6 snRNA, SNORD38B, and SNORD49A) that are often used as RGs in microRNA expression studies [20, 26–28] were included to test for the importance of structural similarities, when choosing appropriate RGs. In total, 16 non-coding RNAs were subjected to further investigation.
Individual RT‑qPCR and amplification efficiency
The selected candidate RGs were analysed by RT-qPCR. MiR-103a-3p and miR-let-7d-5p were excluded from further analyses because of CT values > 32. Mean CT
val-ues ± SD are shown in Table 2.
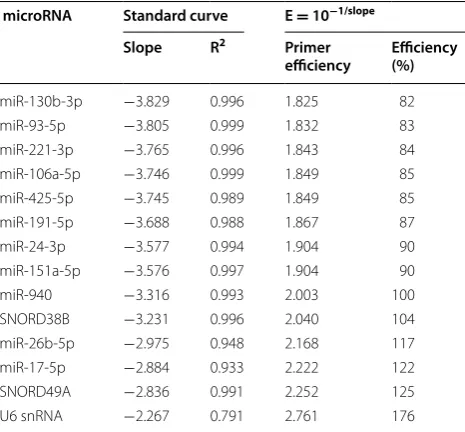
We evaluated the primer amplification efficiencies of the remaining 14 non-coding RNAs. The optimal primer efficiency is 2.0 corresponding to a doubling of the target in each cycle. In the present setup we used Locked Nucleic Acid (LNA) primers [29] and obtained amplification efficiencies from 1.8 to 2.7 (efficiencies and R2 values are listed in Table 3). LNA primers have
been shown to have low amplification efficiencies [30] but were used in this study to ensure high affinity, spec-ificity, and stability with regards to the microRNAs of interest [17, 31]. Calculated primer efficiencies were used in both our geNorm and NormFinder analyses [32].
Table 1 Candidate reference genes for microRNA normali-sation
microRNA Sequence PubMed ID
miR-17-5p CAAAGUGCUUACAGUGCAGGUAG 18375788
miR-24-3p UGGCUCAGUUCAGCAGGAACAG 22074795
miR-26b-5p UUCAAGUAAUUCAGGAUAGGU 18718003
miR-93-5p CAAAGUGCUGUUCGUGCAGGUAG 22134529
18375788
miR-103a-3p AGCAGCAUUGUACAGGGCUAUGA 22134529
21519184 18375788
miR-106a-5p AAAAGUGCUUACAGUGCAGGUAG 18375788
22788411
miR-130b-3p CAGUGCAAUGAUGAAAGGGCAU 20890088
miR-151a-5p UCGAGGAGCUCACAGUCUAGU 22745731
miR-191-5p CAACGGAAUCCCAAAAGCAGCUG 22134529
21519184 18375788
miR-221-3p AGCUACAUUGUCUGCUGGGUUUC 21567136
miR-425-5p AAUGACACGAUCACUCCCGUUGA 20429937
miR-940 AAGGCAGGGCCCCCGCUCCCC 24488924
[image:2.595.305.538.491.725.2]Stability analysis by ∆Ct, geNorm and NormFinder
Overall expression stability of our 14 candidate RGs was evaluated by calculating the SD of the ∆Ct values from samples taken over time (24–96 h) in the cell lines: HepG2 tet-on, DOXY, and its negative control contain-ing the non-replicatcontain-ing HBV genome. Top three were miR-151a-5p, miR-24-3p and miR-93-5p with SD val-ues < 0.3. geNorm selects the optimal number of RGs based on the calculation of a stability value (M) and a
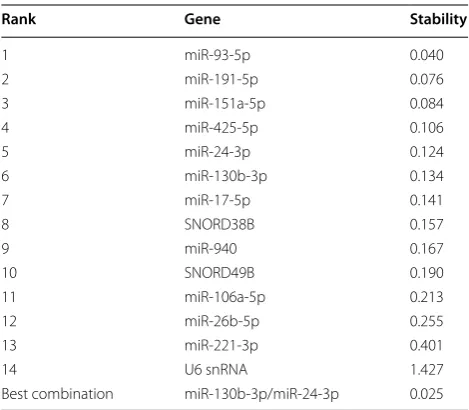
pairwise variation value (V). In our analysis, miR-93-5p and miR-151-3p were identified as the most stable RG pair (M = 0.15) (Fig. 1a). A pairwise variation analysis showed that two RGs should suffice (V = 0.06), but add-ing a third gene (miR-425-5p) would improve normalisa-tion (V = 0.05) (Fig. 1b). Three is also the lowest number of RGs recommended for use in microRNA expression studies [33]. One microRNA, miR-940, had an M-value above the exclusion limit of 1.5 (M = 5.43), making it unsuitable as a RG (Fig. 1a). NormFinder identifies the best normalisation gene from a group of candidates by calculating a stability value for each candidate. Our anal-ysis revealed miR-93-5p as the best RG, with a stability value of 0.04. The best combination of genes was miR-130b-3p and miR-24-3p, lowering the stability value to 0.025 (Table 4).
A top-five comparison between the three approaches examined above found 151a-5p, 93-5p, miR-24-3p, and miR-425-5p to be the best RGs. According to geNorm three RGs are sufficient for optimal normalisa-tion. Taking the amplification efficiencies into account (Table 3), the best combination to use in the present model system is 151a-5p, 425-5p, and miR-24-3p (Fig. 2).
It is worth noting that U6, which is often used as a RG in microRNA RT-qPCR studies, had the most deviated amplification efficiency (E = 2.761) and ranked last or second to last in the three analyses.
Validation of the cell model system
We make use of the human liver cell model HepG2 tet-on for our in vitro studies due to lack of primary tissue from asymptomatic children with CHB. We introduced a doxy-cycline-inducible vector containing the HBV genome and the transactivator controlling mature virus production. Two genes work independently of this transactivator: The S gene, coding for the three surface proteins present in the viral envelope, and the X gene found to have onco-genic properties [34]. These proteins are continuously expressed independently of doxycycline-induction.
To evaluate our model system we investigated the expression of the most abundant liver specific micro-RNA, miR-122. miR-122 has been found to inhibit the expression and replication of HBV, and it is found down-regulated upon HBV infection, possibly facilitating viral replication and persistence [35–37]. We found the expression of miR-122-5p significantly decreased upon the insertion of the HBV plasmid independent of HBV replication [CT = 24 in the HepG2 tet-on cell line and
CT = 34 in the cell lines containing the HBV genome with
[image:3.595.57.291.113.329.2]or without induction (p < 0.0001)]. This is in accordance with results from previous studies identifying the HBx protein as a negative regulator of miR-122 expression [37,
Table 2 Mean Ct values for the 16 candidate reference genes
Reference genes with CT values > 32 were excluded from further analyses
microRNA Raw Ct value (mean) SD
miR-221-3p 27.11 0.64
let-7d-5p 32.60 0.99
miR-106a-5p 24.32 0.35
miR-103a-3p 38.52 0.79
miR-93-5p 25.15 0.27
miR-17-5p 29.86 0.32
miR-26b-5p 28.54 0.41
miR-130b-3p 29.82 0.40
miR-24-3p 25.58 0.26
miR-425-5p 27.89 0.31
miR-191-5p 26.93 0.32
miR-151a-5p 27.19 0.24
miR-940 30.84 0.30
U6 snRNA 23.78 1.56
SNORD38B 23.36 0.38
SNORD49B 22.91 0.38
Table 3 PCR amplification efficiencies
microRNA Standard curve E = 10−1/slope
Slope R2 Primer
efficiency Efficiency (%)
miR-130b-3p −3.829 0.996 1.825 82
miR-93-5p −3.805 0.999 1.832 83
miR-221-3p −3.765 0.996 1.843 84
miR-106a-5p −3.746 0.999 1.849 85
miR-425-5p −3.745 0.989 1.849 85
miR-191-5p −3.688 0.988 1.867 87
miR-24-3p −3.577 0.994 1.904 90
miR-151a-5p −3.576 0.997 1.904 90
miR-940 −3.316 0.993 2.003 100
SNORD38B −3.231 0.996 2.040 104
miR-26b-5p −2.975 0.948 2.168 117
miR-17-5p −2.884 0.933 2.222 122
SNORD49A −2.836 0.991 2.252 125
[image:3.595.57.290.377.593.2]38], and the constitutive expression of the HBx protein in the transfected cell lines. This result supports the usage of this cell model system to investigate the biological role of microRNAs in HBV infection.
Validation of reference genes
To assess the reliability of our selected RGs, we per-formed a target analysis on miR-215-5p, previously found to be up-regulated in CHB in children and adults as well as in HBV-related HCC [14, 23, 24, 39]. We studied the expression of miR-215-5p in HepG2 cells with and without HBV replication by RT-qPCR after 48 h of doxycycline treatment, and we normalised using miR-24-3p, miR-151a-5p, and miR-425-5p. Fold change was calculated using the 2−∆∆Ct method [40]. We found
a significant up-regulation of miR-215-5p in the DOXY cell line compared to the control HepG2 tet-on cell line (0.2 fold, p = 0.04). We also normalised against the commonly used RG U6 and found miR-215-5p to
5.43
0.66
0.35 0.32 0.30 0.28 0.27 0.25 0.23 0.22 0.19 0.18 0.15
0,1 1,1 2,1 3,1 4,1 5,1 6,1
940 U6 snRNA 221-3p 26b-5p SNORD49B 130b-3p SNORD38B 191-5p 17-5p 106a-5p 24-3p 425-5p 93-5p 151a-5p
Average expression stability
M
<::::: Least stable genes Most stable genes ::::>
Average expression stability values of remaining control genes
0,060
0,046 0,045 0,037 0,035 0,036
0,034 0,031 0,030 0,041
0,182
0,022
0,00 0,02 0,04 0,06 0,08 0,10 0,12 0,14 0,16 0,18 0,20
V2/3 V3/4 V4/5 V5/6 V6/7 V7/8 V8/9 V9/10 V10/11 V11/12 V12/13 V13/14
Pairwise Variations
Determination of the optimal number of control genes for normalization
a
b
[image:4.595.59.540.91.405.2]Fig. 1 geNorm analysis of candidate reference genes. a Ranking of reference genes according to the average expression stability M. A stepwise exclusion strategy identified miR-93-5p and miR-151a-5p as the most stable reference gene pair. b Determination of the optimal number of refer-ence genes for normalisation, concluding that top three most stable referrefer-ence genes would suffice for correct normalisation
Table 4 NormFinder results. Candidate reference genes ranked according to expression stability
Rank Gene Stability
1 miR-93-5p 0.040
2 miR-191-5p 0.076
3 miR-151a-5p 0.084
4 miR-425-5p 0.106
5 miR-24-3p 0.124
6 miR-130b-3p 0.134
7 miR-17-5p 0.141
8 SNORD38B 0.157
9 miR-940 0.167
10 SNORD49B 0.190
11 miR-106a-5p 0.213
12 miR-26b-5p 0.255
13 miR-221-3p 0.401
14 U6 snRNA 1.427
[image:4.595.56.291.483.688.2]be up-regulated by 11.2 fold (p = 0.01). The raw CT
values showed approximately 1 cycle between HepG2 tet-on and DOXY. U6 is thus not a robust RG in this model system. Several authors have expressed concern about the use of this specific spliceosomal RNA as RG in microRNA studies because of its variability in struc-ture and abundance as well as its often high degree of variance across samples [19, 20, 41, 42]. Our study demonstrates the importance of correct normalisation in microRNA expression studies, where even small changes in expression can have a vast downstream effect [5]. Comparison across studies requires validated RGs to avoid analytical errors and contradictory results [16, 19].
Conclusion
We evaluated 16 small non-coding RNAs as possible RGs in a HBV-replicating liver cell line using ∆CT and
the two software algorithms geNorm and NormFinder. We identified miR-24-3p, miR-151a-5p, and miR-425-5p as the most valid combination of RGs to use for micro-RNA studies in this HBV-replicating HepG2 cell system and confirmed their validity with miR-215-5p. This result establishes a solid foundation for further studies in this cell culture model.
Methods
Cell lines and cell culture
The HepG2 tet-on Advanced Cell Line was purchased from Clontech (California, USA), cultured in DMEM media with 2 % fetal calf serum (FCS), 1 % penicillin/ streptomycin, and G418 (100 µg/ml) at 37° C with 5 % CO2. To produce an HBV-replicating cell line, we
intro-duced a doxycycline-inducible vector that contained
the transactivator and an HBV genome encoding for HBV genotype D (ayw3 serotype) [25, 43]. The transac-tivator controls the synthesis of the HBV pregenomic mRNA and thus expression of the Polymerase gene and the PreCore/Core gene, while the Surface proteins gene and the X gene are transcribed continuously using their individual promoters. HBV replication was activated by applying doxycycline (1 µg/ml) to the media.
Verification of viral replication
Media and cells were sampled at 7 time points at 12 h intervals (24–96 h). Media was changed following the 48 h sampling to ensure optimal growth conditions. All cell lines were tested for HBV replication prior to further analyses. HBsAg was measured from the media using an in-house sandwich ELISA [C20/2, sample, Anti-HBs-Biotin, Streptavidin-Peroxidase and substrate (OPD)] as previously described [44]. The cell lines transfected with the vector containing the HBV genome with and without doxycycline showed similar amounts of HBsAg in their media, corresponding to the design explained in the sec-tion above. HBV DNA was only measured in media from the HBV-replicating cell line (data not shown).
RNA extraction and cDNA synthesis
Total RNA was extracted from cell lines using the miRNeasy Mini Kit (Qiagen, Hilden, Germany) in accordance with the manufacturer’s instructions, with minor modifications (200 µL chloroform was added, and after samples were applied to RNeasy Mini spin columns all centrifugation steps were performed at room tem-perature (RT) at 13,000×g). Elution was performed once with 50 µL RNase-free water. RNA concentrations were determined and evaluated using the NanoDrop 2000c spectrophometer (Thermo Scientific Waltham, Mas-sachusetts, USA), measuring the absorbance at 260 nm as well as the absorbance ratio 260/280 nm to check for proper RNA quality. RNA samples were stored at −80° C.
cDNA synthesis was performed using the Universal cDNA Synthesis Kit II (Exiqon, Vedbaek, Denmark) in accordance with the manufacturer’s instructions and conducted on a GeneAmp PCR System 9700 (Applied Biosystems, Carlsbad, California, USA). 10 ng RNA was used for each cDNA synthesis, and blank samples with H2O as template were included. cDNA was stored at
−20° C until further use.
Quantitative real‑time PCR
microRNA PCR panels
microRNA expressions were analysed in the cell lines using human microRNA PCR Panels (Human Panel I and II V2.M) and miRCURY LNA™ Universal RT microRNA PCR system (Exiqon, Vedbaek, Denmark) as described
[image:5.595.57.291.89.258.2]previously [14]. To further narrow down the putative RG candidates, a PubMed search was performed on each candidate to identify the microRNAs that have previously been used as RGs in at least one publication.
Individual RT‑qPCR
Quantification of microRNA expression levels were per-formed by RT-qPCR using the miRCURY LNA™ Univer-sal RT microRNA PCR system and specific microRNA LNA™ PCR primer sets (Exiqon, Vedbaek, Denmark). Specific microRNA target sequences are shown in Table 1. cDNA was diluted 80× and run in accordance with Exiqon’s instructions manual on a CFX384 Real-Time thermal cycler (Biorad, Hercules, California, USA). Each sample was run in duplicate, and negative con-trols with no-template and blanks as well as a spike-in, UniSp6, were assayed in each run.
Amplification efficiency
Amplification efficiency for each microRNA LNA™ PCR primer set was determined by standard curve analysis. Dilution series were made from a pool of cDNA includ-ing samples from all cell lines and all time points. Each sample was run in duplicate, and blank samples were included as negative controls. A CT cut-off value was set
to 36 for all primer efficiency analyses. Standard curve analyses were performed in duplicate, and average amplification efficiencies were used for further analyses.
Analysis of RT‑qPCR data
Expression stability of the testet RGs was analysed using two widely applied algorithms: geNorm [21] and NormFinder [22]. The geNorm algorithm calculates an M-value that represents a gene’s variation compared to other candidate genes. A stepwise exclusion strat-egy identifies the two most stable genes. A candidate RG with an M-value above 1.5 is not considered a suit-able RG. geNorm also calculates a V-value that deter-mines the optimal number of RGs for normalisation. Starting with the two most stably expressed genes, a third, fourth, fifth, etc. is added, illustrating the lev-els of variation in average reference gene stability. A V-score below 0.15 is adequate for normalisation. The NormFinder algorithm calculates a stability value. The gene with the lowest stability value is determined to be the most stable RG. NormFinder provides both the best stable RG as well as the best stable pair of RGs. This is done by taking the different subgroups into account, estimating the inter-group and intra-group variations across the samples, identifying potential co-regulation between the candidates in the different subgroups.
Statistics
All data is represented as raw data or as mean ± SD. Statistical analyses were performed in GraphPad Prism 6 using the unpaired Student’s t test (two-tailed). p-val-ues < 0.05 were considered significant.
Author’s contributions
KSJ, KON, TNW, DG, FP, BH concieved and designed the study. DG provided the HepG2 cell lines. KSJ and KON performed the experiments. KSJ, KON analysed the data. KSJ, KON, TNW, FP, BH wrote the manuscript. All authors read and approved the final manuscript.
Author details
1 Department of Paediatrics, Hvidovre Hospital, University of Copenhagen,
Copenhagen, Denmark. 2 Department of Paediatrics and Center for
Non-Cod-ing RNA in Technology and Health, Herlev Hospital, University of Copenhagen, Copenhagen, Denmark. 3 Institute of Medical Virology, National Reference
Center for Hepatitis B and D Viruses, German Center for Infection Research, Biomedical Research Center Seltersberg, Justus-Liebig University Giessen, Giessen, Germany.
Acknowledgements
The excellent technical assistance of Sigrun Broehl, and the bioinformatic analysis performed by Aashiq Hussain Mirza is gratefully acknowledged.
Competing interests
The authors declare no conflicts of interest regarding the publication of this paper.
Received: 15 September 2015 Accepted: 8 January 2016
References
1. Mohr AM, Mott JL. Overview of microRNA biology. Semin Liver Dis. 2015;35(1):3–11. doi:10.1055/s-0034-1397344.
2. Lan H, Lu H, Wang X, Jin H. MicroRNAs as potential biomarkers in cancer: opportunities and challenges. BioMed Res Int. 2015;2015:125094. doi:10.1155/2015/125094.
3. Arrese M, Eguchi A, Feldstein AE. Circulating microRNAs: emerging biomarkers of liver disease. Semin Liver Dis. 2015;35(1):43–54. doi:10.105 5/s-0034-1397348.
4. Avraham R, Yarden Y. Regulation of signalling by microRNAs. Biochem Soc Trans. 2012;40(1):26–30. doi:10.1042/bst20110623.
5. Pritchard CC, Cheng HH, Tewari M. MicroRNA profiling: approaches and considerations. Nat Rev Genet. 2012;13(5):358–69. doi:10.1038/nrg3198. 6. Li Y, Kowdley KV. MicroRNAs in common human diseases. Genomics
Prot-eomics Bioinformatics. 2012;10(5):246–53. doi:10.1016/j.gpb.2012.07.005. 7. WHO. Hepatitis B. World Health Organization fact sheet No. 204. 2015. 8. Cullen BR. MicroRNAs as mediators of viral evasion of the immune
sys-tem. Nat Immunol. 2013;14(3):205–10. doi:10.1038/ni.2537.
Additional files
Additional file 1: Figure S1. Heatmap of microRNA screen performed on the raw Ct values.
9. Thirion M, Ochiya T. Roles of microRNAs in the hepatitis B virus infection and related diseases. Viruses. 2013;5(11):2690–703. doi:10.3390/v5112690. 10. Li C, Hu J, Hao J, Zhao B, Wu B, Sun L, et al. Competitive virus and host
RNAs: the interplay of a hidden virus and host interaction. Protein Cell. 2014;5(5):348–56. doi:10.1007/s13238-014-0039-y.
11. Luo Z, Li L, Ruan B. Impact of the implementation of a vaccination strategy on hepatitis B virus infections in China over a 20-year period. Int J Infect Dis. 2012;16(2):e82–8. doi:10.1016/j.ijid.2011.10.009.
12. Paganelli M, Stephenne X, Sokal EM. Chronic hepatitis B in children and adolescents. J Hepatol. 2012;57(4):885–96. doi:10.1016/j.jhep.2012.03.036. 13. Prendergast AJ, Klenerman P, Goulder PJ. The impact of differential antivi-ral immunity in children and adults. Nat Rev Immunol. 2012;12(9):636–48. doi:10.1038/nri3277.
14. Winther TN, Bang-Berthelsen CH, Heiberg IL, Pociot F, Hogh B. Differential Plasma MicroRNA Profiles in HBeAg Positive and HBeAg Negative Chil-dren with Chronic Hepatitis B. PLoS ONE. 2013;8(3):e58236. doi:10.1371/ journal.pone.0058236.
15. Winther TN, Jacobsen KS, Mirza AH, Heiberg IL, Bang-Berthelsen CH, Pociot F, et al. Circulating MicroRNAs in Plasma of Hepatitis B e Antigen Positive Children Reveal Liver-Specific Target Genes. Int J Hepatol. 2014;2014:791045. doi:10.1155/2014/791045.
16. Huggett J, Dheda K, Bustin S, Zumla A. Real-time RT-PCR normalisa-tion; strategies and considerations. Genes Immun. 2005;6(4):279–84. doi:10.1038/sj.gene.6364190.
17. Hunt EA, Broyles D, Head T, Deo SK. MicroRNA Detection: current Technol-ogy and Research Strategies. Annu Rev Anal Chem (Palo Alto Calif ). 2015;. doi:10.1146/annurev-anchem-071114-040343.
18. Matouskova P, Bartikova H, Bousova I, Hanusova V, Szotakova B, Skalova L. Reference genes for real-time PCR quantification of messenger RNAs and microRNAs in mouse model of obesity. PLoS ONE. 2014;9(1):e86033. doi:10.1371/journal.pone.0086033.
19. Tang G, Shen X, Lv K, Wu Y, Bi J, Shen Q. Different normalization strate-gies might cause inconsistent variation in circulating microRNAs in patients with hepatocellular carcinoma. Med Sci Monit. 2015;21:617–24. doi:10.12659/msm.891028.
20. Peltier HJ, Latham GJ. Normalization of microRNA expression levels in quantitative RT-PCR assays: identification of suitable reference RNA tar-gets in normal and cancerous human solid tissues. RNA. 2008;14(5):844– 52. doi:10.1261/rna.939908.
21. Vandesompele J, De Preter K, Pattyn F, Poppe B, Van Roy N, De Paepe A, et al. Accurate normalization of real-time quantitative RT-PCR data by geometric averaging of multiple internal control genes. Genome Biol. 2002;3(7):34.
22. Andersen CL, Jensen JL, Orntoft TF. Normalization of real-time quantita-tive reverse transcription-PCR data: a model-based variance estima-tion approach to identify genes suited for normalizaestima-tion, applied to bladder and colon cancer data sets. Cancer Res. 2004;64(15):5245–50. doi:10.1158/0008-5472.can-04-0496.
23. Zhang ZQ, Meng H, Wang N, Liang LN, Liu LN, Lu SM, et al. Serum micro-RNA 143 and micromicro-RNA 215 as potential biomarkers for the diagnosis of chronic hepatitis and hepatocellular carcinoma. Diagn Pathol. 2014;9:135. doi:10.1186/1746-1596-9-135.
24. Liu F, You X, Chi X, Wang T, Ye L, Niu J, et al. Hepatitis B virus X pro-tein mutant HBxDelta127 promotes proliferation of hepatoma cells through up-regulating miR-215 targeting PTPRT. Biochemical and biophysical research communications. 2014;444(2):128–34. doi:10.1016/j. bbrc.2014.01.004.
25. Junker M, Galle P, Schaller H. Expression and replication of the hepatitis B virus genome under foreign promoter control. Nucleic Acids Res. 1987;15(24):10117–32.
26. Jiang J, Lee EJ, Gusev Y, Schmittgen TD. Real-time expression profiling of microRNA precursors in human cancer cell lines. Nucleic Acids Res. 2005;33(17):5394–403. doi:10.1093/nar/gki863.
27. Torres A, Torres K, Wdowiak P, Paszkowski T, Maciejewski R. Selec-tion and validaSelec-tion of endogenous controls for microRNA expression studies in endometrioid endometrial cancer tissues. Gynecol Oncol. 2013;130(3):588–94. doi:10.1016/j.ygyno.2013.06.026.
28. Chen X, Liang H, Guan D, Wang C, Hu X, Cui L, et al. A combination of Let-7d, Let-7 g and Let-7i serves as a stable reference for normalization of serum microRNAs. PLoS ONE. 2013;8(11):e79652. doi:10.1371/journal. pone.0079652.
29. Roberts P. MicroRNA expression profiling on arrays enhaced with locked nucleic acids. Nat Methods. 2006.
30. Balcells I, Cirera S, Busk PK. Specific and sensitive quantitative RT-PCR of miRNAs with DNA primers. BMC Biotechnol. 2011;11:70. doi:10.1186/1472-6750-11-70.
31. Mestdagh P, Hartmann N, Baeriswyl L, Andreasen D, Bernard N, Chen C, et al. Evaluation of quantitative miRNA expression platforms in the micro-RNA quality control (miRQC) study. Nat Methods. 2014;11(8):809–15. doi:10.1038/nmeth.3014.
32. Pfaffl MW. A new mathematical model for relative quantification in real-time RT-PCR. Nucleic Acids Res. 2001;29(9):e45.
33. Johnson G, Nour AA, Nolan T, Huggett J, Bustin S. Minimum information necessary for quantitative real-time PCR experiments. Methods Mol Biol. 2014;1160:5–17. doi:10.1007/978-1-4939-0733-5_2.
34. Glebe D, Bremer CM. The molecular virology of hepatitis B virus. Semin Liver Dis. 2013;33(2):103–12. doi:10.1055/s-0033-1345717.
35. Chen Y, Shen A, Rider PJ, Yu Y, Wu K, Mu Y, et al. A liver-specific micro-RNA binds to a highly conserved micro-RNA sequence of hepatitis B virus and negatively regulates viral gene expression and replication. FASEB J. 2011;25(12):4511–21. doi:10.1096/fj.11-187781.
36. Wang S, Qiu L, Yan X, Jin W, Wang Y, Chen L, et al. Loss of microRNA 122 expression in patients with hepatitis B enhances hepatitis B virus replication through cyclin G(1) -modulated P53 activity. Hepatology. 2012;55(3):730–41. doi:10.1002/hep.24809.
37. Peng F, Xiao X, Jiang Y, Luo K, Tian Y, Peng M, et al. HBx down-regulated Gld2 plays a critical role in HBV-related dysregulation of miR-122. PLoS ONE. 2014;9(3):e92998. doi:10.1371/journal.pone.0092998.
38. Song K, Han C, Zhang J, Lu D, Dash S, Feitelson M, et al. Epigenetic regulation of miR-122 by PPARgamma and hepatitis B virus X protein in hepatocellular carcinoma cells. Hepatology. 2013. doi:10.1002/hep.26514. 39. Gui J, Tian Y, Wen X, Zhang W, Zhang P, Gao J, et al. Serum microRNA
characterization identifies miR-885-5p as a potential marker for detecting liver pathologies. Clin Sci. 2011;120(5):183–93. doi:10.1042/cs20100297. 40. Livak KJ, Schmittgen TD. Analysis of relative gene expression data using
real-time quantitative PCR and the 2(-Delta Delta C(T)) method. Methods. 2001;25(4):402–8. doi:10.1006/meth.2001.1262.
41. Xiang M, Zeng Y, Yang R, Xu H, Chen Z, Zhong J, et al. U6 is not a suitable endogenous control for the quantification of circulating microRNAs. Biochem Biophysical Res Commun. 2014;454(1):210–4. doi:10.1016/j. bbrc.2014.10.064.
42. Chugh P, Dittmer DP. Potential pitfalls in microRNA profiling. Wiley Inter-discip Rev RNA. 2012;3(5):601–16. doi:10.1002/wrna.1120.
43. Drexler JF, Geipel A, Konig A, Corman VM, van Riel D, Leijten LM, et al. Bats carry pathogenic hepadnaviruses antigenically related to hepatitis B virus and capable of infecting human hepatocytes. Proc Natl Acad Sci of U S A. 2013;110(40):16151–6. doi:10.1073/pnas.1308049110.