Int. J. Electrochem. Sci., 12 (2017) 1670 – 1679, doi: 10.20964/2017.03.27
International Journal of
ELECTROCHEMICAL
SCIENCE
www.electrochemsci.orgHydrothermal Synthesis of High Specific Capacity Al-doped
V
6O
13Cathode Material for Lithium-Ion Battery
Zhengguang Zou*, Qi Yuan, Jilin Wang, Yao Gao, Yi Wu, Fei Long, Shichang Han, Zhendong Wan
College of Materials Science and Engineering, Guilin University of Technology, Guilin, China
*
E-mail: [email protected]
Received: 2 December 2016 / Accepted: 9 January 2017 / Published: 12 February 2017
Al-doped V6O13 were synthesized via a facile hydrothermal method using vanadium pentoxide, oxalic
acid dehydrate, aluminum nitrate nonahydrate and deionized water as the starting materials. XRD, FESEM, EDS and XPS were employed to characterize the phase, morphology, composition and valence of the as-synthesized samples. After doping Al3+, the discharge specific capacity and cycle performance of the samples could be significantly improved. When the mole ratio of Al/V was 0.041, the sample exhibited the best electrochemical performance. The initial discharge specific capacity was 496 mAh•g−1 and the capacity retention was 45.8% after cycling for 100 times. The enhanced electrochemical performance originated from that the sample was adhered together by stacking region in a regular arrangement and presented larger clearance between layers which could accommodate much more lithium-ion(Li+) during the charge and discharge processes. Meanwhile, the increased specific capacity was attributed to the enhancement of the electrical conductivity after Al3+ doping.
Keywords: lithium-ion battery; V6O13; Al-doped; electrochemical performance
1. INTRODUCTION
The specific capacity and cycle performance of lithium ion battery were depended on electrode materials capacity. Traditional cathode materials (such as LiCoO2, LiNiO2, LiMnO2 and LiFePO4)
showed a low theoretical specific capacity, the specific capacity of these battery devices were about 150 mAh/g. Among various potential cathode candidates for lithium-ion battery, vanadium oxides had been extensively researched due to the multiple vanadium oxidation states, high specific capacity, widely availability and low cost. Multiple vanadium oxidation states (+2, +3, +4, +5) lead to single-valence and mix-single-valence vanadium oxides (for example VO2, V6O13, V3O7 and V2O5). These
compounds had partially filled d-orbitals indicating a particular electrochemical performance [1]. Compared to the other vanadium oxides, V6O13 was one of the most promising candidate lithium-ion
conductivity [2-3]. V6O13 was composed of alternating single and double vanadium oxide layers. V4+
occupied the single and double layer sites of the V atoms and V5+ only occupied the double layer sites of V atoms [4]. Crystal structure of V6O13 composed of VO6 octahedra, corner sharing single and
double layers parallel to [010] plane [5]. The single and double layers alternate in the V6O13 structure
could provide much more sites for lithium intercalation [6, 7]. Theoretically, V6O13 could
electrochemically accommodate eight Li+ per formula unit, which could provide more Li+ during the process of lithium insertion and extraction [8]. Therefore, V6O13 showed a high theoretical specific
capacity and energy of 417 mAh/g and 900 Wh/kg, which were much higher than those of conventional LiMn2O4 (148 mAh/g) [9, 10], LiCoO2 (274 mAh/g) [11] and LiFePO4 (170 mAh/g) [12].
In addition, V6O13 had a high-rate charge and discharge due to its metallic character at room
temperature.
The resistance of V6O13 was closely related to its crystal lattice structures, which could
significantly change in the lithium insertion and extraction process. After lithium inserting into V6O13
structure, the formed LixV6O13 would lead to the volume expansion and unstable structure [6, 7, 13].
So, the electronic conductivity of V6O13 fell so quickly after lithium ion intercalation that the less
utilization coefficient in high content lithium. Moreover, the largevolume expansion/contraction and poor stability of crystal structures during lithium ion intercalation and deinteracalation process may both interrupt the electronic and ionic contact pathways in the electrodes, leading to a rapid capacity fading [14]. Therefore, the way to improve the electrochemical performance of V6O13 was not only
reducing the internal resistance on the interface of electrolyte/V6O13, but also boosting the stability of
crystal structure in the process of charge and discharge. S. N. Hua and M. Y. Saidi showed that V6O13
coated with carbon was beneficial to obtain a high initial capacity (370 mAh/g), while the circulation property of battery was not obviously improve [15, 16]. The previous work had indicated that doping transition element could significantly enhance the electrochemical performance of V6O13.
The synthesized Cr0.36V6O13.5 revealed good electrochemical performance with 370 mAh/g initial
discharge capacity and capacity loss less than 15% after 35 cycles [17, 18]. MnxV6−xO13 (x=0.01, 0.02,
0.03, 0.04) was synthesized via a hydrothermal method by Jinyun He, and they found that the sample doping with 2% Mn exhibited the best electrochemical performance (initial discharge capacity was 350.1 mAh/g and the capacity was restored to 282.7 mAh/g after 50 cycles) [19]. In our previous work, V6O13 nanosheets were synthesized via hydrothermal method with V2O5 and ethanol as reactant.
However, the electrochemical performance cannot yet satisfactory, the initial discharge capacity was 330 mAh/g and the capacity retentions was 87% after 20 cycles [20].
On the one hand, aluminum was widely applied in semiconductor industry due to its low-cost, good conductive and environmental element in the earth crust. On the other hand, the radius of Al3+ (0.535 Å) was closed to that of V4+ (0.58 Å) and V5+ (0.54 Å). On the base of this, in our opinion, Al3+ was an appropriate dopant applied in V6O13 cathode material for lithium-ion battery.
Herein, flower-like structure Al-doped V6O13 were successfully synthesized via a hydrothermal
possible influence mechanism of Al3+ doping on the electrochemical performance was also discussed analyzed.
2. EXPERIMENTAL
All chemical reagents were analytical grade and used without any further purification. 1.25g oxalic acid dihydrate (C2H2O4•2H2O) and 0.4g vanadium pentoxide (V2O5) were dissolved in 20 mL of
deionized water with stirring at 80 °C until a blue colored solution formed. The possible
reaction was followed.
V2O5 + 3H2C2O4 → 2[(VO)(C2O4)](blue) + CO2 + 3H2O
After cooled down to room temperature naturally, the mixture solution was filtered. A certain (Table 1) amount of aluminum nitrate nonahydrate (Al(NO3)3•9H2O) was dissolved in 15mL of
deionized water and formed a transparent solution. Then this solution was added into as-obtained vanadyl oxalate(VOC2O4•5H2O) solution. And then 3 mL hydrogen peroxide 30%(H2O2) was added
to above-mentioned mixed solution followed obtained a red transparent solution. The red mixed solution was transferred into a 100 mL stainless steel autoclave with continuous stirring until the bubbles disappeared. The autoclave was sealed and maintained at 160 °C for 24h. When the autoclave cooled down to room temperature naturally, the supernatant liquid was removed, the raw products were collected by centrifugation washed with deionized water, and dried in the freeze drier for 24 h. Finally, the obtained raw precursor was sintered at 350 °C for 1 h in argon in order to prepare Al-doped V6O13.
Table 1. Sample designations with doping different amount of Aluminum nitrate nonahydrate (Al(NO3)3•9H2O).
Sample designation Al(NO3)3·9H2O/g
A0 0.00
A1 0.02
A2 0.04
A3 0.06
A4 0.08
2.1. Characterization
3. RESULTS AND DISCUSSION
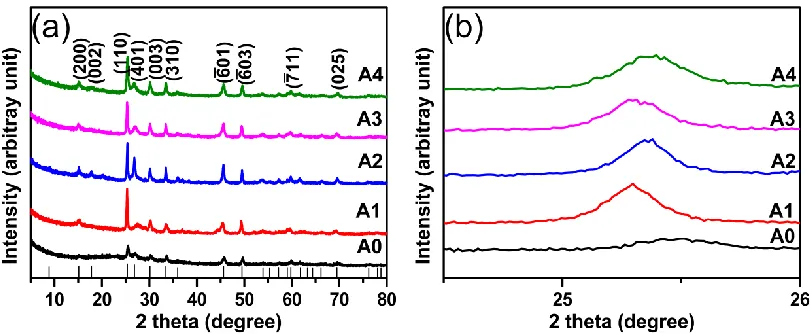
Fig.1(a) illustrated the typical XRD patterns of Al-doped V6O13.For pure phase V6O13, there
were main characteristic peaks at 2θ = 15.122, 17.803, 25.349, 26.842, 30.131, 33.487, 45.619, 49.496, 59.795 and 69.500, corresponding to (200), (002), (110), (003), (-401), (310), (-601), (-603), (-711) and (025) planes (JCPDS card No. 71-2235), respectively [21]. No other impurities were found. The diffraction peaks of Al-doped V6O13 were also in good agreement with the standard diffraction peaks
of pure phase V6O13. Form the high angle diffraction pattern, the pattern peaks shifted to high angle
after doping with Al3+ (figure 1(b)). It was because the ionic radium of Al3+ (0.535 Å) was smaller than that of V4+ (0.58 Å) and V5+ (0.54 Å). The shift of the diffraction peaks indicated that Al3+ had incorporated into the lattice of V6O13.
Figure 1. (a) The XRD patterns of A0, A1, A2, A3 and A4; (b) enlarged peaks at 2θ degree ranging
from 24o to 26o.
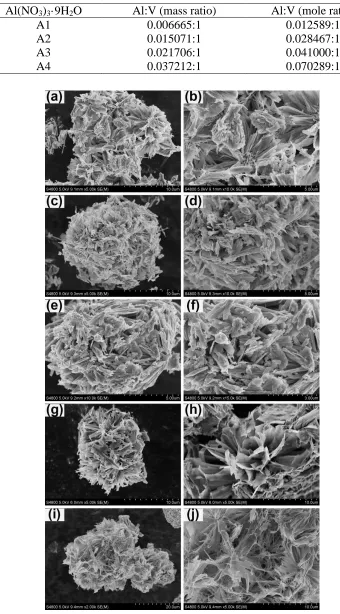
Figure 2 showed the SEM images of Al-doped V6O13 samples. The Al-doped V6O13 revealed
flower-like morphology which was assembled from lots of nanosheets (the thickness of less than 20 nm). The Al-doped V6O13 samples of A0, A1 and A2 were slight agglomerated and adhered together
by stacking region in an irregular arrangement with every unit, but A3 and A4 were adhered together by stacking region in a regular arrangement. Compared to the samples with low Al doping content (A1 and A2), the samples with high Al content (A3 and A4) had larger special surface area. These morphologies were beneficial to lithium transport in the charge and discharge process, leading to better electrochemical performance [22]. Besides, when the mole ratio of Al/V was 0.041, the sample (A3) presented larger clearance between layers. It could allow sufficient penetration of the electrolyte and effectively improve electrochemical performance of the lithium battery.
[image:4.596.97.502.272.439.2]
Table 2. The mass ratio and mole ratio of aluminum to vanadium in different quantities Al-doped V6O13.
Al(NO3)3·9H2O Al:V (mass ratio) Al:V (mole ratio)
A1 0.006665:1 0.012589:1
A2 0.015071:1 0.028467:1
A3 0.021706:1 0.041000:1
A4 0.037212:1 0.070289:1
[image:5.596.116.456.109.723.2]
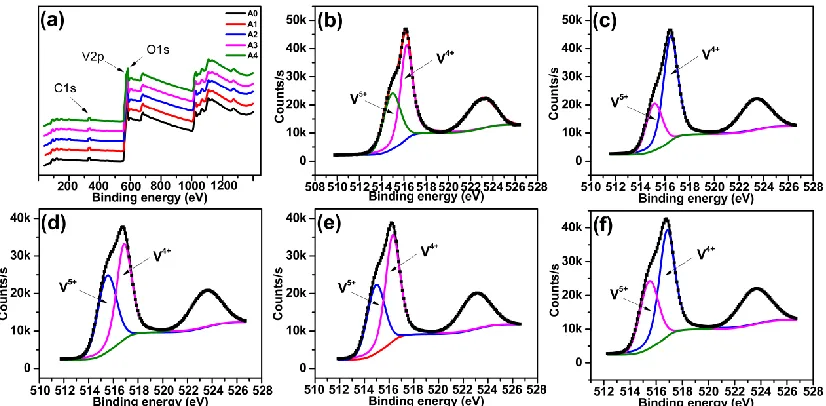
Fig. 3 (a) showed typical XPS spectra and their Gaussian-resolved components of O 1s, V 2p, N 1s and C 1s of Al-doped V6O13. Qualitative analysis of XPS spectra (Fig. 3a) demonstrated the
presence of O, V, N and C. However, due to relatively low contents in the Al-doped V6O13, the
corresponding peaks of Al was not obvious. The C elements may come from the reaction between VOC2O4 and H2O2. The peak positions of +4 and +5 valences state of V 2p3/2 core levels were slightly
changed after Al doping (Fig. 3(b)-(f)). The peaks position of V5+ and V4+ were 515.10 and 516.28 eV (A0), 515.14 and 516.46 eV (A1), 515.50 and 516.86 eV (A2), 514.94 and 516.29 eV (A3), 515.47 and 516.29 eV (A4), respectively [22, 23]. The increment of binding energy suggested that Al could lead to a strong interaction between the vanadium and oxygen [24]. The ratio of V5+ and V4+ were 48.97% and 51.03% (A0), 29.47% and 70.53% (A1), 45.06% and 54.94% (A2), 39.20% and 60.80% (A3), 38.29% and 61.71% (A4), respectively. It was found that the V+4 hold the majority proportion and the ratio between V5+ and V4+ was close to that of the V6O13 (1:2). However, after Al doped, the proportion of
V+4 raised. It might be because the ionic radium of Al3+ (0.535 Å) was more close to V5+ (0.54 Å) than V4+ (0.58 Å), finally result in Al3+ replacing the site of V5+.
Fig. 4 showed narrow-scan spectra in the Al 2p region and the resolved components for the Al-doped V6O13 deposited at A1, A2, A3 and A4, respectively. The peak at 73.0 eV indicated that the
oxidation state of Al was +3 [25-27].
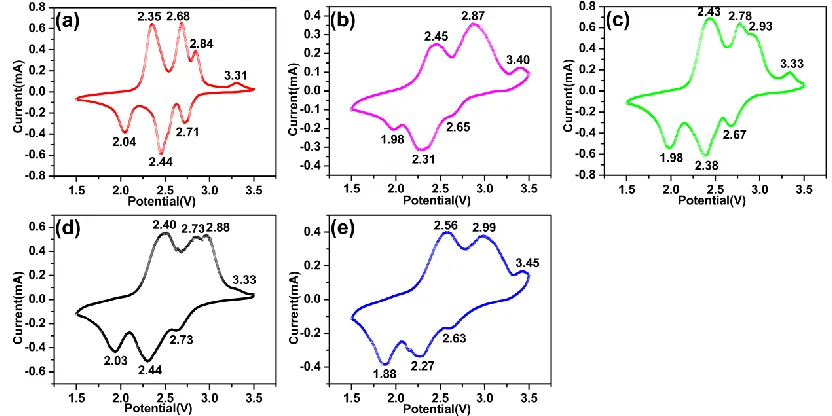
The cyclic voltammetry curves of after three cycles for the Al-doped V6O13 were characterized
at a scan rate of 0.1 mV•s−1 and a voltage scope of 1.5-3.5 V (Fig. 5). Four oxidation peaks occurred at around 2.35, 2.68, 2.84 and 3.31 V (versus Li+/Li) in A0, indicating Li ions intercalate into the non-equivalent sites in V6O13. Similarly, the reduction peaks located at around 2.04, 2.44, and 2.71 V
(versus Li+/Li) were corresponded to the deintercalation of Li from the monoclinic V6O13 [6, 8, 28, 29].
[image:6.596.92.505.472.675.2][image:7.596.91.499.71.377.2]
Figure 4. Narrow-scan spectra in the Al 2p region and the resolved components of A1(a), A2(b), A3(c), A4(d).
Figure 5. The cyclic voltammetry curves of the third cycle for A0(a), A1(b), A2(c), A3(d) and A4(e).
[image:7.596.87.503.434.642.2]
2.63 V (A4), respectively. It was found that with the increasing of doping content of Al, the oxidation peak first shift to lower voltage and then shift to higher (A3 was the smallest). Instead, the reduction peak first shift to higher voltage then shift to lower (A3 was the largest). The cyclic voltammetry curves of A3 were shown the largest polarization.
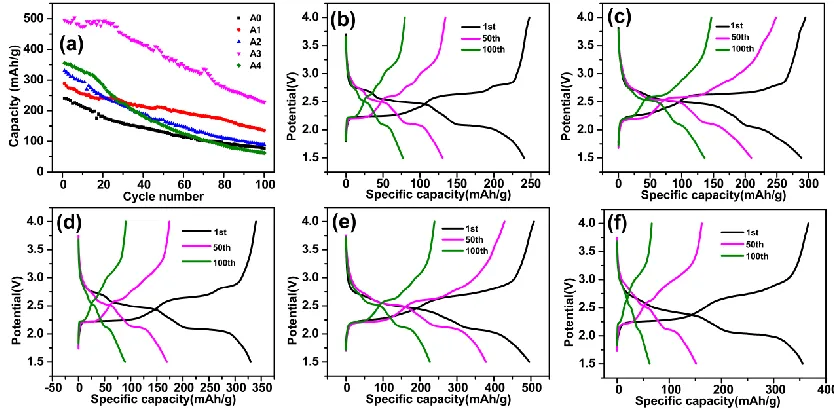
The cycling performance of Al-doped V6O13 was further investigated in Figure 6(a). The
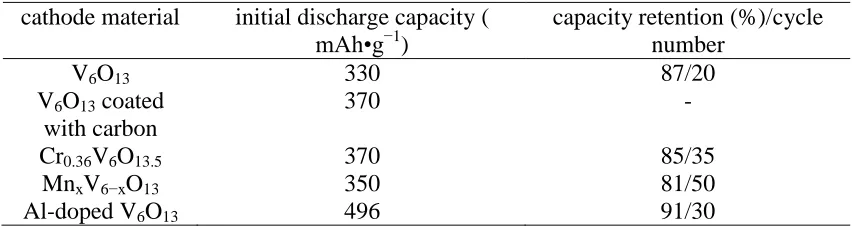
reversible discharge capacity can be obtained at a rate of 42 mA•g−1 in 1.5-4.0 V. The initial discharge capacity of Al-doped V6O13 were 241 mAh•g−1 (A0), 289 mAh•g−1 (A1), 330 mAh•g−1 (A2), 496
mAh•g−1 (A3) and 355mAh•g−1(A4), respectively. The capacity could be enhanced after doping Al into V6O13 crystal lattice, it was because that good electrical conductivity Al element doping into
V6O13 samples [26]. With the Al doping content increasing, the initial discharge capacity of the
Al-doped V6O13 increased at first and then descended. When the mole ratio of Al/V was 0.041, the initial
discharge capacity was the highest. The discharge capacity of A3 was also high than 450 mAh•g-1 after 30 cycles. The capacity retentions of Al-doped V6O13 were 32.0% (A0), 47.1% (A1), 27.0% (A2),
45.8% (A3) and 17.5% (A4) after 100 cycles, respectively. It was noted that the the capacity declined sharply when the mole ratio of Al/V was 0.070 (A4). It was because high content of Al could destroy V6O13 crystal structure followed caused low capacity retention [21, 30]. The result showed that the
electrochemical performance of Al-doped V6O13 wasmuch better than the other cathode materials
[image:8.596.85.511.431.544.2][15-20], as showed in Table 3.
Table 3. The electrochemical performance of Al-doped V6O13 and the other cathode materials.
cathode material initial discharge capacity ( mAh•g−1)
capacity retention (%)/cycle number
V6O13 330 87/20
V6O13 coated
with carbon
370 -
Cr0.36V6O13.5 370 85/35
MnxV6−xO13 350 81/50
Al-doped V6O13 496 91/30
Figure 6. (a) Cycling performance of A0, A1, A2, A3 and A4 electrodes at 0.1 C; The first, fiftieth and hundredth charge-discharge curves of A0(b), A1(c), A2(d), A3(e) and A4(f)at current densities of 42 mA•g−1 in the voltage range of 1.5-4.0 V.
4. CONCLUSION
Al-doped V6O13 were synthesized via a facile hydrothermal method. The Al-doped V6O13
revealed flower-like morphology which was adhered together by stacking region with every unit. A0, A1 and A2 were slight agglomerated and adhered together by stacking region in an irregular arrangement, but A3 and A4 were adhered together by stacking region in a regular arrangement. The electrochemical tests showed that the discharge specific capacity and cycle performance of the samples could be significantly improved after doping Al3+. When the mole ratio of Al/V was 0.041, the sample exhibited the best electrochemical performance. The initial discharge specific capacity was 496 mAh•g−1 and the capacity retention was 45.8% after cycling for 100 times. The enhanced electrochemical performance originated from larger clearance between layers that allow sufficient penetration of the electrolyte. These morphologies were beneficial to lithium transport in the charge and discharge process. Meanwhile, the increased specific capacity was attributed to the enhancement of the electrical conductivity after Al3+ doping.
ACKNOWLEDGEMENT
This work was supported by the National Nature Science Foundation of China (Project No. 51562006) and Improving the Basic Ability of Young and Middle-aged University Teachers in Guangxi (No. KY2016YB187).
References
1. J. Haber, M. Witko and R. Tokarz, Appl Catal A-Gen, 157 (1997) 3.
[image:9.596.87.504.71.276.2]
3. Y. Y. Xia, T. Fujieda, K. Tatsumi, P. P. Prosini and T. Saka, J Power Sources, 92 (2001) 234. 4. D. W. Murphy, P. A. Christian, F. J. Disalo and J. Lithium, Inorg Chem, 18 (1979) 2800. 5. D. Murphy, P. Christian, F. DiSalvo, J. Carides and J. Waszczak, J Electrochem Soc, 128 (1982)
2053.
6. H. BjÖrk, S. Lidin, T. Gustafsson and J. O. Thomas, Acta Crystallogr B, 57 (2001) 759. 7. J. HÖwing, T. Gustafsson and J. O. Thomas, Acta Crystallogr B, 59 (2003) 747.
8. K. West, B. Zachau-Christiansen, T. Jacobsen and S. Atlung, J Power Sources, 14 (1985) 235. 9. L. W. Liu, W. Tian and X. Q. Zhao, Chinese Battery Industry, 8 (2003) 147.
10. X. Shi, W. H. Pu and Y. L.Wu, Chemical Industry and Engineering Progress, 30 (2011) 1264. 11. D. Huang, Advanced Battery Technology, 11 (1998) 23.
12. X. Dai, H. H. Tang and P. Yang, Materials Review, 19 (2006) 69.
13. J. Barker, E. S. Saidi and M. Y. Saudi, Electrochim Acta, 40 (1995) 949. 14. J. Barker, R. Koksbang, Electrochim Acta, 40 (1995) 673.
15. S. N. Hua, S. Phang, J Power Sources, 10 (1983) 279. 16. M. Y. Saidi, J. Barker, Solid State Ionics, 78 (1995) 169.
17. P. Soudan, J. P. Pereira-Ramos, J. Farcy, G. Gregoire and N. Baffier, Solid State Ionics, 135 (2000) 291.
18. C. Leger, S. Bach, J. P. Pereira-Ramos, J Solid State Electr, 11 (2007) 71. 19. J. Y. He, F. Long, Z. G. Zou, Ionics, 21 (2015) 995.
20. Z. G. Zou, H. Chen, J. Y. He, F. Long, Y. Wu, Z. Y. Yan, H. X. Chen. Electrochimica Acta, 135 (2014) 175.
21. S. Y. Zhan, C. Z. Wang, K. Nikolowski, H. Ehrenberg, G Chen, Y. J. Wei, Solid State Ionics, 180 (2009) 1198.
22. C. Nethravathi, C. R. Rajamathi, M. Rajamathi, U. K. Gautam, X. Wang, D. Golberg, Y. Bando, ACS Applied Materials & Interfaces, 5 (2013) 2708.
23. Q. Shi, W. Huang, Y. Zhang, J. Yan, Y. Zhang, M. Mao, Y. Zhang and M. Tu, ACS Applied Materials & Interfaces, 3 (2011) 3523.
24. X. F. Wu, Z. M. Wu, C. H. Ji and H. F. Zhang, Applied Materials & Interfaces, 8 (2016) 11842. 25. M. Chen, X. Wang, Y. H. Yu, Z. L. Pei, X. D. Bai and C. Sun, Appl Surf Sci, 158 (2000) 134. 26. J. P. Kar, S. Kim, B. Shin, K. I. Park, K. J. Ahn, W. Lee, J. H. Cho and J. M. Myoung, Solid State
Electron, 54 (2010) 1447.
27. K. Uma, M. Rusop, T. Soga and T. Jimbo, J Appl Phys, 46 (2007) 40.
28. M. Simoes, Y. Surace, S. Yoon, C. Battaglia, S. Pokrant and A. Weidenkaff, J Power Sources, 291 (2015) 66.
29. O. Bergstroem, T. Gustafsson and J. O. Thomas, Solid State Ionics, 110 (1998) 179. 30. J. Howing, T. Gustafsson and J. O. Thomas, Acta Crystallogr B, 1 (2004) 382. 31. M. S. Whittingham, Chem Rev, 1 (2004) 4271.