Yefim Kats
Chestnut Hill College, USA
Systems and Instructional
Design:
Joel Gamon Kayla Wolfe Lisandro Gonzalez Jason Mull
Learning management systems and instructional design : best practices in online education / Yefim Kats, editor. pages cm
Includes bibliographical references and index.
Summary: “This book provides an overview on the connection between learning management systems and the variety of instructional design models and methods of course delivery, offering a useful source for administrators, faculty, instructional designers, course developers, and businesses interested in the technological solutions and methods of online education”--Provided by publisher.
ISBN 978-1-4666-3930-0 (hardcover) -- ISBN 978-1-4666-3931-7 (ebook) -- ISBN 978-1-4666-3932-4 (print & perpetual access) 1. Internet in higher education--Case studies. 2. Education, Higher--Computer-assisted instruction--Case studies. 3. Web-based instruction--Design. I. Kats, Yefim.
LB2395.7.L44 2013 378.1’7344678--dc23
2012050502
British Cataloguing in Publication Data
A Cataloguing in Publication record for this book is available from the British Library.
All work contributed to this book is new, previously-unpublished material. The views expressed in this book are those of the authors, but not necessarily of the publisher.
Development Editor: Assistant Acquisitions Editor: Typesetter:
Cover Design:
Published in the United States of America by
Information Science Reference (an imprint of IGI Global) 701 E. Chocolate Avenue
Hershey PA 17033 Tel: 717-533-8845 Fax: 717-533-8661 E-mail: [email protected] Web site: http://www.igi-global.com
Copyright © 2013 by IGI Global. All rights reserved. No part of this publication may be reproduced, stored or distributed in any form or by any means, electronic or mechanical, including photocopying, without written permission from the publisher. Product or company names used in this set are for identification purposes only. Inclusion of the names of the products or companies does not indicate a claim of ownership by IGI Global of the trademark or registered trademark.
Chapter 6
DOI: 10.4018/978-1-4666-3930-0.ch006
INTRODUCTION
The education sector is significantly impacted by developments in information technology. New technologies have been widely adopted in this sector to enhance the quality and quantity of
educational services. E-learning systems have be-come the most used application in universities and educational institutions. In the USA, 90 percent of 2-year and 89 percent of 4-year public education institutions offered distance education courses in 2000-2001 with enrolments of 1,472,000 and 945,000 respectively out of total enrolment of 3,077,000 (Holsapple & Lee-Post, 2006). It is
Ahmed Younis Alsabawy
University of Southern Queensland, Australia & University of Mosul, Iraq
Aileen Cater-Steel
University of Southern Queensland, Australia
Jeffrey Soar
University of Southern Queensland, Australia
E-Learning Service
Delivery Quality:
A Determinant of User Satisfaction
ABSTRACT
worth mentioning that transnational courses are delivered by most Australian universities through educational software (Shurville et al., 2008). Most of the United Kingdom universities are support-ing educational services and students via Virtual Learning Environment (VLE) (Ogba et al., 2012). The use of these systems is not limited to universi-ties but extends to include schools, government departments and private enterprises.
Educational services are the main product of educational institutions. Customers expect to receive high quality service. Service quality is commonly used as an indicator assessing course design, service delivery, and the success of e-learning systems. User satisfaction is considered one of the most important objectives for organisa-tions. Due to the importance of user satisfaction, this indicator is used to evaluate the organisational performance together with other indicators.
The effect of service quality on user satisfaction has been studied before. However, these studies ignored the effects of the sub-dimensions of the service quality construct on user satisfaction.
Research Problem
For students, the main expected benefits of e-learn-ing systems are enhance-learn-ing academic performance, educational satisfaction, social value, and career development. E-learning systems are dependent upon digital media and telecommunications, and any shortcomings may lead to user dissatisfaction. The issue of user dissatisfaction is related to other issues in service delivery quality. In this respect, Zeithaml states that “Too many companies are performing poorly in delivering service on the web, and a large part of this problem is the lack of complete understanding of what customers want in this medium” (2002, p. 135). Delivery problems are considered to be the main reason behind the failure of online services (Kuo et al., 2011). Based on these issues the research problem has been formulated:
Does service delivery quality of e-learning systems impact user satisfaction? If so, which sub-dimen-sions of this construct affect user satisfaction?
Research Objectives
The main objective of this research is to identify the role of SDQ in enhancing user satisfaction, and the impact of each sub-dimension of SDQ on user satisfaction. The two indicators, SDQ and user satisfaction, are tested in the context of measurement models to investigate the ability of those two constructs to evaluate and measure the success of e-learning systems. The validity and reliability of the “E-S-QUAL and Re-E-S-QUAL” measure which was proposed by Zeithaml et al. (2002), and user satisfaction are examined in this study. Two models were examined to investigate the role of SDQ in user satisfaction at two levels: the effect of SDQ on user satisfaction and the effect of each sub-dimension of SDQ on user satisfaction. Students’ comments about the factors affecting the success of e-learning system were analysed using content analysis. Analyzing these comments enables identification and classification of the main issues faced by external students regarding e-learning systems. Based on the results of this research, recommendations and suggestions are offered with the aim of helping to enhance the performance of e-learning systems, and solutions are proposed to support service delivery quality and user satisfaction.
Literature review
linked to University of Southern Queensland (USQ) for instance EBSCO, Sciences Direct, Emerald Management eJournals, and SAGE Management and Organization Studies. The key words used in the search were service delivery quality, service quality, information systems service quality, and user satisfaction.
Service Delivery Quality
Service quality has received substantial attention not just in the marketing field, but also in the information systems literature. In the last four decades, enormous efforts have been exerted to find comprehensive measurements to assess information system’s service quality.
Rockart (1982) is believed to be one of the earli-est researchers who examined the role of service quality in information system success. According to Rockart (1982), service quality is deemed to be the most important Critical Success Factor (CSF) to information system executives. This construct is critical for organization customers because this term is related to three kinds of customers: “external customers who have experienced the firm’s services; competitors’ customers whom the firm would like to make its own, and internal customers (employees) who depend on internal services to provide their own services” (Berry & Parasuraman, 1997, p. 65).
Service quality of information systems was largely absent in information systems literature until the mid-1990s. Pitt et al. pointed to this and stated “service rarely appears in the vocabulary of the traditional system development life cycle” (1995, p. 173). Since 1995, a new trend in infor-mation systems has emerged. Pitt et al. (1995) observed this trend and noted that IS quality should be used as a criterion in evaluating infor-mation system effectiveness. This contribution is the earliest empirical study that adopted service quality as a measurement to assess information systems success.
four dimensions, which can be used to measure desired, adequate, and perceived service quality levels. The four dimensions were tangibles, rap-port, reliability and responsiveness.
At the start of the 21st century the focus moved more towards online service quality. This was associated with the growth in electronic retailing (Ding et al., 2011). E-service quality was seen as a critical determinate of the success or failure of electronic commerce (Santos, 2003). The benefits of e-service quality extend to include strategic benefits, operational efficiency and profitability (Berry & Parasuraman, 1997). According to Santos (2003) in 2001, the world lost £8 billion due to inadequate e-services. The first initiative to address this issue in electronic applications was taken by Zeithaml et al. (2000). The key contribution of this study is a scale called E-SERVQUAL. Eleven dimensions were identified as criteria to evaluate features of web sites: reliability, responsiveness, access, flexibility, ease of navigation, efficiency, assurance/trust, security/privacy, price knowl-edge, site aesthetics and customization/personal-ization. In 2002, Zeithaml et al. (2002) proposed a new scale to measure quality in e-tailing. This measurement has two parts. The first part, called E-S-QUAL, is used to measure the core services and includes four dimensions: efficiency, reli-ability, fulfillment and privacy. The second part of the scale is called Re-E-S-QUAL. This part is related to recovery services and consists of three dimensions: responsiveness, compensation and contact. In 2005, the authors performed an extra examination of the structure and properties of the scale. This empirical examination of E-S-QUAL and Re-E-S-QUAL aimed to reconfirm the reli-ability and validity of the scale. The main finding of this study is that “both scales (core service and recovery scale service) demonstrate good psycho-metric properties based on findings from a variety of reliability and validity tests” (Parasuraman et al., 2005, p. 1). There are some measurements which have been prepared to evaluate e-service quality.
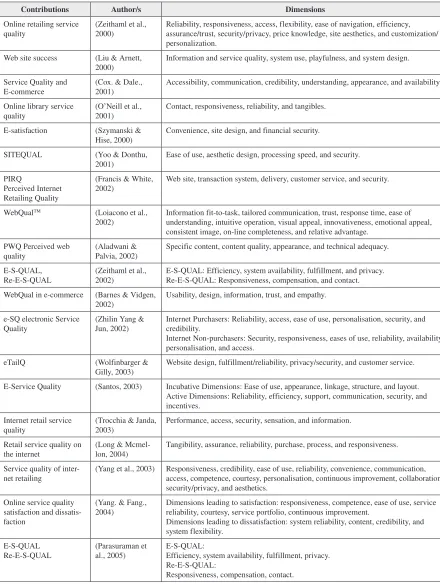
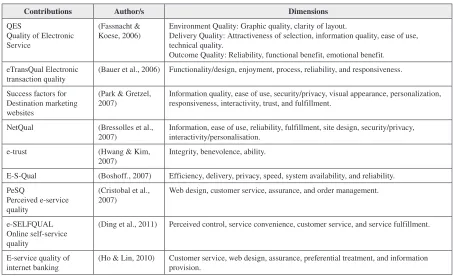
These scales have various titles, for example, WebQual, SITE-QUAL, eTailQ, PIRQUAL, and e-SELFQUAL. Table 1 lists those studies and some details about each study.
All the studies mentioned in Table 1 focused on the critical issue of service delivery quality. Delivering services through electronic media is an essential challenge encountered by organiza-tions. The issue is related to poor performance of organisations to identify the customer needs and desires and to understand what they want (Zeithaml et al., 2002). Establishing key performance indi-cators for service delivery, and establishing stan-dards of quality and service delivery are believed to be the main pillars in Information Systems service delivery organizations (McManus, 2009).
Service delivery quality in e-learning systems can be vital in assisting educational institutions obtain the potential competitive advantage that e-learning offers (Roffe, 2002; Udo et al., 2011). Learner services and support are stated to be an essential standard to design, deliver and develop e-learning programs (Frydenberg, 2002). Therefore, service delivery quality has received noteworthy attention in the context of e-learning systems. Most of the research which dealt with e-learning system success issues has considered service quality as a critical element in creating success. Different indicators were used to gauge the service delivery quality in the e-learning systems area as follow:
• Holsapple and Lee-Post (2006) considered service quality, alongside system quality and information quality, as a critical factor in designing e-learning systems success-fully. Five indicators were used to mea-sure service quality: promptness, respon-siveness, fairness, knowledge ability and availability.
Table 1. Selected studies related to online service quality
Contributions Author/s Dimensions
Online retailing service
quality (Zeithaml et al., 2000) Reliability, responsiveness, access, flexibility, ease of navigation, efficiency, assurance/trust, security/privacy, price knowledge, site aesthetics, and customization/ personalization.
Web site success (Liu & Arnett,
2000) Information and service quality, system use, playfulness, and system design. Service Quality and
E-commerce (Cox. & Dale., 2001) Accessibility, communication, credibility, understanding, appearance, and availability. Online library service
quality (O’Neill et al., 2001) Contact, responsiveness, reliability, and tangibles. E-satisfaction (Szymanski &
Hise, 2000) Convenience, site design, and financial security. SITEQUAL (Yoo & Donthu,
2001) Ease of use, aesthetic design, processing speed, and security. PIRQ
Perceived Internet Retailing Quality
(Francis & White,
2002) Web site, transaction system, delivery, customer service, and security.
WebQualTM (Loiacono et al.,
2002) Information fit-to-task, tailored communication, trust, response time, ease of understanding, intuitive operation, visual appeal, innovativeness, emotional appeal, consistent image, on-line completeness, and relative advantage.
PWQ Perceived web
quality (Aladwani & Palvia, 2002) Specific content, content quality, appearance, and technical adequacy. E-S-QUAL,
Re-E-S-QUAL (Zeithaml et al., 2002) E-S-QUAL: Efficiency, system availability, fulfillment, and privacy. Re-E-S-QUAL: Responsiveness, compensation, and contact. WebQual in e-commerce (Barnes & Vidgen,
2002) Usability, design, information, trust, and empathy. e-SQ electronic Service
Quality (Zhilin Yang & Jun, 2002) Internet Purchasers: Reliability, access, ease of use, personalisation, security, and credibility. Internet Non-purchasers: Security, responsiveness, eases of use, reliability, availability, personalisation, and access.
eTailQ (Wolfinbarger &
Gilly, 2003) Website design, fulfillment/reliability, privacy/security, and customer service. E-Service Quality (Santos, 2003) Incubative Dimensions: Ease of use, appearance, linkage, structure, and layout.
Active Dimensions: Reliability, efficiency, support, communication, security, and incentives.
Internet retail service
quality (Trocchia & Janda, 2003) Performance, access, security, sensation, and information. Retail service quality on
the internet (Long & Mcmel-lon, 2004) Tangibility, assurance, reliability, purchase, process, and responsiveness. Service quality of
inter-net retailing (Yang et al., 2003) Responsiveness, credibility, ease of use, reliability, convenience, communication, access, competence, courtesy, personalisation, continuous improvement, collaboration, security/privacy, and aesthetics.
Online service quality satisfaction and dissatis-faction
(Yang. & Fang.,
2004) Dimensions leading to satisfaction: responsiveness, competence, ease of use, service reliability, courtesy, service portfolio, continuous improvement. Dimensions leading to dissatisfaction: system reliability, content, credibility, and system flexibility.
E-S-QUAL
Re-E-S-QUAL (Parasuraman et al., 2005) E-S-QUAL: Efficiency, system availability, fulfillment, privacy. Re-E-S-QUAL:
on the studies of Kettinger and Lee (1994), Pitt et al. (1995), Parasuraman et al. (1985, 1988). However, the aspects used to mea-sure service were not identified.
• Lin (2007) adopted DeLone and McLean’s model (2003) to assess online learning system success. The indicators employed to measure service quality in this research were visual appeal, availability of help and responsive of the online learning system. • Wang et al. (2007) adopted service quality,
besides five other constructs, to gauge the success of an e-learning system in an orga-nizational context. The items used to mea-sure the service quality construct focused on online assistance and explanation, de-veloper interaction with users, staff avail-ability, consideration of user suggestions, and satisfactory support.
• Ozkan and Koseler (2009) proposed a mod-el to evaluate e-learning system success in
the higher education context, namely the Hexagonal E-learning Assessment Model (HELAM). Service quality was chosen as a key construct in this model. Four subscales were employed to measure this construct: student tracking, course/instruction autho-rization, course management and knowl-edge ability.
• Wang and Wang (2009) combined TAM with three dimensions of quality to inves-tigate adoption of e-learning systems by instructors: system quality, information quality, and service quality. Five indica-tors were used to evaluate service quality: training, professional knowledge of staff, contact, responsiveness, and support. • Adeyinka and Mutula (2010) suggested
a model to evaluate WebCT course con-tent management system success. Service quality has been specified as an important construct. The focus of service quality
con-Contributions Author/s Dimensions
QES
Quality of Electronic Service
(Fassnacht &
Koese, 2006) Environment Quality: Graphic quality, clarity of layout. Delivery Quality: Attractiveness of selection, information quality, ease of use, technical quality.
Outcome Quality: Reliability, functional benefit, emotional benefit. eTransQual Electronic
transaction quality (Bauer et al., 2006) Functionality/design, enjoyment, process, reliability, and responsiveness. Success factors for
Destination marketing websites
(Park & Gretzel,
2007) Information quality, ease of use, security/privacy, visual appearance, personalization, responsiveness, interactivity, trust, and fulfillment.
NetQual (Bressolles et al.,
2007) Information, ease of use, reliability, fulfillment, site design, security/privacy, interactivity/personalisation. e-trust (Hwang & Kim,
2007) Integrity, benevolence, ability.
E-S-Qual (Boshoff., 2007) Efficiency, delivery, privacy, speed, system availability, and reliability. PeSQ
Perceived e-service quality
(Cristobal et al.,
2007) Web design, customer service, assurance, and order management.
e-SELFQUAL Online self-service quality
(Ding et al., 2011) Perceived control, service convenience, customer service, and service fulfillment.
E-service quality of
[image:8.612.70.523.124.401.2]internet banking (Ho & Lin, 2010) Customer service, web design, assurance, preferential treatment, and information provision.
cerned evaluating the support delivered by the course content management team to students. Teaching and learning quality and the quality of tutors’ interaction with students were the main concerns of this variable.
• Hassanzadeh et al. (2012) employed five indicators to measure service quality: pro-vide guidance services; responsiveness; reflecting user views in system design and development; course management; and speed of provide service.
• Cheng (2012) focused on the support ser-vice from the help desk and the support service from the administrators of e-learn-ing systems to assess the support service quality.
Service quality delivery is considered to be a central challenge encountered by organizations. Shortfalls in this construct will lead to undesired results with respect to organizational activities, performance and customer satisfaction. The im-portance of this issue has increased after growth in use of e-commerce and electronic systems. Many studies have been conducted to address this issue and to explore factors affecting service delivery quality. In the context of an e-learning system, these factors are deemed to be critical to the success of these systems. However, most of the efforts which dealt with these issues fo-cused on specific stakeholders such as students (external stakeholders) and ignored other groups of stakeholders. Instructors (academic staff) and Information and Communication Technology (ICT) staff are believed to be vital stakeholders because those two groups have constant contact with this system. In addition, those two groups of stakeholders depend on e-learning system service to deliver their own service to external customers (students or trainers). Therefore, the opinions of different groups of stakeholders (both external and internal users) should be considered
in evaluating service delivery quality to compose a comprehensive picture of these services. Finally, most of the studies reviewed above dealt with impacts of service quality and did not consider the sub-dimensions of this construct.
User Satisfaction
Considerable attention has been paid to user sat-isfaction in the information systems field since 1970. Technology, the user and the organization are believed to be the main elements in evaluat-ing information system success (Oriyo, 2010). The most important use of user satisfaction is in evaluating the success of information systems. Many studies adopted user satisfaction as a single construct to assess information system success, for example Bailey and Pearson (1983); Ilias et al. (2009); Gudigantala et al. (2010); and Pike et al. (2010).
User satisfaction also has been used as a fun-damental construct in measuring the acceptance of technology. One example can be found in the study by Wixom and Todd (2005). Their results highlighted that the perspectives of user satisfac-tion and technology acceptance can be integrated. Furthermore, user satisfaction is believed to be valuable to management as a measure of informa-tion system success. Herald states that “a structured and meaningful methodology for determining user satisfaction that results in a management plan of action should be regularly applied by the IS organization with its users” (1996, p. 5).
high degree of face validity, the availability of a reliable measurement, and the poor quality of the other measures.
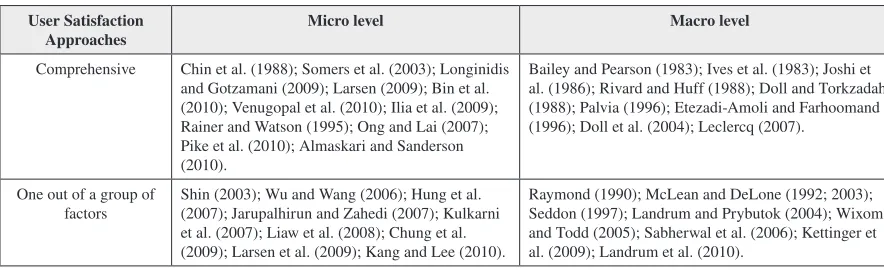
The micro and macro level approach is be-lieved to be commonly used to review studies dealing with user satisfaction. Olson and Ives initially developed this approach and stated that “The micro level focuses on satisfaction with a particular information system. … A macro level measure of information satisfaction assesses user managers’ overall satisfaction with all computer-based information use in their jobs” (1981, p. 186). In the context of micro studies, Chin et al. (1988) offered an instrument to measure user satisfaction called Questionnaire for User Inter-face Satisfaction (QUIS). They did a comparison of two pairs of software categories. The first pair was named ‘like vs. dislike’ and the second was standard Command Line System and a Menu Driven Application. Four factors emerged from the analysis: learning, terminology and information flow, system output, and system characteristics. Also, the reliability of the questionnaire was rated highly.
Somers et al. (2003) researched end–user computing satisfaction with ERP systems. The instrument of Doll and Torkzadeh (1988) was adopted in the study to confirm the structure, dimensionality, reliability and validity of the instrument. The findings concluded that the psy-chometric stability of the instrument has been proven in the context of an ERP system.
Longinidis and Gotzamani (2009) examined the factors affecting ERP system success. As a result, three factors were identified as main components impacting satisfaction of ERP users: interaction with the IT department, pre-implementation processes, and ERP product and adaptability. Many studies have been performed to investigate user satisfaction in the context of an ERP system, for example, Bin et al. (2010); and Venugopal et al. (2010).
The efforts to study user satisfaction with a specific system (micro) continued, and included many types of systems such as Decision Sup-port Systems (DSS) by Jarupathirun and Zahedi (2007); Hung et al. (2007); and Gudigantala et al. (2010); Computerized Accounting System (CAS) by Ilia et al. (2009); Data warehousing by Shin (2003); Knowledge management systems by Wu and Wang (2006); Kulkarni et al. (2007); and Liaw et al. (2008).
With regard to the macro view, a study by Bai-ley and Pearson (1983) is believed to be the most important contribution concerning measuring user satisfaction. The main contribution of this study was producing a valid and reliable questionnaire to gauge user satisfaction. The questionnaire had 39 distinct factors and is “based on the semantic differential of four adjective pairs which describe the factor” (Bailey & Pearson, 1983, p. 538). Ives et al. (1983) claimed that, “Although Pearson’s study represents an important first step toward the development of a valid UIS measure, further investigation is required to assess the validity and reliability of Pearson’s measure and to refine it for use in research and practice”. Based on this claim, Ives et al. (1983) carried out a study to achieve four purposes. The most important one was to develop a “short form” of the instrument to measure user satisfaction. The procedures under-taken to establish the short form instrument and the statistical analysis conducted in this regard prove that “the short questionnaire is a sound general measure of Pearson’s original UIS concept” (Ives et al., 1983, p. 791). The short form instrument has been used in many studies, for instance Wu and Wang (2007) and Miller (2010).
investigated the factors affecting the success of User Development computer Application (UDA). The results concluded that the factors that affected overall user satisfaction were independence from Data Processing (DP), user satisfaction with the environmental setup, perception of the user friend-liness of software tools, user attitude toward UDA, the degree of DP push and lastly user satisfaction with support from DP. Many other studies fol-lowed this direction, these include Ong and Lai (2007); Leclercq (2007); Pike et al. (2010); and Al Maskari and Sanderson (2010).
Based on the second approach, some studies adopted user satisfaction as one factor of a group of factors to assess the success of the information system. Raymond (1990) considered user satisfac-tion as a measure of informasatisfac-tion system success beside offline usage and online usage. DeLone and McLean (1992; 2003) also adopted user sat-isfaction as an essential factor in the success of an information system beside five other factors. Studies by Wixom and Todd (2005), Sabherwal et al. (2006), Larsen (2009), and Kang and Lee (2010) were supportive of this approach.
Those two approaches have shared aspects with micro and macro approaches. Some studies have adopted user satisfaction as a comprehensive measure to assess a specific system (micro) or the overall information systems (macro). User satisfac-tion has also been adopted as only one factor out of a group of factors to evaluate specific system
(micro) or overall information systems. Table 2 shows some studies based on the shared aspects among the approaches described.
[image:11.612.90.532.585.720.2]Electronic systems facilitate delivery of digi-tal products and services increasingly based on internet marketing (Kiang et al., 2000). Wang et al. state that “Measures of user information sat-isfaction developed for the conventional data processing environment or end-user computing environment may no longer be appropriate for the digital marketing context, where the role of an individual customer is in some ways different to that of an organizational end user” (2001, p. 89). To study factors affecting user satisfaction with electronic systems, some research has been con-ducted. Wang et al. (2001) identified seven factors which shaped Customer Information Satisfaction (CIS): customer support, security, ease of use, digital products/services, transaction and payment, information content and innovation. Lai (2006) identified three factors of user satisfaction associ-ated with e-business, namely: content, depend-ability and ease of use. In the same context, Cristobal et al. (2007) proved that consumer sat-isfaction with e-service affected web site loyalty. Liao et al. (2007) employed the Theory of Plan-ning Behavior (TPB) and customer satisfaction to identify factors affecting the continued use of e-service. The results of that study concluded that customer satisfaction is a main determinant of the customer’s behavioural intentions toward e-service
Table 2. Selected studies with shared aspects among the user satisfaction approaches
User Satisfaction
Approaches Micro level Macro level
Comprehensive Chin et al. (1988); Somers et al. (2003); Longinidis and Gotzamani (2009); Larsen (2009); Bin et al. (2010); Venugopal et al. (2010); Ilia et al. (2009); Rainer and Watson (1995); Ong and Lai (2007); Pike et al. (2010); Almaskari and Sanderson (2010).
Bailey and Pearson (1983); Ives et al. (1983); Joshi et al. (1986); Rivard and Huff (1988); Doll and Torkzadah (1988); Palvia (1996); Etezadi-Amoli and Farhoomand (1996); Doll et al. (2004); Leclercq (2007).
One out of a group of
factors Shin (2003); Wu and Wang (2006); Hung et al. (2007); Jarupalhirun and Zahedi (2007); Kulkarni et al. (2007); Liaw et al. (2008); Chung et al. (2009); Larsen et al. (2009); Kang and Lee (2010).
continuance. Study findings of Udo et al. (2010) were supportive of the result of Liao et al. (2007), concerning the role of user satisfaction on behav-ioural intention in the context of e-service. Ver-degem and Verleye (2009) found that nine factors were considered fundamental in creating user satisfaction in the context of e-government: in-frastructure, cost, awareness, security/privacy, content, usability, technical aspects, customer friendliness and availability. Finally, McNamara and Kirakowski (2011) proposed and examined the validity and reliability of the Consumer Prod-ucts Questionnaire (CPQ). This instrument was prepared to measure user satisfaction with elec-tronic consumer products. Three factors were identified as significant dimensions of CPQ: ef-ficiency, helpfulness, and transparency.
Learners’ dissatisfaction with e-learning expe-rience still is a critical issue (Liaw, 2008). Most of the studies which dealt with user satisfaction, in the context of e-learning systems, have targeted investigation of the role of this construct in creating the success of e-learning systems. Some studies employed user satisfaction as a dependent variable and aimed to determine factors affecting it. Based on this direction, Arbaugh conducted a study to answer the crucial question: “What factors must be present to produce effective internet- based courses?” (2000, p. 33). The answer produced from the empirical study illustrated that the flexibility of the medium, the ability to develop an interactive
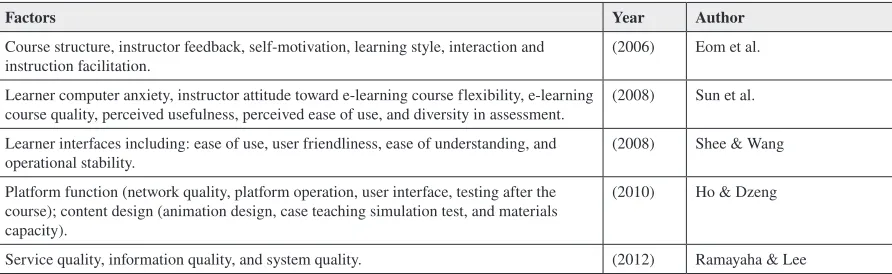
courses environment, and the ease or frequency with which the medium can be used were the main factors affecting and determining student satisfaction. Lee and Hwang (2007) conducted a study to explore factors affecting e-learner’s satisfaction. The results confirmed that perceived usefulness, perceived ease of use, service quality on interaction, self-regulation, learning strategy, and computer self-efficacy affected e-learner’s satisfaction. Wu et al. (2010) produced a model to measure student satisfaction in a Blended E-Learning Systems (BELS). Social cognitive theory was employed in the model’s design. Analysis of results confirmed that interaction among cognitive factors, technological environmental factors, and social environmental factors had an impact on learning satisfaction. Lin and Chen (2012) com-bined the Technology Acceptance Model (TAM) and McLean and DeLone’s model to identify the factors affecting user satisfaction and continuous use of e-learning systems. The results confirmed that system quality, platform information, and course information were the main determinates of user satisfaction and continuous use of e-learning systems. Table 3 shows some studies that adopted the above approach.
Another framework was followed by some researchers to measure user satisfaction in the context of e-learning systems. Within this frame-work, user satisfaction has been considered an essential factor affecting e-learning system
con-Table 3. Selected studies conducted to identity factors affecting user satisfaction
Factors Year Author
Course structure, instructor feedback, self-motivation, learning style, interaction and
instruction facilitation. (2006) Eom et al. Learner computer anxiety, instructor attitude toward e-learning course flexibility, e-learning
course quality, perceived usefulness, perceived ease of use, and diversity in assessment. (2008) Sun et al. Learner interfaces including: ease of use, user friendliness, ease of understanding, and
operational stability. (2008) Shee & Wang Platform function (network quality, platform operation, user interface, testing after the
course); content design (animation design, case teaching simulation test, and materials capacity).
(2010) Ho & Dzeng
[image:12.612.74.520.583.720.2]tinuance intention. Most of these studies have in fact considered user satisfaction as an essential factor in determining user’s continuance intention and at the same time other factors “take their turn” as determinants of user satisfaction. Chiu et al. (2005) employed Expectancy Disconfirmation Theory (EDT) to measure factors that affect e-learning continuance intention and their outcomes confirmed that satisfaction has determined user’s continuance intention and that user satisfaction was determined by perceived usability, perceived quality, perceived value and usability disconfirma-tion. The result of a study conducted by Liaw (2008) identified two groups of factors as the determinates of perceived satisfaction: learner’s characteristics, and environmental factors. The studies by Hayashi et al. (2004); Limayem and Cheung (2008); Larsen et al. (2009); Cho et al. (2009) have adopted this approach in dealing with user satisfaction in the context of e-learning sys-tems.
In summary, since 1970, the term “user satis-faction” has appeared in the information system literature and received considerable attention from the researchers. Two approaches have applied user satisfaction to measure the success of information systems: micro and macro. In addition, two other approaches were adopted to employ user satis-faction to measure information system success. The first approach considers user satisfaction as a single (comprehensive) measure to assess the success of an information system. In the second approach user satisfaction is one factor in a group of factors to measure the success of information systems. User satisfaction has become a critical issue, especially after the rise of electronic ap-plications. Today, the term “user satisfaction” is no longer limited to internal users but has been extended to include external customers as well. Considerable efforts have been made to address the issue of user satisfaction in the e-learning sys-tems field. These efforts were in two directions: user satisfaction as a dependent variable and user satisfaction as an independent variable.
RESEARCH METHODOLOGY
Research Models
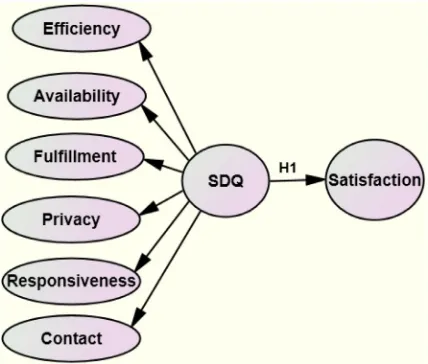
Two models have been designed to be tested in this research. The first model aims to investigate the effect of SDQ on user satisfaction. Second order factor analysis was used with SDQ to examine this model. The second model has been designed to test the effect of each sub-dimensions of SDQ on user satisfaction. The second model was established based on the first-order correlated factors. Figures 1 and 2 show the research models.
To test the effects of SDQ on user satisfaction, seven hypotheses have been formulated:
H1: SDQ significantly affects user satisfaction.
H2: Efficiency significantly affects user satisfac-tion.
H3: Availability significantly affects user satis-faction.
H4: Fulfillment significantly affects user satis-faction.
H5: Privacy significantly affects user satisfaction.
H6: Responsiveness significantly affects user satisfaction.
[image:13.612.328.542.541.723.2]H7: Contact significantly affects user satisfaction.
Measurement Instrument
The items of SDQ were adopted from the work of Parasuraman et al. (2005). The main justification to use E-S-QUAL is that the validity and reliability of this instrument have been tested. This instrument comprises two scales: E-S-QUAL which includes efficiency; fulfillment; system availability; and privacy, and E-RecS-QUAL which includes responsiveness; compensation; and contact. The second scale was used by Parasuraman et al. (2005) for the customers who had non-routine encounters with the sites. In this research, the two scales will be used together, as one scale, because the students are using the e-learning systems frequently to achieve learning outcomes. Contact and responsiveness are considered to be the main elements in providing services in e-learning sys-tems. Students use different electronic channels, such as email, chatting room, and phone, to keep in touch with academic staff to perform educa-tional activities, receive comments, feedback, and share information with other students. For those reasons, the E-RecS-QUAL has been included in E-S-QUAL. Compensation is not included in this measurement model because it is not applicable in the context of e-learning systems. The items
used in this study to measure SDQ are distributed as follows: efficiency (4 items); availability (3); fulfillment (4); privacy (3); responsiveness (3); and contact (4). It is worth mentioning that two items to measure the contact dimension were ad-opted from the study of Ong and Lai (2007), and the two others were selected from Parasuraman et al.’s (2005) instrument.
Five items are used to measure students’ sat-isfaction with e-learning systems. The first two items, SATF1 and SATF2, are sourced from a study by Roca et al. (2006). The remaining three items, SATF1, SATF2, and SATF3, were taken from Arbaugh’s (2000) study.
Likert scales (1 strongly disagree as low and 5 strongly agree as high) were used in the instru-ment to measure the opinions of respondents about e-learning system success. Two more op-tions were added to the scale: Don’t know, and Not applicable. Table 4 shows the items used to measure the study constructs.
Study Sample and Data Collection
The research was conducted with students enrolled in 2011in online courses offered by the University of Southern Queensland (USQ). Those students have constant interaction with the e-learning system at USQ, and their opinions provide a real picture about e-learning systems.
The reason behind selecting USQ as the study sample is that USQ focuses on distance education. The percentage of online students in 2008, 2009, and 2010 were 75%, 73%, and 72% respectively (University of Southern Queensland, 2010). USQ has more than 10 percent of the Australian Distance Education market and in excess of 40 percent of the International Distance Education Market (University of Southern Queensland, 2010).
[image:14.612.73.286.142.295.2]USQ adopted WebCT as its learning manage-ment system in 2002. In 2008 USQ decided to replace WebCT with Moodle because software
licence costs for WebCT had increased and academic staff preferred open source software. Currently Moodle v.2.2 is in use.
Moodle is complemented by EASE (Elec-tronic Assignment Submission Environment) and Camtasia. EASE is used by students to submit assignments and teaching staff can mark and manage grades online.. Moodle includes its own assignment submission function but it is con-sidered only suitable for small courses with one
marker. EASE was designed for large courses with multiple markers. EASE has a “Marker Manage-ment Module” that allows markers to log in, mark electronically, and upload marks and feedback directly into the system.
[image:15.612.90.550.125.545.2]Camtasia Relay is the application used to record lectures in lecture theatres and teaching rooms and make these available to students online. It is also used by some students to prepare presentations for assessment.
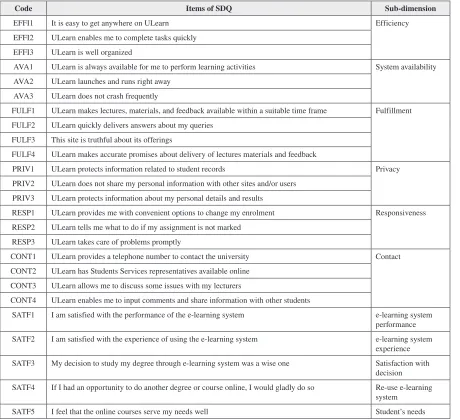
Table 4. Measurement of SDQ and user satisfaction
Code Items of SDQ Sub-dimension
EFFI1 It is easy to get anywhere on ULearn Efficiency EFFI2 ULearn enables me to complete tasks quickly
EFFI3 ULearn is well organized
AVA1 ULearn is always available for me to perform learning activities System availability AVA2 ULearn launches and runs right away
AVA3 ULearn does not crash frequently
FULF1 ULearn makes lectures, materials, and feedback available within a suitable time frame Fulfillment FULF2 ULearn quickly delivers answers about my queries
FULF3 This site is truthful about its offerings
FULF4 ULearn makes accurate promises about delivery of lectures materials and feedback
PRIV1 ULearn protects information related to student records Privacy PRIV2 ULearn does not share my personal information with other sites and/or users
PRIV3 ULearn protects information about my personal details and results
RESP1 ULearn provides me with convenient options to change my enrolment Responsiveness RESP2 ULearn tells me what to do if my assignment is not marked
RESP3 ULearn takes care of problems promptly
CONT1 ULearn provides a telephone number to contact the university Contact CONT2 ULearn has Students Services representatives available online
CONT3 ULearn allows me to discuss some issues with my lecturers
CONT4 ULearn enables me to input comments and share information with other students
SATF1 I am satisfied with the performance of the e-learning system e-learning system performance SATF2 I am satisfied with the experience of using the e-learning system e-learning system
experience SATF3 My decision to study my degree through e-learning system was a wise one Satisfaction with
decision SATF4 If I had an opportunity to do another degree or course online, I would gladly do so Re-use e-learning
Both international and local students can receive support by email or phone from Student Relationship Officers and Academic staff as well as via channels such as ASKUSQ (online), and social networks (twitter and Facebook).
The study is limited to USQ because studying many different institutions would be prohibitively costly and time-consuming. The survey was de-veloped using Survey Monkey and the link sent to 5903 students who were enrolled in online courses via the StudyDesk. The students were selected from four Faculties: Faculty of Busi-ness and Law; Faculty of Sciences; Faculty of Arts; Faculty of Engineering and Surveying. The returned questionnaires totaled 732. However, 12 questionnaires were unusable and eliminated from the analysis, yielding 720 useable questionnaires, a response rate of 12.4 percent.
Data Analysis
Structural Equation Modeling (SEM) was used to analyse data. Hair et al. define SEM as a “Mul-tivariate technique combining aspects of factor analysis and multiple regression that enables the researcher to simultaneously examine a series of interrelated dependence relationships among the measured variables and latent constructs (vari-ates) as well as between several latent constructs” (2006, p. 710).
SEM is used to test different types of theoreti-cal models and examine the relationships between constructs (Schumacker & Lomax, 2004). The use of SEM in social sciences has increased and especially in management disciplines such as man-agement information systems (Gefen et al., 2000), strategic management (Shook et al., 2004), and marketing management (Hair et al., 2012). Many reasons are behind using SEM to test theoretical models. SEM enables researchers to test the whole model fit and provides them with comprehensive statistical indicators for assessing and modifying the models (Anderson & Gerbing, 1988; Kline,
2011). SEM allows researchers to obtain answers to interrelated research questions at three levels: single; systematic; and comprehensive analysis (Gefen et al., 2000).
To test the One-factor congeneric model and measurement models, Confirmatory Factor Analysis (CFA) was conducted. The main reason to use CFA is to eliminate the weak items and reach the fit measurement model. According to Marsh (1985), there are three reasons why CFA is considered superior to exploratory factor analysis. First, CFA enables researchers to design models that are to be examined whereas in exploratory factor analysis, the control of researchers over the model is limited. Second, “CFA parameter estimates are unique so long as the hypothesized model is identified” (Marsh, 1985, p. 432). Third, goodness-of-fit indicators such as Chi-Square, CFA, AGFI, and RMSEA are provided by CFA, and researchers can use these indicators to assess different models using same data, and testing the fitness of the same model with data from differ-ent groups.
this study is that a value close to zero indicates an excellent fit whereas a high value (close to 1) indicates worst fit (Kline, 2011).
Goodness-of-Fit Index (GFI) and Adjusted Goodness-of-Fit Index (AGFI) were used as abso-lute fit indices. There are no recommended cut-off levels for evaluating GFI and AGFI (Bagozzi & Yi, 2012; Hair et al., 2006). Most of the studies adopt 0.90 as a cut-off for GFI (Hair et al., 2006; Hooper et al., 2008). This value has also been recommended by Chau (1997; 2001) to use in the information systems field. Thus, 0.90 will be used in this study. According to Hooper et al. (2008) the accepted value of AGFI is ≥0.90. This cut-off will be employed to assess this indicator.
Generally, the P value of Chi-Square should be > 0.05 but it is very sensitive to sample size (Hu & Bentler, 1998). In this regard, Dai states that “A very large (or small) sample size will of-ten yield a significant Chi-square value that can result in the rejection of a correct model” (2010, p. 54). As this research sample is large (720) the P value was eliminated as an indicator to assess the model fit due to the sensitivity problem of
this index. Normed Chi-square (χ2/df) (in AMOS
appears CMIN/DF) is used instead of Chi-Square, and the cut-off of this indicator is one (1) to three (3) (Hooper et al., 2008). The reliability was tested using Squared Multiple Correlation (SMC), Cronbach Alpha, and Coefficient H. The validity was examined using convergent validity and construct validity.
The questionnaire included 26 items. Only one of these was an open ended question: “Please write any comments about the factors affecting e-learning system success”. The comments received from the respondents are analysed using content analysis. The main purpose to employ content analysis is to compress the text into categorises (Weber 1990). Content analysis was used in this study to identify and categorise the most frequent keywords based on the comments of the surveyed students.
The Empirical Study
The empirical study was conducted in four phases.
Phase One: One-factor Congeneric
Measurement Model
The main purpose of this stage is to measure the validity of each construct separately. CFA was the essential technique that can be used to achieve this task. Via CFA the weak items can be identified and the whole model can be evaluated through the indices of fit model. 20 items were input to the first iteration of CFA which represented six dimensions. The fit indices were CMIN/DF 5.498, GFI 0.891, AGFI 0.853, CFI 0.892, NNFI 0.868, RMR 0.054 and RMSEA 0.079. These indicators point to poor model fit and the model needs more improvement. The modification indices can be traced to the cross loading among the items. Standardized regression weight and squared Multiple Correlations can be useful in determining the weak items that cannot measure the construct adequately. At iteration two, the item AVA1 was eliminated due to the high cross loading with other items. The model fit indices after AVA1 was deleted were CMIN/ DF 4.156, GFI 0.918, AGFI 0.886, CFI 0.929, NNFI 0.911, RMR 0.032 and RMSEA 0.066. The indicators show that the model is improved. However, the model still does not fit the data, therefore, this process should be repeated until the model fits. Iterations were undertaken seven times to reach the fit model. The model-fit indices of each iteration are depicted in Table 5. Figures 3 and 4 show the model at the first iteration and at the last iteration.
Table 5. Results of SDQ measurement model
Iterations CMIN/DF GFI AGFI CFI NNFI RMR RMSEA Eliminated Item
First 5.498 0.891 0.853 0.892 0.868 0.054 0.079 -Second 4.156 0.918 0.886 0.929 0.911 0.032 0.066 AVA1 Third 3.310 0.940 0.914 0.949 0.935 0.030 0.057 CONT4 Fourth 3.254 0.945 0.919 0.954 0.940 0.029 0.056 CONT1 Fifth 2.668 0.959 0.938 0.969 0.958 0.025 0.048 RESP1 Sixth 2.745 0.962 0.939 0.971 0.960 0.032 0.049 PRIV1 Seventh 1.749 0.979 0.964 0.989 0.983 0.019 0.032 FULF4
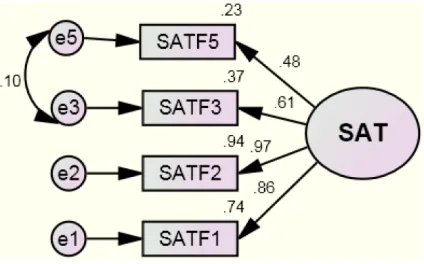
[image:18.612.156.439.286.723.2]should be identified and solved. The modification indices showed a high crossing loading between SATF4 and items SATF1, SATF2, and SATF3.
Item SATF4 has been eliminated. The results after SATF4 was deleted were CMIN/DF 4.357, GFI 0.994, AGFI 0.971, CFI 0.995, NNFI 0.985, RMR 0.017 and RMSEA 0.068. Based on the
[image:19.612.167.467.125.570.2]results of the second iteration, the model signifi-cantly improved. However, there was still a cross loading between SATF3 and SATF5 and this issue has been solved by making covering error vari-ances terms of those two items. The results of the third iteration were CMIN/DF 2.734, GFI 0.998, AGFI 0.981, CFI 0.999, NNFI 0.992, RMR 0.006
and RMSEA 0.049. Figures 5 and 6 show the first and the third (last) user satisfaction One-factor congeneric measurement model.
Phase Two: Measurement Model
Structural equation modeling can be used to test the measurement model, the structural model, and to provide indicators to evaluate the models (Koufteros et al., 2009). Three measurement mod-els were designed based on the studies by Doll et al. (1994) and Sedera and Gable (2004). The first measurement model was established based
on the seven first-order correlated factors. The indicators of the fit model were CMIN/DF 4.969, GFI 0.925, AGFI 0.887, CFI 0.929, NNFI 0.905, RMR 0.046 and RMSEA 0.074. The result of analysis of this model highlighted a problem with item SATF5 and the problem was the high cross loading with the other items. After eliminating SATF5 the model significantly improved and the results were CMIN/DF 2.341, GFI 0.965, AGFI 0.945, CFI 0.978, NNFI 0.970, RMR 0.024 and RMSEA 0.043. Based on these results, the item STAF5 was eliminated from the other measure-ment models as well.
The second measurement model was tested based on the second-order factors and the results were CMIN/DF 2.654, GFI 0.953, AGFI 0.936, CFI 0.968, NNFI 0.962, RMR 0.030 and RMSEA 0.048.The third measurement model was tested based on the one first-order factor and the results were CMIN/DF 13.457, GFI 0.785, AGFI 0.724, CFI 0.748, NNFI 0.712, RMR 0.060 and RMSEA 0.132. Figures 7 to 9 show the three measurement models
The results confirm that the seven first-order correlated factors’ measurement model presents goodness-of-fit better than the other two models. The second-order factors measurement model provides a good model fit. However, the indicators of the third measurement model reveal that the model does not fit the data. Thus, the seven first-order correlated factors’ measurement model was the best model to explain the effect of SDQ on user satisfaction.
Phase Three: Validity and Reliability
The reliability of each construct was tested by Squared Multiple Correlation (SMC), Cronbach’s Alpha, and Coefficient H. Although the recom-mended level of SMC was > 0.50 (Kline, 2011), a SMC value of 0.30 was considered acceptable (Holmes-Smith, 2011). The values of SMC of SDQ items were between 0.303 and 0.786 and between 0.396 and 0.392 for user satisfaction items
Figure 5. One-factor congeneric measurement model of user satisfaction (First iteration)
[image:20.612.72.285.346.531.2] [image:20.612.73.285.590.722.2]which indicate acceptable reliability of the model constructs. These results of reliability were sup-ported by the Cronbach’s Alpha values (between 0.71 and 0.865 for the SDQ dimensions and 0.854 for user satisfaction) that exceed the acceptable level (0.70). However, the Cronbach’s Alpha value of contact was 0.661 and this value was less than
[image:21.612.177.456.121.573.2]the acceptable level. Coefficient H as proposed by Hancock and Mueller (2001) was used to measure the construct reliability. The recommended level of Coefficient H was 0.70. The results of calculating Coefficient H were between 0.67 and 0.868 for the SDQ dimensions and 0.925 for user satisfac-tion. Coefficient H for the contact dimension has
a problem in reliability but the indicators of SMC and factor loading highlighted the ability of this construct in measuring the SDQ.
The standardized regression weight values of two items of contact were more than 0.5 and both were significant. Convergent validity is “a measure of the magnitude of the direct structural relation-ship between an observed variable and latent
[image:22.612.148.448.125.571.2]construct” (Holmes-Smith, 2011, p. 9-24). The recommended value of factor loading to achieve convergent validity is 0.70 with 0.50 considered an acceptable level (Shook et al., 2004). The values of factor loading for the SDQ dimensions were between 0.551 and 0.926, and between 0.63 and 0.9441 for user satisfaction confirming the validity of the constructs. In addition, the critical
ratio of these indicators was more than 1.96 and indicates that all the regressions are significant. The indices of goodness-of-fit measures indicate the construct validity. The constructs in this study have achieved a goodness-of-fit model and the indices provide evidence of the validity of those constructs. Table 6 depicts the reliability and validity of the two constructs.
Phase Four: Testing the Model
Two models have been designed to achieve the critical objective: to investigate the role of SDQ user satisfaction of e-learning systems from the perspective of students. SEM was selected to
test the hypotheses. The first model depends on second-order CFA to test the effect of SDQ on the user satisfaction and Figure 10 shows this model. The indicators of model fit for the first model were CMIN/DF 2.654, GFI 0.953, AGFI 0.936, CFI 0.968, NNFI 0.962, RMR 0.030 and RMSEA 0.048. These results highlighted that the model has an excellent fit and all the indices were within the acceptable levels. The regression weights of the first model are shown in Table 7.
The results of the first model show that SDQ significantly impacts user satisfaction. The value of the critical ratio was 21.795 and it was evidence of the significant impact of the SDQ construct as an exogenous construct in enhancing user
[image:23.612.221.413.123.482.2]tion (the endogenous construct). The critical ratios of the indicator variables of SDQ are more than 1.96 which indicates that all these dimensions significantly represent the main construct (SDQ). Based on these results, hypothesis 1 that SDQ affects user satisfaction was not rejected.
The second model was designed to obtain more details about the effect of each sub-dimension of SDQ on user satisfaction. Figure 11 depicts this model.
The indices of the model were CMIN/DF 2.314, GFI 0.965, AGFI 0.945, CFI 0.978, NNFI 0.970, RMR 0.024 and RMSEA 0.043. These indicators provide evidence of an excellent model fit. The regression weights of the second model are shown in Table 8.
The results of testing the second model confirm the significant impacts of two dimensions of SDQ in enhancing user satisfaction: efficiency and
fulfillment. However, the effects of availability, privacy, responsiveness, and contact on user satisfaction were insignificant. Based on these results hypotheses 2 and 4 are not rejected and hypotheses 3, 5, 6, and 7 are rejected.
DISCUSSION
This research aimed to investigate the role of SDQ on user satisfaction at two levels: SDQ and each sub-dimension of SDQ. The results of conducting CFA highlighted that SDQ and user satisfaction are valid and reliable to evaluate the success of e-learning systems. The results support the notion that SDQ can be measured by six sub-dimensions: efficiency; availability; fulfillment; privacy; responsiveness; and contact. The findings from conducting the one-factor congeneric
measure-Table 6. Validity and reliability indicators
Construct Aspects Items Squared
Multiple Correlation
Factor
Loading Cronbach’s Alpha Coefficient H
SDQ Efficiency EFFI1 0.641 0.801 0.865 0.868 EFFI2 0.731 0.855
EFFI3 0.674 0.821
Availability AVA2 0.786 0.887 0.825 0.843 AVA3 0.627 0.792
Fulfillment FULF1 0.609 0.781 0.774 0.782 FULF2 0.537 0.733
FULF3 0.462 0.68
Privacy PRIV2 0.568 0.747 0.72 0.721 PRIV3 0.558 0.75
Responsiveness RESP2 0.303 0.551 0.713 0.866 RESP3 0.857 0.926
Contact CONT2 0.449 0.67 0.661 0.67 CONT3 0.544 0.735
Satisfaction E-learning System
Experi-ence SATF1 0.777 0.882 0.854 0.925 E-learning System
[image:24.612.74.524.123.432.2]ment model with the user satisfaction construct indicated that three items out of five used in this research are valid and reliable to measure user sat-isfaction in the e-learning system area: satsat-isfaction with e-learning system performance, satisfaction e-learning system experience, and satisfaction with the decision to study online.
Three measurement models were tested in this research. The first-order correlated factors and second order factors confirmed the
[image:25.612.128.504.121.543.2]reli-Figure 10. Results of SEM tests of the first research model
Table 7. Regression weights of the first model
Estimate S.E. C.R. P
Efficiency ← SDQ .682 .033 20.724 *** Availability ← SDQ .433 .033 13.186 *** Fulfillment ← SDQ .487 .030 16.389 *** Privacy ← SDQ .319 .030 10.644 *** Responsiveness ← SDQ .552 .031 17.701 *** Contact ← SDQ .477 .029 16.570 *** User
[image:25.612.86.304.587.719.2]Figure 11. Results of SEM tests of the second research model
Table 8. Regression weights of the second model and hypotheses outcomes
Estimate S.E. C.R. P Decision of Hypotheses
[image:26.612.73.523.587.702.2]ability and validity of SDQ and user satisfaction in evaluating e-learning system success. These findings are supported by other indicators such as Squared Multiple Correlation (SMC), Cronbach Alpha, Coefficient H, convergent validity, and construct validity.
As mentioned before, two models were de-signed to test the hypotheses and to identify the effects of SDQ on user satisfaction. The first model was designed to examine the effect of SDQ on user satisfaction. The results indicated that SDQ significantly affected user satisfaction. In other words, SDQ can be considered as an essential determinate of user satisfaction. Based on these results, SDQ plays a critical role in creating and enhancing user satisfaction which contributes to the success of e-learning systems. These results about the role of SDQ in enhancing the success of e-learning systems and as a major construct in evaluating e-learning systems are matched with findings of studies by Holsapple and Lee-Post (2006), Roca et al. (2006), Lin (2007), Wang et al. (2007), Ozkan and Koseler (2009), Wang and Wang (2009), and Adeyinka and Mutula (2010). Thus, SDQ quality is a critical success factor of e-learning systems and user satisfaction can be employed to measure the users’ attitudes toward e-learning systems.
The second model was designed to provide more detail about the role of SDQ on user sat-isfaction. In this model, the impact of each sub-dimension of SDQ on user satisfaction has been tested. The results of testing the hypotheses indi-cated that efficiency and fulfillment significantly affected user satisfaction. However, the effect of four sub-dimensions of SDQ on user satisfaction was insignificant namely: availability; privacy; responsiveness; and contact.
The efficiency of e-learning systems signifi-cantly impacted user satisfaction. The efficiency of e-learning is related to ease of access to the system. Accessing the e-learning system by students from different areas and using different devices helps them feel satisfied using this system.
In addition, achieving educational tasks quickly via using e-learning systems can contribute to generating positive feelings towards using these types of systems. Completing tasks quickly can be supported by integrating the e-learning system with other software and systems.
The final aspect of e-learning system efficiency is that the system is well organized. Organising the e-learning system and the interface (website) may assist students in finding the information they need easily and that will lead to saving students’ time.
Fulfillment significantly contributed to user satisfaction. The fulfillment dimension of SDQ is related to the veracity of the e-learning system and the time needed to receive the answers to enqui-ries. Delivering lectures, materials, and feedback to students in a reasonable time can enhance the students’ trust toward the e-learning system and that can improve the students’ satisfaction with this system. Students sometime have enquiries related to the educational tasks, managerial issues, and technical problems and need to receive answers quickly. Therefore, response time is considered to be an essential indicator to evaluate the fulfillment of the e-learning system.
The aspects of accessibility, veracity of the system, and quick response are critical aspects in developing students’ performance and enhanc-ing their satisfaction toward usenhanc-ing the e-learnenhanc-ing system.
may be not available on some devices used to access e-learning services, e.g. mobile phones.
Privacy also insignificantly affected user satisfaction. The main justification of the non-significant effect of privacy on user satisfaction is that students tend to share information about the study, comment on the materials, share knowledge, and invite other students to study in groups.
The same result about those two dimensions was found by Parasuraman et al. (2005): the effects of system availability and privacy were insignifi-cant on perceived value and loyalty intentions. The result of the non-significant effect of privacy is also supported by Wolfinbarger and Gilly (2003).
The impact of responsiveness and contact on user satisfaction were insignificant. In respect to responsiveness, this issue is related to the response time and the details provided to students to solve problems. Therefore, the shortfalls in time or in methods to fix problems can create negative feelings toward the system. Sometimes students can obtain the solutions of problems via the chat channels that are available in the e-learning system or receive information about their problems, espe-cially educational problems, via study groups. The e-learning system enables students to send emails to invite students who live in the same area to meet to study together. Regarding the contact dimen-sion, students need to contact to the University or Academic staff when they face problems or have enquiries. The contact details for the University and Academic staff are available on the e-learning system interface. However, students may not use these contact channels, especially the phone, due to the high calling costs, specifically for overseas students. Thus, the contact dimension is not an issue for those students and does not affect their satisfaction toward e-learning systems.
The questionnaire used in this study included an open ended question to ask students to provide comments about the factors affecting e-learning system success. In total, 226 comments were received. Content analysis of these comments revealed a range of issues. The structure of the
e-learning system interface is the most frequent problem faced by external students. Students feel that the design of the website is confusing and they encounter problems using the website. In this regard, students state that “It is easy to get lost in the array of links and university-related tabs, not knowing where you need to go” (survey
response #254), and “Ulearn is quite convoluted
in its structure. If one starts from the USQ home page it often takes four screens, each which opens a new web page and requires re-signing-in” (#332).
The issue of web site design leads to another problem: difficulty in navigation “This site can sometimes be overcrowded and hard to navigate”
(#32). Students may waste time collecting specific information from the e-learning system.
Another issue identified with the e-learning system at USQ is inconsistent functions/content across courses. This problem is generated because there is no standard format or style to use by the Academic staff to organise their courses on the StudyDesk. Inconsistent function and content across courses means that the student needs to know the details and the structure of each course to collect the required information. This issue may consume students’ time to find the information and students may miss some important informa-tion due to inconsistency of content. Regarding this issue, students state that “Keeping web page presentation the same i.e. it appears that between courses the layout of pages can vary greatly, and this gets to be confusing” (#19); “I dislike how every course home page is set out slightly differ-ently. You have to get you head around each one. i.e. where lectures are posted” (#326).
I know that on campus students would have a lot of extra materials to use to study” (#143). Other students highlighted that materials, information, and feedback are not available when needed and that may impact their study schedule.
Students believe that the issues of lack of in-formation, inconsistency across courses/content, and limited interaction are due to the shortfall in the lecturers’ abilities to use the e-learning system. Students claim that some of the lecturers do not appropriately use all the functions and tools of the system. The lecturer’s ability is an important factor enhancing the academic performance of students. In this regard, a student states that “Some lectur-ers do not provide the options to fast forward” (#15). Another student linked the effectiveness of the e-learning system to the abilities of lecturers: “E-learning is only as effective as the lecturers’ abilities to utilize it appropriately” (#31). Some students indicated that problems of study are due to the late delivery of materials to the external
students “More troubles come from lecturers not
uploading material early enough” (#123). Some issues identified are related to the sub-dimensions of service delivery quality. Fulfill-ment is an essential sub-dimension of service delivery quality. This sub-dimension is related to the delivery of the service within a suitable time frame and the truthfulness of the site offerings. However, some external students have negative feelings toward e-learning system fulfillment. For instance, “Timing of lecture uploads is sometimes several days after the lecture has been delivered so effects timing of weekly study” (#208).
The main purpose of the communication is to enhance the interaction between the students, their peers and the academic staff. However, external students still face problems in this regard. This
issue is clear in the comments of students: “It
seems hard to get true dialogue occurring over a chat room in the University but people is will-ing to chat on other social media sites” (#273). Another problem is that sometimes the external students cannot locate contact details of support
staff: “The student representative need to be more easily findable, so students can identify who they are and raise any issues with them” (#560).
Students always direct their queries to aca-demic staff and they expect to receive responses in reasonable time. Some students encounter the problem of delays in receiving answers to their queries: “E-learning tools still require a com-mitment from the course examiner to respond promptly to queries and put up information in a format that is easy to access and use” (#346);
“Sometimes the response from lecturers can be a bit slow but I can also appreciate that there are a lot of people asking the same question over, mak-ing this a tedious job for lecturers to sift through these and respond” (#253).
USQ uses EASE and Camtasia to complement Moodle to support service delivery to the external students. However, students face some challenges
regarding EASE, for example “EASE is sometimes
not available, which makes it very difficult for those students in remote areas to send their assignments through on time” (#307); “I dislike using EASE to submit my assignments as I have had difficulties with it” (#326). Some students feel that EASE is not integrated with the e-learning system at the University “I think for an e-learning system where people learn, access materials and talk about as-sessments, it is weird that EASE is not integrated into USQStudyDesk - we are required to rekey our login details to access this feature which should already be available for consolidation and ease of access” (#635).