Article
Optimization of Biodiesel-Diesel Blended Fuel
Properties and Engine Performance with Ether
Additive Using Statistical Analysis and Response
Surface Methods
Obed M. Ali1,*, Rizalman Mamat1,†, Gholamhassan Najafi2,*,†, Talal Yusaf3,*,† and Seyed Mohammad Safieddin Ardebili4
Received: 15 October 2015; Accepted: 2 December 2015; Published: 16 December 2015 Academic Editor: Filippo Sgroi
1 Faculty of Mechanical Engineering, University Malaysia Pahang, Pekan 26600, Pahang, Malaysia;
2 Mechanics of Biosystems Engineering Department, Tarbiat Modares University, Tehran 14115-111, Iran
3 Faculty of Engineering and Surveying, University of Southern Queensland University, Toowoomba,
QLD 4350, Australia
4 Department of Biosystems Engineering, Shahid Chamran University of Ahvaz, Ahvaz 6135583151, Iran;
* Correspondence: [email protected] (O.M.A.); [email protected] (G.N.);
[email protected] (T.Y.); Tel.: +609-424-6216 (O.M.A.); +98-21-4829-2322 (G.N.);
+61-7-4631-2691 (T.Y.); Fax: +609-424-6222 (O.M.A.); +98-21-4829-2200 (G.N.); +61-7-4631-2526 (T.Y.)
† These authors contributed equally to this work.
Abstract:In this study, the fuel properties and engine performance of blended palm biodiesel-diesel using diethyl ether as additive have been investigated. The properties of B30 blended palm biodiesel-diesel fuel were measured and analyzed statistically with the addition of 2%, 4%, 6% and 8% (by volume) diethyl ether additive. The engine tests were conducted at increasing engine speeds from 1500 rpm to 3500 rpm and under constant load. Optimization of independent variables was performed using the desirability approach of the response surface methodology (RSM) with the goal of minimizing emissions and maximizing performance parameters. The experiments were designed using a statistical tool known as design of experiments (DoE) based on RSM.
Keywords: diesel engine; blended fuel; diethyl ether additive; cycle to cycle variations; wavelet analysis; response surface methodology (RSM)
1. Introduction
Interest in biodiesel is continuing to increase around the whole world. This is motivated primarily by concerns about greenhouse gas (GHG) emissions and global climate change, as well as the desire for renewable/sustainable energy sources, and an interest in developing domestic and more secure fuel supplies. Biodiesel is simple to use in compression ignition diesel engines with few or no modifications. In addition, it can be blended at any level with mineral diesel to create a biodiesel-diesel blend. In recent years, several countries have embarked on legislative and/or regulatory pathways that encourage the increased use of biodiesel fuel as a diesel fuel alternative. Biodiesel, a promising oxygenated fuel generated from natural and renewable sources, is a fuel comprised of monoalkyl esters of long-chain fatty acids derived from renewable feedstocks. It is increasingly being examined as a potential substitute for conventional high-pollutant petroleum fuels because it is a biodegradable, non-toxic, and it relatively clean-burning fuel. Biodiesel can reduce
some of the exhaust emissions compared to petroleum-based diesel when burned, whether used in pure form or blended with mineral diesel. These reductions depend on the type of biofuel and its percentage in the blends with mineral diesel fuel [1,2]. Furthermore, it does not contribute to a net rise in the level of carbon dioxide in the atmosphere and minimizes the intensity of the greenhouse effect [3,4]. Biodiesel is also better than diesel in terms of aromatic content and biodegradability [5,6]. Palm biodiesel is efficient, clean and it is a natural energy alternative to petroleum fuel. Due to the high production rate of the palm plant and also its high oil content it has potential to meet the future demand [7]. A high oil yield of any feedstock is necessary for ensuring a large production scale at cheap prices. In terms of the production cost, palm oil stands out as the least expensive oil per tonne to produce compared with other major vegetable oils [4]. Biodiesel can be utilized neat or as a blend with diesel fuel in CI engines to reduce exhaust gas emissions [8,9]. However, compared to diesel fuel the use of palm biodiesel has some important disadvantages, namely its high viscosity and low energy content. The high viscosity can lead to larger droplet size, poor vaporization and narrow injection spray angle. The fuel density is also an important parameter, as fuel injection systems measures fuel by volume and thus the engine output power is influenced by changes in density due to the different injected fuel masses [10]. On the other hand, the energy content of the fuel has a direct influence on the engine power output and the usage of fuel with a lower energy content causes lower engine speed and power [11]. Furthermore, palm biodiesel has higher pour point and cloud points which limit its use in cold climate regions, lower oxidative stability, shortened storage life and higher organic carbon emissions. To solve these problems, many researchers have focused on diesel-biodiesel blends which are considered as a viable fuel at low blending ratios [12]. At present, concern about environmental regulations has been the major reason to look for alternative fuels. The use of blended biodiesel-diesel fuel has presented a promising alternative in the world which is limited to low blending ratio (up to 20%). Fuel additives are the most viable option introduced to improve the fuel properties at high blending ratio. However the utilization of these additives is restricted by their economic feasibility, toxicity and the properties of the blended fuels [13–15]. The aim of this study was to investigate the feasibility of using blended palm biodiesel-diesel fuel with diethyl ether additive at high blending ratio. The blended fuel properties were characterized according to the American society for testing and materials blended fuel standard ASTM D7467. The engine performance and exhaust emissions with blended fuel and mineral diesel as a baseline fuel were investigated and discussed. Statistical analysis was use to evaluate the fuel properties and the theoretical response surface optimization method was used to optimize the engine test experimental results.
2. Methodology
2.1. Material and Method of Fuel Preparation
Palm oil biodiesel was provided by a local commercial company from a processing plant (Selangor, Malaysia) and the diesel fuel was obtained from a local petrol station (Pekan, Pahang, Malaysia). Diethyl ether with a purity of 99.5 was provided by a chemical supplier (Permula Sdn. Bhd, Kuala Terengganu, Malaysia) and used as a fuel additive. The blending of the fuel samples was performed in a chemistry laboratory under controlled environmental conditions using an electrical magnetic stirrer. Diethyl ether was added into the fuel at 2%, 4%, 6% and 8% and stirred at low stirring speed for an additional 15 min. The fuel samples were kept at room temperature for about 0.5 h to reach the equilibrium state before they used in any test. Five samples of fuel were prepared in this study, in addition to reference palm oil biodiesel and the mineral diesel samples.
2.2. Fatty Acid Composition and Fuel Properties
The palm oil biodiesel fatty acid composition was analyzed using a model 6890 gas chromatograph (GC) from Agilent Technologies (Santa Clara, CA, USA). Helium gas was used as a carrier gas in this study with a flow rate of 1.1 mL/min. An Agilent GC Column Model 19091S-433
Energies2015,8, 14136–14150
with 30 m length and 0.25 mm diameter with 0.25µm film thickness was used. The column head pressure was 17.63 psi with 1.1 mL/min initial flow and velocity of 31 cm/s. The flame ionization detector (FID) and injector temperatures were 250˝C and 240˝C, respectively. The oven temperature was held at 140˝C for 2 min, and then increased to 220˝C at a rate of 8˝C/min. The fuel properties were measured in the laboratory following the ASTM standard method procedures specified for each property measurement. The fuel viscosity, density, acid value, cloud point and pour point were measured according to ASTM 445-01, ASTM D1298, ASTM D664, ASTM D-2500 and ASTM D-97, respectively. The fuel energy content was measured using a model 6772 oxygen bomb calorimeter (Parr, Moline, IL, USA) according to the procedure specified by the manufacturer.
2.3. Diesel Engine Experimental Setup
The fuel samples were tested using a water cooled 4-cylinder 4D68 diesel engine (Mitsubishi, Tokyo, Japan) with a compression ratio of 22.4:1, total displacement of 1.998 L, and bore to stroke ratio of 0.89. The engine is coupled with an eddy current dynamometer of 150 kW capacity to measure and control the effective torque and engine speed using a Dynalec (Shivane, Pune, India). This engine is equipped with an exhaust gas recirculation system which was set off in this study. The fuel engine tests were performed at 50% load and increasing speed from 1500 rpm to 3500 rpm with increments of 500 rpm.
2.4. Fuel Property Statistical Analysis
Fuel properties statistical analysis was conducted on the collected experimental data for different properties. The analysis of variance (ANOVA) was used to indicate the level of significance of the diethyl ether additive effects on the fuel properties. In this analysis, DF represents the degree of freedom,Fvalue represents the probability distribution in repeated sampling, andPrrepresents the weight of significance. The difference between the fuels for certain property is considered significant when the value ofPr > Fis less than the significance level. TheR-square value and the mean of the dependent variable are also shown in the ANOVA analysis. Furthermore, Tukey’s grouping method was used to evaluate the effect of additive on the measured properties at different percentages. This technique provides some specific information on the interactions between the variables. In this analysis, if the variables have the same letter, it means the difference between those variables is not statistically significant [16]. All the statistical analysis in this study was performed at a 0.05 significance level (95% confidence level).
2.5. Response Surface Methodology
In statistics, the response surface methodology (RSM) was introduced by Box and Wilson in 1951. Box and Wilson suggested using a 2nd degree polynomial model to do this. RSM uses statistical techniques to form an equation between output variables (y) and input variables (x):
Y “ f1pxqβ`ε (1)
where x=(x1,x2, . . . ,xk), f(x) is a vector function of p elements that consists of powers and cross-products of powers of x1,x2, . . . , xk up to a certain degree denoted byd (>1), βis a vector ofpunknown constant coefficients referred to as parameters, andεis a random experimental error assumed to have a zero mean. This is conditioned on the belief that Equation (1) provides an adequate representation of the response. In this case, the quantity f´(x)βrepresents the mean response, that is, the expected value ofy, and is denoted byµ(x). Two important models are commonly used in RSM. These are special cases of Equation (1) and include the first-degree model (d= 1):
y“β0`
k ÿ
i“1
βixi`ε (2)
and the second-degree model (d= 2):
y“β0`
k ÿ
i“1 βixi`
ÿ ÿ
iăj
βijxixj` k ÿ
i“1
βiix2i `ε (3)
The purpose of considering a model such as Equation (1) is threefold:
1. To establish a relationship, albeit approximate, betweenyandx1,x2, . . . ,xkthat can be used to predict response values for given settings of the control variables.
2. To determine, through hypothesis testing, significance of the factors whose levels are represented byx1,x2, . . . ,xk.
3. To determine the optimum settings ofx1,x2, . . . ,xk. 3. Results and Discussion
3.1. Fatty Acid Profile
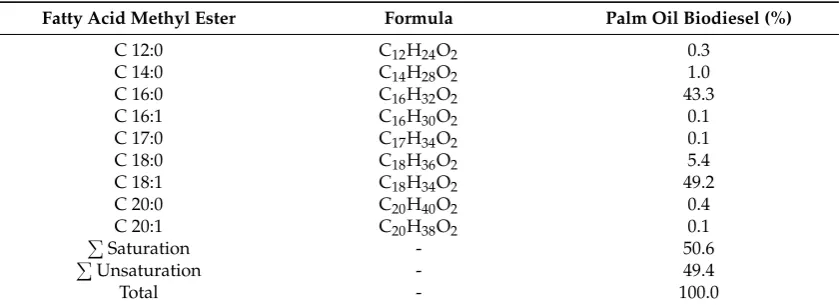
The fatty acid profile of a biodiesel fuel is very important due to the direct effect of biodiesel composition on the fuel properties. Based on the GC test results for the palm oil biodiesel shown in Figure 1, the fuel composition was analyzed to evaluate the different properties of the studied biodiesel. The test analysis results shown in Table1indicate that the primary constituents in the palm oil biodiesel were oleic (C 18:1) at 49.2% and palmitic (C 16:0) acid at 43.3%. The remainder of the fatty acid profile consisted of 5.4% stearic (C 18:0), 1.0% myristic (C 14:0), 0.4% arachidic (C 20:0), 0.3% lauric (C 12:0), 0.1% palmitoleic (C16:1), 0.1% margaric (C 17:0) and 0.1% eicosenoic (C 20:1) acid. Although oleic is the most abundant acid and an unsaturated fatty acid, the total saturated fatty acid methyl ester is the dominant species in the palm oil biodiesel composition (50.6%). Accordingly, palm oil biodiesel has higher cetane number than fuels produced from less saturated feedstocks such as soybean and rapeseed [17]. Compared to mineral diesel, palm oil biodiesel has a higher cetane number by about 16% [17]. However, the high saturated fatty acid structures for palm oil biodiesel lead to poor cold flow properties of the fuel [18]. Compared to mineral diesel, palm oil biodiesel has a higher pour point (by more than 20˝C) [17], which is one of the major properties that limits the utilization of palm biodiesel fuels, especially in cold climates.
Energies 2015, 8, page–page
4
1. To establish a relationship, albeit approximate, between y and x1, x2, …, xk that can be used
to predict response values for given settings of the control variables.
2. To determine, through hypothesis testing, significance of the factors whose levels are
represented by x1, x2, …, xk.
3. To determine the optimum settings of x1, x2, …, xk.
3. Results and Discussion
3.1. Fatty Acid Profile
The fatty acid profile of a biodiesel fuel is very important due to the direct effect of biodiesel
composition on the fuel properties. Based on the GC test results for the palm oil biodiesel shown in
Figure 1, the fuel composition was analyzed to evaluate the different properties of the studied
biodiesel. The test analysis results shown in Table 1 indicate that the primary constituents in the palm
oil biodiesel were oleic (C 18:1) at 49.2% and palmitic (C 16:0) acid at 43.3%. The remainder of the
fatty acid profile consisted of 5.4% stearic (C 18:0), 1.0% myristic (C 14:0), 0.4% arachidic (C 20:0),
0.3% lauric (C 12:0), 0.1% palmitoleic (C16:1), 0.1% margaric (C 17:0) and 0.1% eicosenoic (C 20:1)
acid. Although oleic is the most abundant acid and an unsaturated fatty acid, the total saturated fatty
acid methyl ester is the dominant species in the palm oil biodiesel composition (50.6%). Accordingly,
palm oil biodiesel has higher cetane number than fuels produced from less saturated feedstocks such
as soybean and rapeseed [17]. Compared to mineral diesel, palm oil biodiesel has a higher cetane
number by about 16% [17]. However, the high saturated fatty acid structures for palm oil biodiesel
lead to poor cold flow properties of the fuel [18]. Compared to mineral diesel, palm oil biodiesel has
a higher pour point (by more than 20 °C) [17], which is one of the major properties that limits the
utilization of palm biodiesel fuels, especially in cold climates.
Figure 1.Chromatogram of palm oil biodiesel.
Table 1. Palm oil biodiesel fatty acid composition.
Fatty Acid Methyl Ester Formula Palm Oil Biodiesel (%)
C 12:0 C12H24O2 0.3
C 14:0 C14H28O2 1.0
C 16:0 C16H32O2 43.3
C 16:1 C16H30O2 0.1
C 17:0 C17H34O2 0.1
C 18:0 C18H36O2 5.4
C 18:1 C18H34O2 49.2
C 20:0 C20H40O2 0.4
C 20:1 C20H38O2 0.1
∑ Saturation ‐ 50.6
∑ Unsaturation ‐ 49.4
[image:4.595.144.452.515.685.2]Total ‐ 100.0
Figure 1.Chromatogram of palm oil biodiesel.
Energies2015,8, 14136–14150
Table 1.Palm oil biodiesel fatty acid composition.
Fatty Acid Methyl Ester Formula Palm Oil Biodiesel (%)
C 12:0 C12H24O2 0.3
C 14:0 C14H28O2 1.0
C 16:0 C16H32O2 43.3
C 16:1 C16H30O2 0.1
C 17:0 C17H34O2 0.1
C 18:0 C18H36O2 5.4
C 18:1 C18H34O2 49.2
C 20:0 C20H40O2 0.4
C 20:1 C20H38O2 0.1
ř
Saturation - 50.6
ř
Unsaturation - 49.4
Total - 100.0
3.2. Fuel Property Analysis
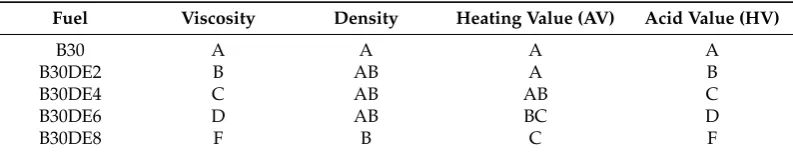
The experimental results of the blended B30 fuel properties with diethyl ether additive have been measured and analysed to evaluate the changes of each property. The additive was used with blended B30 fuel in increasing percentages and the significance of changes in the fuel properties was indicated. The viscosity of the blended B30fuel is 3.95 mm2/s, which is higher than that of diesel fuel by 4%.Figure2presents the viscosity of the blended B30fuel with increasing ratios of diethyl ether additive. It is obvious that using the additive with blended B30fuel further reduces the kinematic viscosity at 40˝C, as the ether additive has aconsiderably lower kinematic viscosity than bothdiesel and biodiesel. From the ANOVA analysis results shown in Table2, since thePr value is less than 5%, the additive has a significant effect on the blended fuel viscosity. Furthermore, from the Tukey grouping analysis shown in Table3, it is concluded that the additive ratio has a statistically significant effect on fuel viscosity.
Energies 2015, 8, page–page
3.2. Fuel Property Analysis
The experimental results of the blended B30 fuel properties with diethyl ether additive have
been measured and analysed to evaluate the changes of each property. The additive was used with
blended B30 fuel in increasing percentages and the significance of changes in the fuel properties was
indicated. The viscosity of the blended B30fuel is 3.95 mm2/s, which is higher than that of diesel fuel
by 4%.Figure 2 presents the viscosity of the blended B30fuel with increasing ratios of diethyl ether
additive. It is obvious that using the additive with blended B30fuel further reduces the kinematic
viscosity at 40 °C, as the ether additive has aconsiderably lower kinematic viscosity than bothdiesel
and biodiesel. From the ANOVA analysis results shown in Table 2, since the Pr value is less than 5%,
the additive has a significant effect on the blended fuel viscosity. Furthermore, from the Tukey
grouping analysis shown in Table 3, it is concluded that the additive ratio has a statistically significant
effect on fuel viscosity.
Figure 2. Effect of increasing diethyl ether percentage on blended B30 fuel viscosity.
Table 2. Analysis of variance (ANOVA) for viscosity.
Source DF Sum of Squares Mean Square F Value Pr > F
Fuel 4 2.19636 0.54909 807.48529 1.67633 10−12
Error 10 0.0068 6.8 10−4 ‐ ‐
Total 14 2.20316 ‐ ‐ ‐
Dependent variable: viscosity, R‐square = 0.997; viscosity mean = 3.36.
Table 3. Tukey grouping results for the fuel properties.
Fuel Viscosity Density Heating Value (AV) Acid Value (HV)
B30 A A A A
B30DE2 B AB A B
B30DE4 C AB AB C
B30DE6 D AB BC D
B30DE8 F B C F
Biodiesel and mineral diesel have very similar densities [19], but it should be considered that the
density of biodiesel is affected by the raw material (feedstock) source used in its production
process [7,20]. Biodiesel has the highest density, so accordingly, the density of the B30 blended fuel
is 2.6% lower than that of B100 due to the effect of blending with diesel. Figure 3 presents the density
of the blended B30 fuel with different ratios of diethyl ether additive. It is obvious that by adopting
an additive the density of blended B30 fuel is further reduced with the increasing additive ratio,
as the ether additive has a remarkably lower density than either diesel or biodiesel fuel. From the
ANOVA analysis results shown in Table 4, since the Pr value is less than 5%, the additives have a
significant effect on the blended fuel density. However, from Tukey grouping analysis shown in
Table 3, it is concluded that the statistically significant difference in density starts at 8% additive ratio. Figure 2.Effect of increasing diethyl ether percentage on blended B30 fuel viscosity.
Table 2.Analysis of variance (ANOVA) for viscosity.
Source DF Sum of Squares Mean Square FValue Pr>F
Fuel 4 2.19636 0.54909 807.48529 1.67633ˆ10´12
Error 10 0.0068 6.8ˆ10´4 -
-Total 14 2.20316 - -
-Dependent variable: viscosity,R-square = 0.997; viscosity mean = 3.36.
Table 3.Tukey grouping results for the fuel properties.
Fuel Viscosity Density Heating Value (AV) Acid Value (HV)
B30 A A A A
B30DE2 B AB A B
B30DE4 C AB AB C
B30DE6 D AB BC D
B30DE8 F B C F
Biodiesel and mineral diesel have very similar densities [19], but it should be considered that the density of biodiesel is affected by the raw material (feedstock) source used in its production process [7,20]. Biodiesel has the highest density, so accordingly, the density of the B30 blended fuel is 2.6% lower than that of B100 due to the effect of blending with diesel. Figure3presents the density of the blended B30 fuel with different ratios of diethyl ether additive. It is obvious that by adopting an additive the density of blended B30 fuel is further reduced with the increasing additive ratio, as the ether additive has a remarkably lower density than either diesel or biodiesel fuel. From the ANOVA analysis results shown in Table4, since thePrvalue is less than 5%, the additives have a significant effect on the blended fuel density. However, from Tukey grouping analysis shown in Table3, it is concluded that the statistically significant difference in density starts at 8% additive ratio.
Energies 2015, 8, page–page
6
Figure 3. Effect of increasing diethyl ether percentage on blended B30 fuel density.
Table 4. ANOVA for density.
Source DF Sum of Squares Mean Square FValue Pr> F Fuel 4 164.4 41.1 4.19388 0.03003
Error 10 98 9.8 ‐ ‐
Total 14 262.4 ‐ ‐ ‐
Dependent variable: density, R‐square = 0.626; density mean = 851.8.
Biodiesel fuels have different heating values, which depend mainly on the raw material source
(biodiesel feedstock) [1]. Typically, biodiesel has a heating value 10%–15% lower than that of
conventional diesel. The measured HV of the blended B30 fuel is lower than that of the diesel fuel by
4.6% due to the effect of blending with palm oil biodiesel. Figure 4 shows further reduction of HV
with the increasing the fractions of additive due to the lower heating value of the chemical additives.
From the ANOVA analysis results shown in Table 5, since the Pr value is less than 5%, the additive
has a significant effect on the blended fuel viscosity. Furthermore, from the Tukey grouping analysis
shown in Table 3, it is concluded that the additive ratio has a statistically significant effect on fuel
heating value.
Figure 4. Effect of increasing diethyl ether percentage on blended B30 fuel heating value.
Table 5. ANOVA for the heating value.
Source DF Sum of Squares Mean Square FValue Pr > F Fuel 4 6.25944 1.56486 199.59949 1.71999 10−9
Error 10 0.0784 0.00784 ‐ ‐
Total 14 6.33784 ‐ ‐ ‐
Dependent variable: heating value, R‐square = 0.987; heating value mean = 42.34.
To further understand of the effect of diesel blending and additive usage on biodiesel, the acid
value is also measured. The acid number or neutralization number is a measure of the free fatty acids
contained in a fuel sample. Due to the higher amount of free fatty acids in the composition of palm
Figure 3.Effect of increasing diethyl ether percentage on blended B30 fuel density.
Table 4.ANOVA for density.
Source DF Sum of Squares Mean Square FValue Pr>F
Fuel 4 164.4 41.1 4.19388 0.03003
Error 10 98 9.8 -
-Total 14 262.4 - -
-Dependent variable: density,R-square = 0.626; density mean = 851.8.
Biodiesel fuels have different heating values, which depend mainly on the raw material source (biodiesel feedstock) [1]. Typically, biodiesel has a heating value 10%–15% lower than that of conventional diesel. The measured HV of the blended B30 fuel is lower than that of the diesel fuel by 4.6% due to the effect of blending with palm oil biodiesel. Figure4shows further reduction of HV with the increasing the fractions of additive due to the lower heating value of the chemical additives. From the ANOVA analysis results shown in Table5, since thePrvalue is less than 5%, the additive has a significant effect on the blended fuel viscosity. Furthermore, from the Tukey grouping analysis shown in Table3, it is concluded that the additive ratio has a statistically significant effect on fuel heating value.
Energies2015,8, 14136–14150
Energies 2015, 8, page–page
6
Figure 3. Effect of increasing diethyl ether percentage on blended B30 fuel density.
Table 4. ANOVA for density.
Source DF Sum of Squares Mean Square FValue Pr> F Fuel 4 164.4 41.1 4.19388 0.03003
Error 10 98 9.8 ‐ ‐
Total 14 262.4 ‐ ‐ ‐
Dependent variable: density, R‐square = 0.626; density mean = 851.8.
Biodiesel fuels have different heating values, which depend mainly on the raw material source
(biodiesel feedstock) [1]. Typically, biodiesel has a heating value 10%–15% lower than that of
conventional diesel. The measured HV of the blended B30 fuel is lower than that of the diesel fuel by
4.6% due to the effect of blending with palm oil biodiesel. Figure 4 shows further reduction of HV
with the increasing the fractions of additive due to the lower heating value of the chemical additives.
From the ANOVA analysis results shown in Table 5, since the Pr value is less than 5%, the additive
has a significant effect on the blended fuel viscosity. Furthermore, from the Tukey grouping analysis
shown in Table 3, it is concluded that the additive ratio has a statistically significant effect on fuel
heating value.
Figure 4. Effect of increasing diethyl ether percentage on blended B30 fuel heating value.
Table 5. ANOVA for the heating value.
Source DF Sum of Squares Mean Square FValue Pr > F Fuel 4 6.25944 1.56486 199.59949 1.71999 10−9
Error 10 0.0784 0.00784 ‐ ‐
Total 14 6.33784 ‐ ‐ ‐
Dependent variable: heating value, R‐square = 0.987; heating value mean = 42.34.
To further understand of the effect of diesel blending and additive usage on biodiesel, the acid
value is also measured. The acid number or neutralization number is a measure of the free fatty acids
contained in a fuel sample. Due to the higher amount of free fatty acids in the composition of palm
Figure 4.Effect of increasing diethyl ether percentage on blended B30 fuel heating value.
Table 5.ANOVA for the heating value.
Source DF Sum of Squares Mean Square FValue Pr>F
Fuel 4 6.25944 1.56486 199.59949 1.71999ˆ10´9
Error 10 0.0784 0.00784 -
-Total 14 6.33784 - -
-Dependent variable: heating value,R-square = 0.987; heating value mean = 42.34.
To further understand of the effect of diesel blending and additive usage on biodiesel, the acid value is also measured. The acid number or neutralization number is a measure of the free fatty acids contained in a fuel sample. Due to the higher amount of free fatty acids in the composition of palm oil biodiesel, it has the highest acid value (0.49 mg KOH/g) and conventional diesel has the lower acid value (0.16 mg KOH/g). The acid value of the blended biodiesel-diesel fuel decreases with increasing diesel fuel in the blend indicating that mineral diesel acts as diluent for the palm oil methyl ester. Accordingly, the acid value of the B30 blended fuel is 0.26 mg KOH/g, which is higher than that of the diesel fuel by about 62.5%. Figure5 shows the acid value of the blended B30 fuel with diethyl ether at different additive ratios. The addition of the additive to the blended fuel improves the acid value, and further reduction in the acid value is achieved by increasing the additive percentage. This is expected, as the free fatty acid present in the blended fuel B30 will dilute with ether additive, resulting in a reduction in the acid value [21]. From the ANOVA analysis results shown in Table6, since thePrvalue is less than 5%, the additives have a significant effect on the blended fuel density. However, from Tukey grouping analysis shown in Table3, it is concluded that the statistically significant deference in acid value starts at 6% additive ratio.
Energies 2015, 8, page–page
oil biodiesel, it has the highest acid value (0.49 mg KOH/g) and conventional diesel has the lower
acid value (0.16 mg KOH/g). The acid value of the blended biodiesel‐diesel fuel decreases with
increasing diesel fuel in the blend indicating that mineral diesel acts as diluent for the palm oil methyl
ester. Accordingly, the acid value of the B30 blended fuel is 0.26 mg KOH/g, which is higher than that
of the diesel fuel by about 62.5%. Figure 5 shows the acid value of the blended B30 fuel with diethyl
ether at different additive ratios. The addition of the additive to the blended fuel improves the acid
value, and further reduction in the acid value is achieved by increasing the additive percentage. This
is expected, as the free fatty acid present in the blended fuel B30 will dilute with ether additive,
resulting in a reduction in the acid value [21]. From the ANOVA analysis results shown in Table 6,
since the Pr value is less than 5%, the additives have a significant effect on the blended fuel density.
However, from Tukey grouping analysis shown in Table 3, it is concluded that the statistically
significant deference in acid value starts at 6% additive ratio.
Figure 5. Effect of increasing diethyl ether percentage on blended B30 fuel acid value.
Table 6. ANOVA for the acid value.
Source DF Sum of Squares Mean Square F Value Pr > F Fuel 4 0.00204 5.1 × 10⁻⁴ 34 8.52831 × 10⁻⁶ Error 10 1.5 × 10⁻⁴ 1.5 × 10⁻⁵ ‐ ‐
Total 14 0.00219 ‐ ‐ ‐
Dependent variable: acid value, R‐square = 0.932; Acid value mean = 0.248.
The pour point is the lowest temperature used to characterize cold flow properties and the cloud
point is the highest. Although most of the properties of biodiesel fuels are comparable with those of
diesel fuel, both the pour point and cloud point are widely different, which indicates that the fuel
cold flow behavior is very poor. Increasing the ratio of palm oil biodiesel with mineral diesel in the
blend will worsen the cold flow properties due to the high percentage of saturated fatty acid methyl
ester contained in palm oil biodiesel. The addition of diethyl ether additive to the blended B30 fuel
results in lower PP and CP. This may be attributed to the low freezing point of diethyl ether (−116 °C),
which is much lower than the PP and CP obtained for diesel and palm oil methyl ester (POME).
Figure 6 shows the trend of change in CP with increasing additive percentage, where the CP for B30
blended fuel decreased by 3 °C at an 8% additive ratio. Figure 7 shows that the addition of diethyl
ether additive has resulted in a reduction of the PP of the blended B30 fuel with the increasing
additive ratio. The initial PP value of blended B30 fuel was − 4 °C and it displayed a reduction of 2 °C
with the addition of 6% and 8% additive compared to 1 °C with 2% and 4% additive ratio, indicating
a significant effect of the additive ratio on the improvement of blended fuel pour point. This reduction
in blended fuel PP is due to the disruption of crystalline growth at sub‐ambient temperatures. Ether
additives have significantly different chemical structure which can cause disorder by disrupting the
spacing between molecules. This disorder results in the formation of crystal nuclei with less stable
chain packing followed by the transformation to a more stable form at lower temperatures [21].
Figure 5.Effect of increasing diethyl ether percentage on blended B30 fuel acid value.
Table 6.ANOVA for the acid value.
Source DF Sum of Squares Mean Square FValue Pr>F
Fuel 4 0.00204 5.1ˆ10´4 34 8.52831ˆ10´6
Error 10 1.5ˆ10´4 1.5ˆ10´5 -
-Total 14 0.00219 - -
-Dependent variable: acid value,R-square = 0.932; Acid value mean = 0.248.
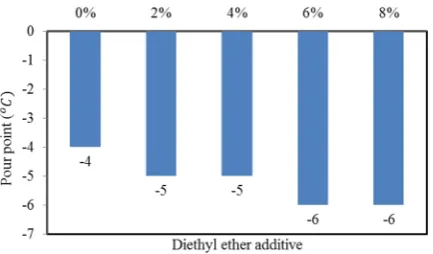
The pour point is the lowest temperature used to characterize cold flow properties and the cloud point is the highest. Although most of the properties of biodiesel fuels are comparable with those of diesel fuel, both the pour point and cloud point are widely different, which indicates that the fuel cold flow behavior is very poor. Increasing the ratio of palm oil biodiesel with mineral diesel in the blend will worsen the cold flow properties due to the high percentage of saturated fatty acid methyl ester contained in palm oil biodiesel. The addition of diethyl ether additive to the blended B30 fuel results in lower PP and CP. This may be attributed to the low freezing point of diethyl ether (´116˝C), which is much lower than the PP and CP obtained for diesel and palm oil methyl ester (POME). Figure6 shows the trend of change in CP with increasing additive percentage, where the CP for B30 blended fuel decreased by 3˝C at an 8% additive ratio. Figure 7 shows that the addition of diethyl ether additive has resulted in a reduction of the PP of the blended B30 fuel with the increasing additive ratio. The initial PP value of blended B30 fuel was´4˝C and it displayed a reduction of 2˝C with the addition of 6% and 8% additive compared to 1˝C with 2% and 4% additive ratio, indicating a significant effect of the additive ratio on the improvement of blended fuel pour point. This reduction in blended fuel PP is due to the disruption of crystalline growth at sub-ambient temperatures. Ether additives have significantly different chemical structure which can cause disorder by disrupting the spacing between molecules. This disorder results in the formation of crystal nuclei with less stable chain packing followed by the transformation to a more stable form at lower temperatures [21].
Energies 2015, 8, page–page
8
Figure 6. Effect of increasing diethyl ether percentage on blended B30 fuel cloud point.
Figure 7. Effect of increasing diethyl ether percentage on blended B30 fuel pour point.
3.3. Engine Performance
Experimental tests for the engine performance analysis were conducted for diesel and blended
B30 fuel as well as B30 with diethyl ether additive at a ratio of 2%, 4%, 6% and 8%. The aim of these
tests was to provide a clear understanding of the engine performance with blended B30 fuel and
diethyl ether additive at different ratios compared to mineral diesel. All tests were conducted at half
load and five engine speeds ranging from 1500 rpm to 3500 rpm, based on engine performance
curves, with increments of 500 rpm. Figure 8 shows the trend of the engine brake power against the
engine speed for diesel and blended B30 fuel as well as B30 with diethyl ether additive for different
ratios (2%, 4%, 6% and 8%). In general, the brake power increases with the increasing engine speed
for all the tested fuels and the maximum brake power is achieved at 2500 rpm. Furthermore, mineral
diesel fuel has the maximum brake power compared to other tested fuels over the whole range of
engine speeds followed by B30. The figure shows that the uses of diethyl ether additive slightly
reduce the blended fuel brake power. However, the brake power of B30 is not affected by 2% diethyl
ether while it is reduced by 1.0%, 0.66% and 2.1% with 4%, 6% and 8% diethyl ether ratio, respectively,
at 2500 rpm compared to the B30 brake power. The effect of diethyl ether additive with B30 on brake
power seems to be clear at high additive ratios (higher than 4%) with different trends. This is due to
the effect of two conflicting factors, the effect of additive on reducing the fuel viscosity which enhances
the fuel combustion and the effect of additive on reducing the fuel energy content[13].
The brake specific fuel consumption (BSFC) can be considered as a measure of the engine
efficiency in using the supplied fuel to produce work. It is one of the most important parameters to
evaluate engine performance with various fuels based on the engine brake power and fuel mass flow
rate. Figure 9 presents the trend of the engine BSFC against the engine speed for diesel and blended
fuel B30 as well as B30 with diethyl ether additive at different ratios (2%, 4%, 6% and 8%). The test
results show that the BSFC of blended fuel B30 with diethyl ether additive up to 6% is comparable to
that of B30 without additive over the whole engine speeds. The effect of different additives with B30
on BSFC is presented mainly by improving the density of the fuel. As the fuel handled by the injection
system was measured by mass not by volume, the BSFC was calculated on weight basis. Accordingly,
higher density resulted in higher values for BSFC due to the higher mass injection for the same
Figure 6.Effect of increasing diethyl ether percentage on blended B30 fuel cloud point.
Energies 2015, 8, page–page
8
Figure 6. Effect of increasing diethyl ether percentage on blended B30 fuel cloud point.
Figure 7. Effect of increasing diethyl ether percentage on blended B30 fuel pour point.
3.3. Engine Performance
Experimental tests for the engine performance analysis were conducted for diesel and blended
B30 fuel as well as B30 with diethyl ether additive at a ratio of 2%, 4%, 6% and 8%. The aim of these
tests was to provide a clear understanding of the engine performance with blended B30 fuel and
diethyl ether additive at different ratios compared to mineral diesel. All tests were conducted at half
load and five engine speeds ranging from 1500 rpm to 3500 rpm, based on engine performance
curves, with increments of 500 rpm. Figure 8 shows the trend of the engine brake power against the
engine speed for diesel and blended B30 fuel as well as B30 with diethyl ether additive for different
ratios (2%, 4%, 6% and 8%). In general, the brake power increases with the increasing engine speed
for all the tested fuels and the maximum brake power is achieved at 2500 rpm. Furthermore, mineral
diesel fuel has the maximum brake power compared to other tested fuels over the whole range of
engine speeds followed by B30. The figure shows that the uses of diethyl ether additive slightly
reduce the blended fuel brake power. However, the brake power of B30 is not affected by 2% diethyl
ether while it is reduced by 1.0%, 0.66% and 2.1% with 4%, 6% and 8% diethyl ether ratio, respectively,
at 2500 rpm compared to the B30 brake power. The effect of diethyl ether additive with B30 on brake
power seems to be clear at high additive ratios (higher than 4%) with different trends. This is due to
the effect of two conflicting factors, the effect of additive on reducing the fuel viscosity which enhances
the fuel combustion and the effect of additive on reducing the fuel energy content[13].
The brake specific fuel consumption (BSFC) can be considered as a measure of the engine
efficiency in using the supplied fuel to produce work. It is one of the most important parameters to
evaluate engine performance with various fuels based on the engine brake power and fuel mass flow
rate. Figure 9 presents the trend of the engine BSFC against the engine speed for diesel and blended
fuel B30 as well as B30 with diethyl ether additive at different ratios (2%, 4%, 6% and 8%). The test
results show that the BSFC of blended fuel B30 with diethyl ether additive up to 6% is comparable to
that of B30 without additive over the whole engine speeds. The effect of different additives with B30
on BSFC is presented mainly by improving the density of the fuel. As the fuel handled by the injection
system was measured by mass not by volume, the BSFC was calculated on weight basis. Accordingly,
higher density resulted in higher values for BSFC due to the higher mass injection for the same
Figure 7.Effect of increasing diethyl ether percentage on blended B30 fuel pour point.
[image:8.595.191.408.610.737.2]Energies2015,8, 14136–14150
3.3. Engine Performance
Experimental tests for the engine performance analysis were conducted for diesel and blended B30 fuel as well as B30 with diethyl ether additive at a ratio of 2%, 4%, 6% and 8%. The aim of these tests was to provide a clear understanding of the engine performance with blended B30 fuel and diethyl ether additive at different ratios compared to mineral diesel. All tests were conducted at half load and five engine speeds ranging from 1500 rpm to 3500 rpm, based on engine performance curves, with increments of 500 rpm. Figure8shows the trend of the engine brake power against the engine speed for diesel and blended B30 fuel as well as B30 with diethyl ether additive for different ratios (2%, 4%, 6% and 8%). In general, the brake power increases with the increasing engine speed for all the tested fuels and the maximum brake power is achieved at 2500 rpm. Furthermore, mineral diesel fuel has the maximum brake power compared to other tested fuels over the whole range of engine speeds followed by B30. The figure shows that the uses of diethyl ether additive slightly reduce the blended fuel brake power. However, the brake power of B30 is not affected by 2% diethyl ether while it is reduced by 1.0%, 0.66% and 2.1% with 4%, 6% and 8% diethyl ether ratio, respectively, at 2500 rpm compared to the B30 brake power. The effect of diethyl ether additive with B30 on brake power seems to be clear at high additive ratios (higher than 4%) with different trends. This is due to the effect of two conflicting factors, the effect of additive on reducing the fuel viscosity which enhances the fuel combustion and the effect of additive on reducing the fuel energy content[13].
The brake specific fuel consumption (BSFC) can be considered as a measure of the engine efficiency in using the supplied fuel to produce work. It is one of the most important parameters to evaluate engine performance with various fuels based on the engine brake power and fuel mass flow rate. Figure9presents the trend of the engine BSFC against the engine speed for diesel and blended fuel B30 as well as B30 with diethyl ether additive at different ratios (2%, 4%, 6% and 8%). The test results show that the BSFC of blended fuel B30 with diethyl ether additive up to 6% is comparable to that of B30 without additive over the whole engine speeds. The effect of different additives with B30 on BSFC is presented mainly by improving the density of the fuel. As the fuel handled by the injection system was measured by mass not by volume, the BSFC was calculated on weight basis. Accordingly, higher density resulted in higher values for BSFC due to the higher mass injection for the same volume at the same injection pressure. However, the effect of low calorific value of the additive may be present with the increasing additive percentage.
Energies 2015, 8, page–page
volume at the same injection pressure. However, the effect of low calorific value of the additive may
be present with the increasing additive percentage.
Figure 8. Variation of engine brake power for different diethyl ether additive ratios.
Figure 9. Variation of engine brake specific fuel consumption (BSFC) for different diethyl ether additive ratios.
The brake thermal efficiency (BTE) is an indicator for the operation with the test fuel. This
parameter is more appropriate than fuel consumption to evaluate the performance of different fuels,
besides their heating value. Since the thermal efficiency is normalized with the fuel heating value, it
is greatly dependent on the manner in which the energy is converted. Figure 10 presents the trend of
the engine BTE against the engine speed for diesel and blended B30 fuel as well as B30 with diethyl
ether additive for different ratios (2%, 4%, 6% and 8%).
Figure 10. Variation of engine brake thermal efficiency (BTE) for different diethyl ether additive ratios.
In general, the BTE of the blended B30 fuel at different diethyl ether percentages is higher than
that of B30 without additive over the whole engine speed range and increases with the increasing
diethyl ether ratio. The BTE values at 2500 rpm are 21.9%, 22.14%, 22.17%, 22.43% and 22.62% for 0%,
2%, 4%, 6% and 8% diethyl ether ratios, respectively, with blended B30 fuel. This improvement in the
BTE with diethyl ether additive may be attributed to the higher reaction activity with the increasing
additive fraction in the blended fuel, leading to shorter combustion duration [22]. Furthermore,
Figure 8.Variation of engine brake power for different diethyl ether additive ratios.
Energies2015,8, 14136–14150
9
volume at the same injection pressure. However, the effect of low calorific value of the additive may be present with the increasing additive percentage.
Figure 8. Variation of engine brake power for different diethyl ether additive ratios.
Figure 9. Variation of engine brake specific fuel consumption (BSFC) for different diethyl ether additive ratios.
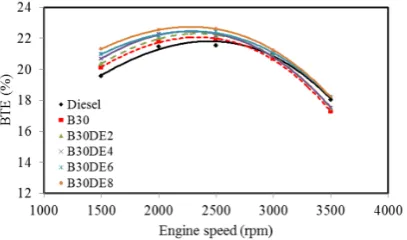
The brake thermal efficiency (BTE) is an indicator for the operation with the test fuel. This parameter is more appropriate than fuel consumption to evaluate the performance of different fuels, besides their heating value. Since the thermal efficiency is normalized with the fuel heating value, it is greatly dependent on the manner in which the energy is converted. Figure 10 presents the trend of the engine BTE against the engine speed for diesel and blended B30 fuel as well as B30 with diethyl ether additive for different ratios (2%, 4%, 6% and 8%).
Figure 10. Variation of engine brake thermal efficiency (BTE) for different diethyl ether additive ratios.
In general, the BTE of the blended B30 fuel at different diethyl ether percentages is higher than that of B30 without additive over the whole engine speed range and increases with the increasing diethyl ether ratio. The BTE values at 2500 rpm are 21.9%, 22.14%, 22.17%, 22.43% and 22.62% for 0%, 2%, 4%, 6% and 8% diethyl ether ratios, respectively, with blended B30 fuel. This improvement in the BTE with diethyl ether additive may be attributed to the higher reaction activity with the increasing additive fraction in the blended fuel, leading to shorter combustion duration [22]. Furthermore, Figure 9. Variation of engine brake specific fuel consumption (BSFC) for different diethyl ether additive ratios.
The brake thermal efficiency (BTE) is an indicator for the operation with the test fuel. This parameter is more appropriate than fuel consumption to evaluate the performance of different fuels, besides their heating value. Since the thermal efficiency is normalized with the fuel heating value, it is greatly dependent on the manner in which the energy is converted. Figure10presents the trend of the engine BTE against the engine speed for diesel and blended B30 fuel as well as B30 with diethyl ether additive for different ratios (2%, 4%, 6% and 8%).
Energies 2015, 8, page–page
9
volume at the same injection pressure. However, the effect of low calorific value of the additive may be present with the increasing additive percentage.
Figure 8. Variation of engine brake power for different diethyl ether additive ratios.
Figure 9. Variation of engine brake specific fuel consumption (BSFC) for different diethyl ether additive ratios.
The brake thermal efficiency (BTE) is an indicator for the operation with the test fuel. This parameter is more appropriate than fuel consumption to evaluate the performance of different fuels, besides their heating value. Since the thermal efficiency is normalized with the fuel heating value, it is greatly dependent on the manner in which the energy is converted. Figure 10 presents the trend of the engine BTE against the engine speed for diesel and blended B30 fuel as well as B30 with diethyl ether additive for different ratios (2%, 4%, 6% and 8%).
Figure 10. Variation of engine brake thermal efficiency (BTE) for different diethyl ether additive ratios.
In general, the BTE of the blended B30 fuel at different diethyl ether percentages is higher than that of B30 without additive over the whole engine speed range and increases with the increasing diethyl ether ratio. The BTE values at 2500 rpm are 21.9%, 22.14%, 22.17%, 22.43% and 22.62% for 0%, 2%, 4%, 6% and 8% diethyl ether ratios, respectively, with blended B30 fuel. This improvement in the BTE with diethyl ether additive may be attributed to the higher reaction activity with the increasing additive fraction in the blended fuel, leading to shorter combustion duration [22]. Furthermore, Figure 10.Variation of engine brake thermal efficiency (BTE) for different diethyl ether additive ratios.
In general, the BTE of the blended B30 fuel at different diethyl ether percentages is higher than that of B30 without additive over the whole engine speed range and increases with the increasing diethyl ether ratio. The BTE values at 2500 rpm are 21.9%, 22.14%, 22.17%, 22.43% and 22.62% for 0%, 2%, 4%, 6% and 8% diethyl ether ratios, respectively, with blended B30 fuel. This improvement in the BTE with diethyl ether additive may be attributed to the higher reaction activity with the increasing additive fraction in the blended fuel, leading to shorter combustion duration [22]. Furthermore, the spray quality is improved due to lower boiling point, density and viscosity of diethyl ether compared to B30.
3.4. Response Surface Methodology Optimization
Experiment variables in the present study including the operating parameters, engine speed and the added volume of biodiesel to diesel fuel were considered as effective factors on the engine performance parameters (power (kW), BSFC (kg/KW¨h) and BTE (%)). Designs that can fit the model must have at least three different levels in each variable. This is satisfied by central composite rotatable designs (CCRD), which have five levels per variable. A central composite design was employed for the present study to obtain the experimental data. Furthermore, the total number of experimental point (N) in a CCRD can be calculated by following equation:
N“2n`2n`n0 (4)
[image:10.595.197.399.87.208.2] [image:10.595.197.401.352.472.2]Energies2015,8, 14136–14150
whereNis the number of experimental runs, n is the number of variables and n0is the number of central points. Center points can be designed to be run together both the factorial points and the axial points. Each factor is varied over five levels: the high level (+1), the low level (´1), the centre points (coded level 0) and two outer points corresponding to value of 2. A CCRD consisting of sixteen factorial points, eight axial points and seven central ones that rendered a total of 31 experimental runs was used to analyse the data acquired from the experimental runs. After carrying out the experiments, the optimal points of the process were obtained by selecting proper weights and range of variations, the independent variables shown in Table7. A multiple regression analysis was carried out to obtain the coefficients and the equations were used to predict the responses. Using the statistically significant model, the correlation between the process parameters and the various responses were obtained. The real-life problems require optimization with the multiple responses of interest. Among them, the desirability approach is found to have benefits like simplicity, availability in the software used and flexibility in weighting and identifying the importance of individual responses.
Table 7.Independent variables for central composite design (CCD).
Codes Factor Levels
Xi Independent Variable
+α +1 0 ´1 ´α
3500 3000 2500 2000 1500 X1 RPM
8 6 4 2 0 X2 Diethyl ether blend
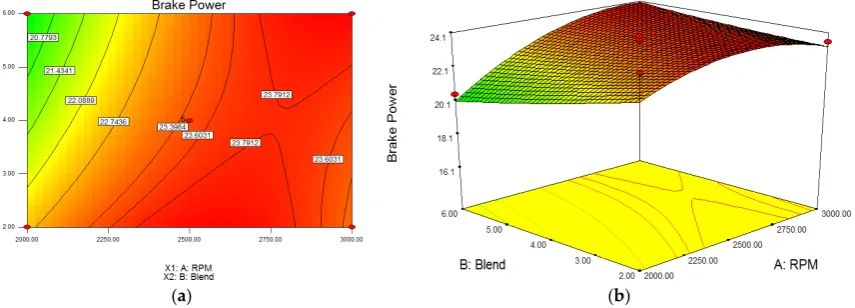
In this research study, RSM was utilized to optimize the performance parameters in respect of speed and biodiesel volume. Speed was also found to have an interaction effect on brake power. The regression statistics goodness of fit (R2) and the goodness of prediction for response of brake power were 96% and 94%, respectively. TheR2value indicates the total variability of the brake power response after considering the significant factors and the adjustedR2value accounts for the number of predictors in the model. Both the values indicate that the model fits the data very well. The interactive effect of biodiesel on brake power is depicted in Figure11. As can be seen in the figure, by increasing the biodiesel added to diesel fuel, the brake power increased. The higher oxygen content of biodiesel could improve the combustion process and as a result the brake power increases. The optimized value of brake power (max.) was found 24.05 kW at 2963.4 rpm and with the addition of 6% (by volume) additive ratio.
Energies 2015, 8, page–page
(a) (b)
Figure 11. The interactive effect biodiesel and engine speed on the brake power. (a) 2D contour plots; and (b) 3D response surface plot.
(a) (b)
Figure 12. The interactive effect biodiesel and engine speed on the BSFC. (a) 2D contour plots; and (b) 3D response surface plot.
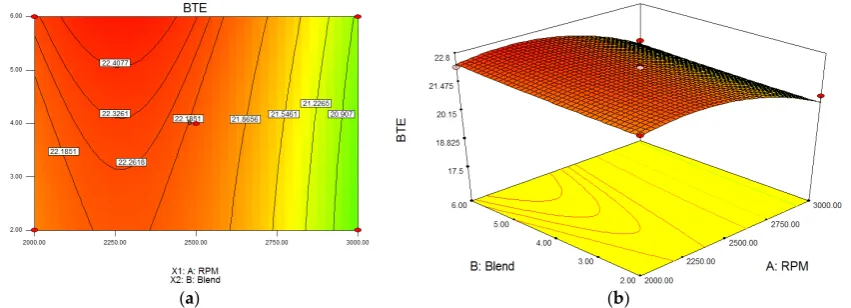
The interactive effect of biodiesel and engine speed on BTE is depicted in Figure 13. As can be
seen in the figure, when the biodiesel added to diesel fuel was increased, the BTE decreased slightly.
The maximum BTE was 22.50% at 2259.76 rpm, and with the addition of 6% (by volume) additive
ratio and minimum BTE has been detected as 20.58% at 3000 rpm of engine speed and with the
addition of 2% (by volume) additive ratio.
(a) (b)
Figure 13. The interactive effect biodiesel and engine speed on the BTE. (a) 2D contour plots; and (b) 3D response surface plot.
The RSM method has been utilized for the optimization of fuel properties. The equation based
on the coded values that was obtained using multiple regression analysis of the experimental data is
presented. The optimum value obtained for the diethyl ether additive ratio was 1.56 (Figure 14).
Figure 11.The interactive effect biodiesel and engine speed on the brake power. (a) 2D contour plots; and (b) 3D response surface plot.
The interactive effect of biodiesel on BSFC is depicted in Figure 12. As can be seen in the figure, increasing the biodiesel added to diesel fuel, the BSFC decreased slightly. The higher oxygen content of biodiesel could improve the combustion process and as a result the BSFC decreases [23].
[image:11.595.84.512.526.680.2]Energies2015,8, 14136–14150
The optimal engine speed was 2209.2 rpm and5.01% (by %vol.) for blend which gave a BSFC of 378.283 (g/kW¨h).
11
(a) (b)
Figure 11. The interactive effect biodiesel and engine speed on the brake power. (a) 2D contour plots; and (b) 3D response surface plot.
(a) (b)
Figure 12. The interactive effect biodiesel and engine speed on the BSFC. (a) 2D contour plots; and (b) 3D response surface plot.
The interactive effect of biodiesel and engine speed on BTE is depicted in Figure 13. As can be
seen in the figure, when the biodiesel added to diesel fuel was increased, the BTE decreased slightly.
The maximum BTE was 22.50% at 2259.76 rpm, and with the addition of 6% (by volume) additive
ratio and minimum BTE has been detected as 20.58% at 3000 rpm of engine speed and with the
addition of 2% (by volume) additive ratio.
(a) (b)
Figure 13. The interactive effect biodiesel and engine speed on the BTE. (a) 2D contour plots; and (b) 3D response surface plot.
The RSM method has been utilized for the optimization of fuel properties. The equation based
on the coded values that was obtained using multiple regression analysis of the experimental data is
presented. The optimum value obtained for the diethyl ether additive ratio was 1.56 (Figure 14).
Figure 12. The interactive effect biodiesel and engine speed on the BSFC. (a) 2D contour plots; and (b) 3D response surface plot.
The interactive effect of biodiesel and engine speed on BTE is depicted in Figure13. As can be seen in the figure, when the biodiesel added to diesel fuel was increased, the BTE decreased slightly. The maximum BTE was 22.50% at 2259.76 rpm, and with the addition of 6% (by volume) additive ratio and minimum BTE has been detected as 20.58% at 3000 rpm of engine speed and with the addition of 2% (by volume) additive ratio.
11
(a) (b)
Figure 11. The interactive effect biodiesel and engine speed on the brake power. (a) 2D contour plots; and (b) 3D response surface plot.
(a) (b)
Figure 12. The interactive effect biodiesel and engine speed on the BSFC. (a) 2D contour plots; and (b) 3D response surface plot.
The interactive effect of biodiesel and engine speed on BTE is depicted in Figure 13. As can be
seen in the figure, when the biodiesel added to diesel fuel was increased, the BTE decreased slightly.
The maximum BTE was 22.50% at 2259.76 rpm, and with the addition of 6% (by volume) additive
ratio and minimum BTE has been detected as 20.58% at 3000 rpm of engine speed and with the
addition of 2% (by volume) additive ratio.
(a) (b)
Figure 13. The interactive effect biodiesel and engine speed on the BTE. (a) 2D contour plots; and (b) 3D response surface plot.
The RSM method has been utilized for the optimization of fuel properties. The equation based
on the coded values that was obtained using multiple regression analysis of the experimental data is
presented. The optimum value obtained for the diethyl ether additive ratio was 1.56 (Figure 14).
Figure 13. The interactive effect biodiesel and engine speed on the BTE. (a) 2D contour plots; and (b) 3D response surface plot.
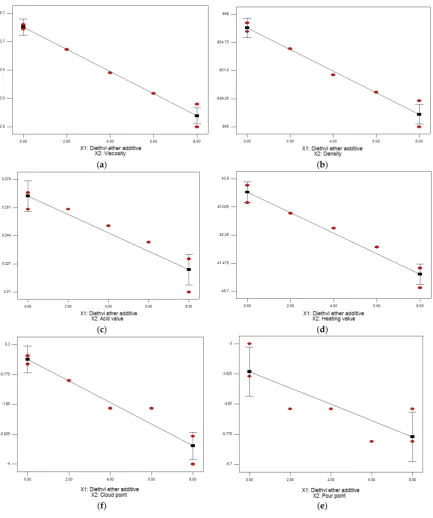
The RSM method has been utilized for the optimization of fuel properties. The equation based on the coded values that was obtained using multiple regression analysis of the experimental data is presented. The optimum value obtained for the diethyl ether additive ratio was 1.56 (Figure14).
A= Diethyl ether additive Viscosity (mm2/s) = 3.33´0.58A Density (kg/m3) = 856.42´1.25A Acid value (mg KOH/g) = 0.25´0.022A Heating value (MJ/kg) = 42.3´1.13A Pour point (˝C) =´4.86´A
Cloud point (˝C) =´1.79´1.56A
[image:12.595.85.511.399.553.2]Energies2015,8, 14136–14150
Energies 2015, 8, page–page
12
A = Diethyl ether additive
Viscosity (mm2/s) = 3.33 − 0.58A
Density (kg/m3) = 856.42 − 1.25A
Acid value (mg KOH/g) = 0.25 − 0.022A
Heating value (MJ/kg) = 42.3 − 1.13A
Pour point (°C) = −4.86 − A
Cloud point (°C) = −1.79 − 1.56A
(a) (b)
(c) (d)
(f) (e)
Figure 14. The optimum diethyl ether additivevalue for different fuel properties. (a) Viscosity; (b) density; (c) acid value; (d) heating value; (e) pour point; and (f) cloud point.
4. Conclusions
In this study, diethyl ether was introduced as a fuel additive for blended B30 palm biodiesel‐diesel
fuel. According to the fuel property test results analysis, the blended fuel density and acid value were
Figure 14. The optimum diethyl ether additivevalue for different fuel properties. (a) Viscosity; (b) density; (c) acid value; (d) heating value; (e) pour point; and (f) cloud point.
4. Conclusions
In this study, diethyl ether was introduced as a fuel additive for blended B30 palm biodiesel-diesel fuel. According to the fuel property test results analysis, the blended fuel density and acid value were significantly improved with increasing additive 8% and 6%, respectively, Furthermore, a significant improvement was observed in the kinematic viscosity of blended fuel with increasing additive ratio starting from 2% additive. The cold flow properties of B30 blended fuel improved with increasing additive content. The pour point and cloud point decreased by 2˝C and 3˝C at 8% additive ratio compared to B30. On the other hand, the fuel heating value was reduced significantly with increasing additive ratio starting from 2% additive. The heating value
[image:13.595.81.515.84.603.2]of B30 decreased by about 4% at 8% additive ratio, which may limit the use of this additive at high percentages. RSM can be employed to optimize the engine performance and exhaust emissions. The design of experiments (DoE) based on RSM was extremely helpful to design the experiments and the statistical analysis helped identify the significant parameters which most The desirability approach method of the RSM was found to be the simplest and most efficient optimization technique in the present study.
Acknowledgments: The authors would like to acknowledge the University Malaysia Pahang for the financial support under UMP Research Grant RDU1403156.
Author Contributions: All the authors contributed to this work. Obed M. Ali designed the study, performed the experiments, and wrote the first draft of the paper. Rizalman Mamat, Gholamhassan Najafi and Talal Yusaf contributed to the conceptual approach and thoroughly revised the paper. Seyed Mohammad Safieddin Ardebili contributed to developing the response surface methodology (RSM) analyses.
Conflicts of Interest:The authors declare no conflict of interest.
References
1. Ghazali, W.N.M.W.; Mamat, R.; Masjuki, H.H.; Najafi, G. Effects of biodiesel from different feedstocks on engine performance and emissions: A review.Renew. Sustain. Energy Rev.2015,51, 585–602.
2. Behçet, R.; Oktay, H.; Çakmak, A.; Aydin, H. Comparison of exhaust emissions of biodiesel-diesel fuel
blends produced from animal fats.Renew. Sustain. Energy Rev.2015,46, 157–165. [CrossRef]
3. Rodrigues, M.C.; Guarieiro, L.L.N.; Cardoso, M.P.; Carvalho, L.S.; da Rocha, G.O.; de Andrade, J.B.
Acetaldehyde and formaldehyde concentrations from sites impacted by heavy-duty diesel vehicles and their correlation with the fuel composition: Diesel and diesel/biodiesel blends. Fuel2012,92, 258–263.
[CrossRef]
4. Lam, M.K.; Tan, K.T.; Lee, K.T.; Mohamed, A.R. Malaysian palm oil: Surviving the foodversusfuel dispute for a sustainable future.Renew. Sustain. Energy Rev.2009,13, 1456–1464. [CrossRef]
5. Mekhilef, S.; Siga, S.; Saidur, R. A review on palm oil biodiesel as a source of renewable fuel.Renew. Sustain. Energy Rev.2011,15, 1937–1949. [CrossRef]
6. Kumar, N.; Chauhan, S.R. Performance and emission characteristics of biodiesel from different origins:
A review.Renew. Sustain. Energy Rev.2013,21, 633–658. [CrossRef]
7. Atabani, A.E.; Silitonga, A.S.; Badruddin, I.A.; Mahlia, T.M.I.; Masjuki, H.H.; Mekhilef, S. A comprehensive review on biodiesel as an alternative energy resource and its characteristics. Renew. Sustain. Energy Rev. 2012,16, 2070–2093. [CrossRef]
8. Bioenergy Biodiesel; Michigan State University: Trowbridge Rd East Lansing, MI, USA, 2014. 9. NBB Benefits of Biodiesel; National Biodiesel Board: Jefferson City, MO, USA, 2009.
10. Imtenan, S.; Masjuki, H.H.; Varman, M.; Kalam, M.A.; Arbab, M.I.; Sajjad, H.; Ashrafur Rahman, S.M.
Impact of oxygenated additives to palm and jatropha biodiesel blends in the context of performance and emissions characteristics of a light-duty diesel engine.Energy Convers. Manag.2014,83, 149–158. [CrossRef]
11. Devaraj, J.; Robinson, Y.; Ganapathi, P. Experimental investigation of performance, emission and
combustion characteristics of waste plastic pyrolysis oil blended with diethyl ether used as fuel for diesel engine.Energy2015,85, 304–309. [CrossRef]
12. Moon, G.; Lee, Y.; Choi, K.; Jeong, D. Emission characteristics of diesel, gas to liquid, and biodiesel-blended fuels in a diesel engine for passenger cars.Fuel2010,89, 3840–3846. [CrossRef]
13. Qi, D.H.; Chen, H.; Geng, L.M.; Bian, Y.Z. Effect of diethyl ether and ethanol additives on the combustion and emission characteristics of biodiesel-diesel blended fuel engine. Renew. Energy2011,36, 1252–1258.
[CrossRef]
14. Rakopoulos, D.C.; Rakopoulos, C.D.; Giakoumis, E.G.; Papagiannakis, R.G.; Kyritsis, D.C. Influence of
properties of various common bio-fuels on the combustion and emission characteristics of high-speed DI (direct injection) diesel engine: Vegetable oil, bio-diesel, ethanol, n-butanol, diethyl ether.Energy2014,73, 354–366. [CrossRef]
15. Rashedul, H.K.; Masjuki, H.H.; Kalam, M.A.; Ashraful, A.M.; Ashrafur Rahman, S.M.; Shahir, S.A. The
effect of additives on properties, performance and emission of biodiesel fuelled compression ignition engine.Energy Convers. Manag.2014,88, 348–364. [CrossRef]